- Trang chủ >>
- Khoa Học Tự Nhiên >>
- Vật lý
Green Energy Technology, Economics and Policy Part 5 pptx
Bạn đang xem bản rút gọn của tài liệu. Xem và tải ngay bản đầy đủ của tài liệu tại đây (264.38 KB, 34 trang )
Next generation green technologies 119
Ocean currents represent a significant, currently untapped, reservoir of energy. The
total worldwide power in ocean currents has been estimated to be about 5,000 GW,
with power densities of up to 15 kW/m
2
.
In large areas with powerful currents, it would be possible to install water turbines
in groups or clusters to create a marine current facility. Turbine spacing would be
determined based on wake interactions and maintenance needs. A 30 MW demonstra-
tion array of vertical turbines in a tidal fence is being investigated in the Philippines
(WEC, 2001).
However a number of potential problems need to be addressed, including avoidance
of drag from cavitations (air bubble formation that creates turbulence and decreases the
efficiency of current-energy harvest), prevention of marine growth build up, corrosion
control, and overall system reliability. Because the logistics of maintenance are likely
to be complex and the costs potentially high, system reliability is of high importance.
Ocean currents flow relatively steadily throughout the year and in some cases the
flow is considerable. An example is the Straits of Florida where the Gulf Stream flows
out of the Caribbean Sea and into the North Atlantic on its way to northern Europe.
The speed of the current is around 7.4 km/h at the surface, but it decreases with depth.
There is a potential extractable power of 1 kW/m
2
near the surface.
A 300 kW full-scale plant installed by Marine Current Turbines (MCT) has been
operating at Lynmouth, Devon (UK) since May 2003. MCT has also been planning
deep sea marine current systems, which could be constructed in large farms and thus use
economies of scale both in construction and maintenance and in the infrastructure for
bringing the electricity to shore. Another approach which has identified the potential
of the Gulf Stream is the Gorlov helical turbine, a vertical-axis turbine which is being
currently prototyped in South Korea.
No currently operating commercial turbines are connected to an electric-power
transmission or distribution grid; however, a number of configurations are being tested
on a small scale. Because no commercial turbines are currently in operation, it is diffi-
cult to assess the costs of current-generated energy and its competitiveness with other
energy sources. Initial studies suggest that for economic exploitation, velocities of at
least 2 m/s would be required, although it is possible to generate energy from velocities
as low as 1 m/s.
Major costs of these systems would be the cables to transport the electricity to the
onshore grid. There are many similarities and common problems with tidal-current
energy extraction.
Potential environmental impacts of ocean current energy extraction include:
• Impacts on marine ecology and conflicts with other potential uses of the same area
of the ocean;
• Resource requirements associated with the construction and operation; and
• Protection of species, particularly fish and marine mammals.
The slow blade velocities should allow water and fish to flow freely and safely through
the structure. Protective fences and sonar-activated brakes could prevent larger marine
mammals from harm. In the siting of the turbines, consideration of impacts on shipping
routes, and present as well as anticipated uses such as commercial and recreational
fishing and recreational diving, would be required.
120 Green Energy Technology, Economics and Policy
The need to introduce possible mitigating factors, such as the establishment of fishery
exclusion zones has to be considered. Concerns have been raised about risks from
slowing the current flow by extracting energy. Local effects, such as temperature and
salinity changes in estuaries caused by changes in the mixing of salt and fresh waters,
would need to be considered for their potential impact on estuary ecosystems (Charlier
and Justus 1993).
Damage to seabed flora is also potentially dangerous and designs are being explored
which are anchored to the seabed but operate at a distance, rather than having towers
built on the bed. Since there are at present no firm plans for deployment of these
devices, it is difficult to evaluate whether this will be a serious problem.
11.3.2 Ocean thermal energy
Ocean thermal energy conversion (OTEC) uses the temperature difference that exists
between deep and shallow waters to run a heat engine. The greatest efficiency and
power is produced with the largest temperature difference. This temperature difference
generally increases near the equator. The ocean surface contains a vast amount of solar
energy, which can potentially be harnessed for human use. If this extraction could be
made cost effective on a large scale, it could be a source of renewable energy (Avery
and Wu, 1994).
The technical challenge of OTEC is to generate significant amounts of power effi-
ciently from this very small temperature ratio. Changes in efficiency of heat exchange
in modern designs allow performance approaching the theoretical maximum efficiency.
The earth’s oceans are continually heated by the sun and cover nearly 70% of the
surface. This makes them the world’s largest solar energy collector and energy storage
system. On an average day, 60 million km
2
of tropical seas absorb an amount of solar
radiation equal in heat content to about 250 billion barrels of oil.
The total energy available is one or two orders of magnitude higher than other
ocean energy options such as wave power. But the small magnitude of the temperature
difference makes energy extraction comparatively difficult and expensive, due to low
thermal efficiency. Earlier OTEC systems had an overall efficiency of 1 to 3%. The
theoretical maximum efficiency lies between 6 and 7%.
Current designs under review will operate closer to the theoretical maximum effi-
ciency. The energy carrier, seawater, is free, though it has an access cost associated with
the pumping materials and pump energy costs. An OTEC plant can be configured to
operate continuously to supply base load power.
As long as the temperature between the warm surface water and the cold deep water
differs by about 20
◦
C, an OTEC system can produce a significant amount of power.
The oceans are thus a vast renewable resource, with the potential to help us produce
billions of watts of electric power. The cold, deep seawater used in the OTEC process
is also rich in nutrients, and it can be used to culture both marine organisms and plant
life near the shore or on land.
This cold seawater is an integral part of the three types of OTEC systems: closed-
cycle, open-cycle, and hybrid. To operate, the cold seawater must be brought to the
surface. This can be accomplished through direct pumping. A second method is to
desalinate the seawater near the sea floor; this lowers its density, which will cause it
to rise up through a pipe to the surface.
Next generation green technologies 121
Working fluid-Ammonia
Pump
Water
in
15’C
Water
in 5’C
Water
out
10’C
OTEC
Condenser
Turbine
Vaporizer
Ocean surface
Depth - 1000 Metre
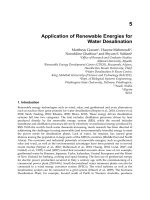
Figure 11.3.1 Scheme of closed cycle OTEC plant
Closed-cycle systems use fluid with a low boiling point, such as ammonia, to
rotate a turbine to generate electricity. Warm surface seawater is pumped through
a heat exchanger where the low-boiling-point fluid is vaporized. The expanding vapor
turns the turbo-generator. Then, cold, deep seawater—pumped through a second heat
exchanger—condenses the vapor back into a liquid, which is then recycled through the
system (Fig 11.3.1).
In 1979 the Natural Energy Laboratory (NEL) and several private-sector partners
developed the mini OTEC experiment, which achieved the first successful at-sea pro-
duction of net electrical power (Trimble and Owens, 1980). The mini OTEC vessel
was moored 2.4 km off the Hawaiian coast and produced enough net electricity to
illuminate the ship’s light bulbs, and run its computers and televisions. NEL in 1999
tested a 250 kW pilot closed-cycle plant.
Open-cycle OTEC uses the tropical oceans’ warm surface water to make electricity.
When warm seawater is placed in a low-pressure container, it boils. The expanding
steam drives a low-pressure turbine attached to an electrical generator. The steam,
which has left its salt and contaminants behind in the low-pressure container, is pure
fresh water. It is condensed back into a liquid by exposure to cold temperatures from
deep-ocean water. This method has the advantage of producing desalinized fresh water,
suitable for drinking water or irrigation.
In 1984 National Renewable Energy Laboratory developed a vertical-spout evapo-
rator to convert warm seawater into low-pressure steam for open-cycle plants. Energy
conversion efficiency of 97% was achieved for the seawater-to-steam conversion pro-
cess. The overall efficiency of an OTEC system was few per cent. In 1993, an open-cycle
OTEC plant at Keahole Point, Hawaii, produced 50 000 watts of electricity during a
net power-producing experiment.
Hybrid cycle combines the features of both the closed-cycle and open-cycle sys-
tems. In a hybrid OTEC system, warm seawater enters a vacuum chamber where
it is flash-evaporated into steam, similar to the open-cycle evaporation process. The
122 Green Energy Technology, Economics and Policy
steam vaporizes the ammonia working fluid of a closed-cycle loop on the other side
of an ammonia vaporizer. The vaporized fluid then drives a turbine to produce electri-
city. The steam condenses within the heat exchanger and provides desalinated water.
The electricity produced by the system can be delivered to a utility grid or used to
manufacture methanol, hydrogen, refined metals, ammonia, and similar products.
OCEES International, Inc. is working with the U.S. Navy on a design for a proposed
13 MW OTEC plant in Diego Garcia, which would replace the current power plant
running diesel generators. The OTEC plant would also provide 1.25 MGD of potable
water to the base. Another U.S. company has proposed building a 10 MW OTEC plant
in Guam.
Lockheed Martin’s Alternative Energy Development team is currently in the final
design phase of a 10 MW closed cycle OTEC pilot system which will become oper-
ational in Hawaii during 2012–2013. This system is being designed to expand to
100 MW commercial systems in the near future.
OTEC has important benefits other than power production. The 5
◦
C cold seawater
made available by an OTEC system creates an opportunity to provide large amounts of
cooling to operations that are related to or close to the plant. The cold seawater from an
OTEC plant can be used in chilled-water coils to provide air-conditioning for buildings.
OTEC technology also supports chilled-soil agriculture. When cold seawater flows
through underground pipes, it chills the surrounding soil. The temperature difference
between plant roots in the cool soil and plant leaves in the warm air allows many
plants that evolved in temperate climates to be grown in the subtropics.
Aquaculture can be a byproduct of OTEC. Deep ocean water contains high
concentrations of essential nutrients that are depleted in surface waters due to bio-
logical consumption. This “artificial upwelling’’ mimics the natural upwelling that is
responsible for fertilizing and supporting marine ecosystems.
Desalinated water can be produced in open- or hybrid-cycle plants using surface
condensers. In a surface condenser, the spent steam is condensed by indirect contact
with the cold seawater. Studies indicate that a 2 MWe net plant could produce about
4 300 m
3
of desalinated water each day.
Hydrogen can be produced via electrolysis using electricity generated by the OTEC
process. The steam generated can be used as a relatively pure medium for electrolysis
with electrolyte compounds added to improve the overall efficiency.
It will be possible to extract many elements contained in salts and other forms and
dissolved in sea water. In the past, most economic analyses concluded that mining the
ocean for trace elements dissolved in solution would be unprofitable, in part because
much energy is required to pump the large volume of water needed. The Japanese
recently began investigating the concept of combining the extraction of uranium
dissolved in seawater with wave-energy technology.
The economics of energy production today have delayed the financing of a perma-
nent, continuously operating OTEC plant. OTEC is very promising as an alternative
energy resource for tropical island communities that rely heavily on imported fuel.
OTEC could provide the islands with much-needed power, as well as desalinated water
and a variety of aquaculture products.
Because OTEC systems have not yet been widely deployed, estimates of their costs
are uncertain. One study estimates power generation costs as low as US $0.07 per
kilowatt-hour, compared with $0.05–$0.07 for subsidized wind systems.
Next generation green technologies 123
Future research needed to accelerate the development of OTEC systems include:
• Characterization of cold-water pipe technology;
• Advanced heat exchanger systems to improve heat transfer performance and
decrease costs; and
• Innovative turbine concepts for the large machines required for open-cycle systems
11.3.3 Salinity gradient power
Salinity gradient power is the energy retrieved from the difference in the salt concen-
tration between seawater and river water. Two practical methods for this are reverse
electro-dialysis (RED) and pressure retarded osmosis (PRO). Both processes rely on
osmosis with ion specific membranes. Osmotic pressure is the chemical potential of
concentrated and dilute solutions of salt.
All energy that is proposed to use salinity gradient technology relies on the evapo-
ration to separate water from salt. Solutions with higher concentrations of salt have
higher osmotic pressure.
The technologies have been tested in laboratory conditions. They are being deve-
loped on commercial scales in the Netherlands (RED) and Norway (PRO). Though the
cost of the membrane is quite high, a new cheap membrane, based on an electrically
modified polyethylene plastic, has been proposed. The world’s first osmotic plant with
capacity of 4 kW was established in 2009 in Tofte, Norway.
Other methods have been proposed and are currently under development include
that based on electric double layer capacitor and vapor pressure difference technolo-
gies. (Olsson et al, 1979; Brogioli, 2009).
The osmotic pressure difference between fresh water and seawater is equivalent
to 240 m of hydraulic head. Theoretically a stream flowing at 1 m
3
/s could produce
1 MW of electricity. The worldwide fresh to seawater salinity resource is estimated at
2.6 TW. This is comparable to the ocean thermal gradient estimated at 2.7 TW. Inland
highly saline lakes have higher potential. The Dead Sea osmotic pressure differential
corresponds to a head of 5 000 m, which is almost twenty times greater than seawater.
Salinity gradient power is a specific renewable energy alternative that creates renew-
able and sustainable power by using naturally occurring processes. This practice does
not contaminate or release CO
2
emissions. Vapor pressure methods will release dis-
solved air containing CO
2
at low pressure, but these non-condensable gases can be
re-dissolved.
In PRO, a membrane separates two solutions, salt water and fresh water. Only water
molecules can pass the semi-permeable membrane. As a result of the osmotic pressure
difference between both solutions, fresh water will diffuse through the membrane in
order to dilute the solution. The pressure drives the turbines and powers the generator
that produces the electrical energy (Brauns, 2007).
RED is the salinity gradient energy retrieved from the difference in the salt con-
centration between seawater and river water. A salt solution and fresh water are let
through a stack of alternating cathode and anode exchange membranes. The chemical
potential difference between salt and fresh water generates a voltage over each mem-
brane and the total potential of the system is the sum of the potential differences over
all membranes.
124 Green Energy Technology, Economics and Policy
RED process works through difference in ion concentration instead of an electric
field, which has implications for the type of membrane needed. As in a fuel cell, the
cells are stacked. A module with a capacity of 250 kW has the size of a shipping
container.
In the Netherlands more than 3 300 m
3
fresh water runs into the sea per second
on average. The membrane halves the pressure differences which results in a water
column of approximately 135 meters. The energy potential is 4.5 GW.
There has generally been a lack of systematic research and development activity in
this area. Early technical advances were not considered promising, mainly because
they relied on expensive membranes. Membrane technologies have advanced, but to
date, they remain the technical barrier to economical energy production. Efforts are
underway to address those issues and alternatively develop designs that eliminate mem-
brane. Additional challenges include high capital costs and low efficiency (Jones and
Rowley, 2003).
Principal advantages are no fuel cost, no CO
2
emissions or other significant effluents
that may interfere with global climate. Inefficient extraction would be acceptable as
long as there is an adequate return on investment. Salts are not consumed in the process.
Systems could be non-periodic, unlike wind or wave power. Systems can be designed
for large or small-scale plants and could be modular in layout.
11.3.4 Tidal power
Tidal power is a form of hydropower that converts the energy of tides into electricity or
other useful forms of power. Tidal power has potential for future electricity generation.
Tides are more predictable than wind energy and solar power (Baker, 1991).
Tidal power is the only form of energy which derives directly from the relative
motions of the earth–moon system, and to a lesser extent from the earth–sun system.
The tidal forces produced by the moon and sun, in combination with earth’s rotation,
are responsible for the generation of the tides.
For producing significant amount of energy out of tidal water turbines, range of
tides should be high. Substantial amount of water should be there for pushing water
through the turbine. Approximately 4 to 5 r meters range of tides is require producing
significant amount electricity.
It is significantly important to spot the appropriate place which provides suitable and
sustainable conditions to produce tidal energy. There are plenty of places around the
globe which provide good conditions for installing water turbines. The Bay of Fundy
in Canada and the Bristol Channel between England and Wales are two particularly
noteworthy examples.
The magnitude of the tide at a location is the result of the changing positions of the
moon and sun relative to the earth, the effects of earth rotation, and the local shape of
the sea floor and coastlines. The stronger the tide, either in water level height or tidal
current velocities, the greater the potential for tidal electricity generation (Hammons,
1993).
Tidal power can be classified into three main types:
• Tidal stream systems make use of the kinetic energy of moving water to power
turbines.
Next generation green technologies 125
Table 11.3.2 Operating and proposed tidal power facilities
Capacity
Country Facility Type (MW) Start year
France La Rance Barrage 240 1966
Canada Annapolis Royal Generating Barrage 18 1984
Station, Nova Scotia
Canada Race Rocks Tidal Power Tidal stream – 2006
Demonstration Project,
Vancouver Island
Russia Kislaya Guba on the Barrage 0.5 2006
Barents Sea
Russia Penzhinskaya Bay Tidal stream – Proposed
Russia Kislaya Guba Tidal stream 12 Under
construction
Republic of Korea Jindo Uldolmok Tidal Tidal stream 90 2009
Power Plant
Republic of Korea Sihwa Lake Tidal Power Tidal stream 254 Under
Plant construction
Republic of Korea Islands west of Incheo Tidal stream 1 320 Proposed
United Kingdom Strangford Lough in Tidal stream 1.2 2008
Northern Ireland.
United Kingdom River Severn Barrage 8 000 (max) Proposed
2 000 (av)
China Jiangxaia Tidal lagoon 3.2 1980
China Yalu river Tidal lagoon 300 Proposed
Philippines San Bernardino Strait Tidal stream 2200 Proposed
• Barrages make use of the potential energy in the difference in height or head
between high and low tides.
• Tidal lagoons can be constructed as self contained structures, not fully across an
estuary.
Tidal stream generators draw energy from currents in much the same way as wind
turbines. Tidal stream turbines may be arrayed in high-velocity areas where natural
tidal current flows are concentrated such as the west and east coasts of Canada, the
Strait of Gibraltar, the Bosporus, and numerous sites in Southeast Asia and Australia.
Some of the operating and proposed facilities are shown in Table 11.3.2.
The higher density of water means that a single generator can provide significant
power at low tidal flow velocities. Water velocities at about one-tenth of the speed of
wind provide the same power for the same size of turbine system. However this limits
the application in practice to places where the tide moves at speeds of at least 1m/s
even at neap tides (Lecomber, 1979).
Tidal stream generators are an immature technology. Only a few commercial scale
production facilities are yet routinely supplying power. No standard technology has
yet emerged as the clear winner. But large varieties of designs are being experimented
with, some very close to large scale deployment.
Several prototypes have shown promise, but they have not operated commercially
for extended periods to establish performances and rates of return on investments. The
126 Green Energy Technology, Economics and Policy
Table 11.3.3 Prototype tidal stream generators
Device Principle/Description Examples
Axial Turbines Similar to the concept of 1. Kvalsund, south of Hammerfest,
traditional windmills; Norway with 300 kW capacity.
operating under the sea 2. Seaflow, off the coast of Lynmouth, Devon,
England with 300 kW capacity.
3. Verdant Power, in the East River
between Queens and Roosevelt Island,
NewYork City.
4. SeaGen, in Strangford Lough in Northern
Ireland has connected 150 kW into the grid.
5. OpenHydro, being tested at the European
Marine Energy Centre (EMEC), in Orkney,
Scotland.
Vertical and Deployed either vertically 1. Gorlov turbine being commercially
horizontal axis or horizontally. piloted on a large scale in S. Korea; starting with
cross-flow a 1 MW plant that started in May 2009 and
turbines expanding to 90 MW by 2013.
2. Proteus, which uses a barrage of vertical axis
cross flow turbines for use mainly in estuaries.
3. Turbine-Generator Unit (TGU) prototype at
Cobscook Bay and Western Passage tidal sites
near Eastport, Maine.
4. Trials in the Strait of Messina, Italy, started in
2001 of the Kobold concept.
Oscillating No rotating component. 1. Stingray, tested off the Scottish
devices Aerofoil sections which are coast with 150 kW capacity.
pushed sideways by the flow. 2. Pulse Tidal, in the Humber estuary.
Venturi effect Uses a shroud to increase the 1. Tidal Energy, commercial trials in the
flow rate through the turbine. Gold Coast, Queensland (2002).
Mounted horizontally or 2. Hydro Venturi, is to be tested in San Francisco
vertically. Bay.
devices could be classified into four, although a number of other approaches are also
being tried (Table 11.3.3).
The cost associated for developing tidal power station can vary depending on the
capacity. Project Severn Estuary in UK cost US $15 billion which produces about
8000 MW. The proposed 2200 MW tidal power station project in San Berandino cost
about US $3 billion.
11.3.5 Wave power
Wave power can be used for electricity generation, as well as water for desalination
and pumping of water into reservoirs. Wave power is distinct from the diurnal flux of
tidal power and the steady flow of ocean currents.
Waves are generated by wind passing over the surface of the sea. As long as the
waves propagate slower than the wind speed just above the waves, there is an energy
transfer from the wind to the waves. Both air pressure differences between the upwind
Next generation green technologies 127
20
30
100
70
50
40
40
20
10
20
40
50
100
70
50
40
30
30
20
15
15
15
10
20
30
50
40
20
15
15
40
40
60
70
50
20
15
40
40
20
100
100
50
30
40
50
60
100
Figure 11.3.2 Approximate global distribution of wave power levels (kW/m of wave fuel)
and the lee side of a wave crest, as well as friction on the water surface by the wind
causes the growth of the waves (Cruz, 2008).
Wave height is determined by wind speed, the duration of time the wind has been
blowing, fetch or the distance over which the wind blows and by the depth and topo-
graphy of the seafloor. The depth and topography of the sea floor can focus or disperse
the energy of the waves. A given wind speed has a matching practical limit over which
time or distance will not produce larger waves.
In general, larger waves are more powerful but wave power is also determined by
wave speed, wavelength, and water density. When an object bobs up and down on
a ripple in a pond, it experiences an elliptical trajectory. This oscillatory motion is
highest at the surface and diminishes exponentially with depth.
The waves propagate on the ocean surface, and the wave energy is also transported
horizontally with the group velocity. The group velocity of a wave is the velocity with
which the overall shape of the wave’s amplitudes propagates through space. The mean
transport rate of the wave energy through a vertical plane of unit width, parallel to a
wave crest, is called the wave energy flux or wave power (McCormick, 2007).
Wave energy can be considered as a concentrated form of solar energy. Winds,
generated by the differential heating of the earth, pass over open bodies of water,
transferring some of their energy to form waves. The amount of energy transferred,
and hence the size of the resulting waves, depends on the wind speed, the length
of time for which the wind blows and the distance over which it blows. The useful
worldwide resource has been estimated at >2 TW (WEC, 1993). The approximate
global distribution of wave power levels is given in Fig. 11.3.2.
Wave power generation is not currently a widely employed commercial technology
although there have been attempts at using it since at least 1890. The world’s first
commercial wave farm is based in Portugal, at the Aguçadoura Wave Park, which
consists of three 750 kilowatt Pelamis devices.
128 Green Energy Technology, Economics and Policy
There is a large amount of ongoing work on wave energy schemes. The devices could
be deployed on the shoreline, near the shore and offshore:
Shoreline Devices: These devices are fixed to or embedded in the shoreline itself. It
has the advantage of easier maintenance and/or installation. These would not require
deep water moorings or long lengths of underwater electrical cable. However, they
would experience a much less powerful wave regime. This could be partially com-
pensated by natural energy concentration. The deployment of such schemes could be
limited by requirements for shoreline geology, tidal range and preservation of coastal
scenery.
One major class of shoreline device is the oscillating water column (OWC). It con-
sists of a partially submerged, hollow structure, which is open to the sea below the
water line. This structure encloses a column of air on top of a column of water. As
waves impinge upon the device they cause the water column to rise and fall, which
alternatively compresses and depressurizes the air column. If this trapped air is allowed
to flow to and from the atmosphere via a turbine, energy can be extracted from the
system and used to generate electricity (Falnes, 2002).
Nearshore Devices: The main prototype device for moderate water depths (i.e.
<20 m) is the OSPREY developed by Wavegen. This is a 2 MW OWC, with pro-
vision for inclusion of a 1.5 MW wind turbine. Since there could be environmental
objections to large farms of wind or wave energy devices close to the shore, this system
aims to maximize the amount of energy produced from a given amount of near shore
area (Thorpe, 1999).
Offshore Devices: This class of device exploits the more powerful wave regimes
available in deep water (>40 m depth) before energy dissipation mechanisms have
had a significant effect. In order to extract the maximum amount of energy from the
waves, the devices need to be at or near the surface and so they usually require flexible
moorings and electrical transmission cables. More recent designs for offshore devices
have also concentrated on small, modular devices. The McCabe wave pump, OPT
wave energy converter, Pelamis and Archimedes wave swing are some of the examples.
Some examples of wave power systems are given in Table 11.3.4.
The major technical challenges in deploying wave power devices are:
• The device needs to capture a reasonable fraction of the wave energy in irregular
waves, in a wide range of sea states.
• There is an extremely large fluctuation of power in the waves. The peak absorption
capacity needs to be much (more than 10 times) larger than the mean power. For
wave power the ratio is typically 4.
• The device has to efficiently convert wave motion into electricity. Wave power is
available at low speed and high force, and the motion of forces is not in a single
direction. Most readily-available electric generators operate at higher speeds, and
most readily-available turbines require a constant, steady flow.
• The device has to be able to survive storm damage and saltwater corrosion.
At present, the main stumbling block to deployment of wave energy devices is funding.
The capital costs are the problem, as it is hard to get companies to invest in technologies
that have not yet been completely proved. The position is similar to other forms of
renewable energy sources.
Next generation green technologies 129
Table 11.3.4 Some examples of wave power systems
Country Technology used Project/Location Type Capacity
Portugal Pelamis Wave Energy Aguçadoura Wave Park/Póvoa Offshore 2.25 MW
Converter de Varzim
Denmark Wave Dragon DanishWave Energy Test Center/ Offshore 4–11 MW
Nissum Bredning fjord
Portugal AquaBuOY Finavera Renewables Offshore –
Australia CETO Wave Power Biopower/Carnegie Corporation/ Offshore –
Fremantle,Western Australia
Australia Oceanlinx Near Port Kembla, near Sydney Offshore 2 MWe
UK Wavebob Galway Bay near Galway in Ireland Offshore –
UK Pelamis Wave Energy European Marine Energy Centre/ Offshore 3 MW
Converter Orkeny
UK Anaconda Wave Engineering and Physical Sciences Offshore ∼1MW
Energy Converter Research Council (EPSRC)/
Checkmate SeaEnergy
UK Oyster wave energy Aquamarine Power/European Marine Nearshore 100 MW
converter Energy Centre/Orkney or more
Sweden WEC (wave energy Centre for Renewable Electric Energy Offshore 10 kW
converter) with a Conversion, Uppsala University/
linear generator Lysekil Project/Lysekil
USA EPAM SRI International/Santa Cruz, Calif Offshore –
USA PowerBuoy Pacific Northwest Generating Offshore 150 kW
Cooperative/Reedsport, Oregon
Until the technology matures, estimates of the cost of power from wave energy
devices represent a snapshot of the status and costs of the designs at the current stages
of their development.
That review found support for this proposition, with the predicted generating costs
of several devices being reduced by factors of two or more as part of the review
activities.
The electricity costs of a number of devices have been evaluated more recently using
the same peer-reviewed methodology developed for the last UK review of wave energy.
These figures show that there have been significant improvements in the predicted
generating costs of devices, so that there are now several with costs of about 5 p/kWh
(US 8 c/kWh) or less at 8% discount rate (if the devices achieve their anticipated
performance) (Thorpe, 1999).
Wave devices that are on-shore have social implications for the surrounding area.
They can be integrated within harbour walls, which can affect shipping and cause noise
pollution. They can create employment in the area and attract visitors.
Offshore devices have an effect on navigation and consultation with affected bodies
must be undertaken. The experiences of other offshore industries, such as oil, should
aid this part of planning for wave devices.
There can be environmental impacts resulting from wave powered devices. Devices
that are on-shore can have environmental benefits, such as helping to reduce the erosion
of the landscape. Any devices off shore can have an effect on the aquatic life in that
area but this again is very site specific and hard to predict. But anchoring systems can
become almost like artificial reefs, creating a place for new colonization.
130 Green Energy Technology, Economics and Policy
11.3.6 Damless hydro
Low head hydro power applications use river current and tidal flows to produce energy.
These applications do not need to dam or retain water to create head. Using the current
of a river or the naturally occurring tidal flow to create electricity may provide a
renewable energy source that will have a minimal impact on the environment (Harvey
and Brown, 1992).
Orthogonal rotor turbines equipped with blades of a symmetric profile can be
regarded as a prospective type of free-flow hydraulic machine which can be installed
either in the free flow in a river channel and ocean or in the channels of chutes,
spillways, and irrigation systems.
A low-head hydro project usually is an installation with a fall of water less than 5 m.
Since no dam is required, low-head hydro has the following advantages:
• No safety risks of having a dam, avoiding the risk of a flash flood caused by a
breached dam;
• Environmental and ecological complications such as submergence of large tracts
of forested and inhabited areas, need for fish ladder, silt accumulation in basin;
Low-head units are necessarily much smaller in capacity that conventional large hydro
turbines. So many units must be built for a given annual energy production. Some of
the costs of small turbine – generator units are offset by lower civil construction cost
(Curtis and Langley, 2004).
Not every site can be economically and ecologically developed. Sites may be too
far from customers to be worth installation of a transmission line, or may lie in areas
particularly sensitive for wildlife.
A hydrokinetic turbine is an integrated turbine generator to produce electricity in
a free flow environment. In-stream Energy Generation Technology (IEGT) turbines
could be used in rivers, man made channels, tidal waters, or ocean currents. These
turbines use the flow of water to turn them, thus generating electricity for the power
grid on nearby land.
A 35 kilowatt hydrokinetic turbine has been installed in the Mississippi River near
Hastings, Minnesota. If the viable river and estuary turbine locations of the US are
made into hydroelectric power sites it is estimated that up to 130 000 gigawatt-hours
per year – about half the yearly production of the country’s dams – could be produced.
The axial flow rotor turbine consists of a concentric hub with radial blades, resem-
bling a wind mill. Either a built-in electrical generator or a hydraulic pump which turns
an electrical generator on land provides the electricity. The open center fan turbine con-
sists of two donut shape turbines which rotate in the opposite direction of the current.
This in turn runs a hydraulic pump that in turn drives a standard electrical generator.
A helical turbine has hydrofoil sections that keep the turbine oriented to the flow
of the water. The leader edge of the blades turns in the direction of the water. The
cycloidic turbine resembles a paddle wheel, where the flow of the water turns the
wheel with lift and drag being optimized. Hydroplane blades are made to oscillate by
the flowing water, thus generating electricity. The FFP turbine generator uses a rim-
mounted, permanent magnet, direct-drive generator with front and rear diffusers and
one moving part (the rotor) to maximize efficiency.
Next generation green technologies 131
The turbines can be installed in a variety of ways, multiple banks set on pilings
driven into the river beds or mounted on existing river structures such as bridge piers.
The turbine generators can be attached to bridge abutments or pilings, which minimize
disruption to river beds.
Turbines are to be deployed in arrays of multiple units spaced no less than 15 m
apart where the site conditions, depth, and needed infrastructure are suitable. Exact
depth and spacing is determined based on site conditions, including current flows and
water depth. Since the turbines do not block waterways, and the water passing through
the device is not subject to high pressure, these systems are designed to not impede or
damage fish or other wildlife.
Another approach is to suspend the turbines from a floating barge. The turbines
suspended from the bottom of a floating barge can accommodate changes in flow. The
barges can be deployed and have the generators come on line more quickly with fewer
disturbances to the river bed. The obvious disadvantage to the barge system would be
interference with navigation and recreational use of the waterway.
Concerns have been raised about the danger to marine animals, such as seals and
fish, from wave and tidal devices. There is no evidence that this is a significant problem.
Such devices may actually benefit the local fauna by creating non-fishing ‘havens’ and
structures such as anchoring devices may create new reefs for fish colonization.
11.4 EN H A NCED GEOTHER MAL SYSTEMS
Enhanced Geothermal Systems (EGS) are a new type of geothermal power technologies
that do not require natural convective hydrothermal resources. Present geothermal
power systems depend on naturally occurring water and rock porosity to carry heat
to the surface. Majority of geothermal energy within drilling reach is in dry and non-
porous rock. EGS technologies “enhance’’ and/or create geothermal resources in this
hot dry rock (HDR) through hydraulic stimulation (Armstead, 1987).
EGS offer great potential for expanding the use of geothermal energy. Present
geothermal power generation comes from hydrothermal reservoirs, and is somewhat
limited in geographic application to specific ideal places.
EGS utilise new techniques to exploit resources that would have been uneconom-
ical in the past. These systems are still in the research phase, and require additional
research, development and deployment for new approaches and to improve con-
ventional approaches, as well as to develop smaller modular units that will allow
economies of scale on the manufacturing level.
Several technical issues need further government-funded research and close collab-
oration with industry in order to make exploitation of geothermal resources more
economically attractive for investors. These are mainly related to exploration of reser-
voirs, drilling and power generation technology, particularly for the exploitation of
low-temperature cycles.
When natural cracks and pores will not allow for economic flow rates, the per-
meability can be enhanced by pumping high pressure cold water down an injection
well into the rock. The injection increases the fluid pressure in the naturally frac-
tured granite which mobilizes shear events, enhancing the permeability of the fracture
system.
132 Green Energy Technology, Economics and Policy
Water travels through fractures in the rock, capturing the heat of the rock until it is
forced out of a second borehole as very hot water, which is converted into electricity
using either a steam turbine or a binary power plant system. All of the water, now
cooled, is injected back into the ground to heat up again in a closed loop.
EGS technologies, like hydrothermal geothermal, are expected to be baseload
resources which produce power 24 hours a day like a fossil plant. Distinct from
hydrothermal, EGS may be feasible anywhere in the world, depending on the economic
limits of drill depth.
EGS is one of the few renewable energy resources that can provide continuous
base-load power with minimal visual and other environmental impacts. Geothermal
systems have a small footprint and virtually no emissions, including carbon dioxide.
Geothermal energy has significant base-load potential, requires no storage, and, thus,
it complements other renewables – solar (CSP and PV), wind, hydropower – in a
lower-carbon energy future.
The accessible geothermal resource, based on existing extractive technology, is large
and contained in a continuum of grades ranging from today’s hydrothermal, convec-
tive systems through high- and mid-grade EGS resources. Improvements to drilling
and power conversion technologies, as well as better understanding of fractured rock
structure and flow properties, benefit all geothermal energy development scenarios.
Field studies conducted worldwide for more than 30 years have shown that EGS
is technically feasible in terms of producing net thermal energy by circulating water
through stimulated regions of rock at depths ranging from 3 to 5 km.
EGS systems are versatile, inherently modular, and scalable from 1 to 50 MWe for
distributed applications to large “power parks,’’ which could provide thousands of
MWe of base-load capacity. EGS also can be easily deployed in larger-scale district
heating and combined heat and power (cogeneration) applications to service both
electric power and heating and cooling for buildings without a need for storage on-site.
Favourable locations are over deep granite covered by a thick (3–5 km) layer of
insulating sediments which slow heat loss. HDR wells are expected to have a useful
life of 20 to 30 years before the outflow temperature drops about 10 degrees Celsius
and the well becomes uneconomic. If left for 50 to 300 years the temperature will
recover.
11.4.1 Technical considerations
The EGS concept is to extract heat by creating a subsurface fracture system to which
water can be added through injection wells. Creating an enhanced or engineered,
geothermal system requires improving the natural permeability of rock.
Geothermal energy consists of the thermal energy stored in the Earth’s crust. Thermal
energy in the earth is distributed between the constituent host rock and the natural
fluid that is contained in its fractures and pores at temperatures above ambient levels.
These fluids are mostly water with varying amounts of dissolved salts; typically, in
their natural in situ state, they are present as a liquid phase but sometimes may consist
of a saturated, liquid-vapor mixture or superheated steam vapor phase.
The source and transport mechanisms of geothermal heat are unique to this energy
source. Heat flows through the crust of the Earth at an average rate of 59 mW/m
2
. The
Next generation green technologies 133
intrusion of large masses of molten rock can increase this normal heat flow locally;
but for most of the continental crust, the heat flow is due to two primary processes:
(i) Upward convection and conduction of heat from the Earth’s mantle and core, and
(ii) Heat generated by the decay of radioactive elements in the crust, particularly
isotopes of uranium, thorium, and potassium.
Local and regional geologic and tectonic phenomena play a major role in determining
the location (depth and position) and quality (fluid chemistry and temperature) of a
particular resource. For example, regions of higher than normal heat flow are asso-
ciated with tectonic plate boundaries and with areas of geologically recent igneous
activity and/or volcanic events (younger than about 1 million years).
Certain conditions must be met before one has a viable geothermal resource. The first
requirement is accessibility. This is usually achieved by drilling to depths of interest,
frequently using conventional methods similar to those used to extract oil and gas from
underground reservoirs.
The second requirement is sufficient reservoir productivity. For hydrothermal sys-
tems, one normally needs to have large amounts of hot, natural fluids contained in
an aquifer with high natural rock permeability and porosity to ensure long-term pro-
duction at economically acceptable levels. When sufficient natural recharge to the
hydrothermal system does not occur, which is often the case, a reinjection scheme is
necessary to ensure production rates will be maintained.
Thermal energy is extracted from the reservoir by coupled transport processes (con-
vective heat transfer in porous and/or fractured regions of rock and conduction through
the rock itself). The heat extraction process must be designed with the constraints
imposed by prevailing in situ hydrologic, lithologic, and geologic conditions. Typically,
hot water or steam is produced and its energy is converted into electricity, process heat,
or space heat.
Rocks are permeable due to minute fractures and pore spaces between mineral grains.
Injected water is heated by contact with the rock and returns to the surface through
production wells, as in naturally occurring hydrothermal systems (Fig 4.3.4.1). The
main technological details are:
• Injection Well: A well drilled into hot basement rock that has limited permeability
and fluid content.
• Injecting Water: Water is injected at sufficient pressure to ensure fracturing, or
open existing fractures within the developing reservoir and hot basement rock.
• Hydro-fracture: Pumping of water is continued to extend fractures some dis-
tance from the injection wellbore and throughout the developing reservoir and
hot basement rock. This is a crucial step in the EGS process.
• Doublet: A second production well is drilled with the intent to intersect the stim-
ulated fracture system created in the previous step, and circulate water to extract
the heat from the previously “dry’’ rock mass.
• Multiple Wells: Additional production-injection wells are drilled to extract heat
from large volumes of rock mass to meet power generation requirements.
EGS technologies are being developed and tested in France, Australia, Japan, Germany,
the U.S. and Switzerland (Table 11.4.1). The largest EGS project in the world is a
Next generation green technologies 135
potential to increase this to over 2 000 ZJ with technology improvements — sufficient
to provide all the world’s current energy needs for several millennia.
With a modest R&D investment of $1 billion over 15 years, 100 GWe (gigawatts of
electricity) or more could be installed by 2050 in the United States. The “recoverable’’
resource (that accessible with today’s technology) is between 1.2–12.2 TW for the
conservative and moderate recovery scenarios respectively (MIT, 2006).
11.4.2 Economic considerations
EGS could be capable of producing electricity at 3.9 cents/kWh. EGS costs were found
to be sensitive to four main factors:
(i) Temperature of the resource;
(ii) Fluid flow through the system measured in liters/second;
(iii) Drilling costs; and
(iv) Power conversion efficiency.
EGS energy which is transformed into delivered energy (electricity or direct heat) – is an
extremely capital-intensive and technology-dependent industry. The capital investment
may be characterized in three distinct phases:
• Exploration and drilling of test and production wells
• Construction of power conversion facilities
• Discounted future redrilling and well stimulation.
Estimates of capital cost by the California Energy Commission (CEC, 2006), showed
that capital reimbursement and interest charges accounted for 65% of the total cost of
geothermal power. The remainder covers fuel (water), parasitic pumping loads, labor
and access charges, and variable costs.
By way of contrast, the capital costs of combined-cycle natural gas plants are esti-
mated to represent only about 22% of the levelized cost of energy produced, with fuel
accounting for up to 75% of the delivered cost of energy.
Given the high initial capital cost, most EGS facilities will deliver base-load power
to grid operations under a long-term power purchase agreement (typically greater than
10 years) in order to acquire funding for the capital investment.
There is a positive correlation between the development of new EGS fields and
continued declines in delivered costs of energy. This reflects not only the economies
from new techniques and access to higher value resources, but also the inevitable cost
of competitive power sources.
For the US it is suggested that with significant initial investment, installed capacity
of EGS could reach 100 000 MWe within 50 years, with levelized energy costs at parity
with market prices after 11 years. It is projected that the total cost, including costs for
research, development, demonstration, and deployment, required to reach this level
of EGS generation capacity ranges from approximately $600–$900 million with an
absorbed cost of $200–$350 million.
Center for Geothermal Energy Excellence at the University of Queensland, has been
awarded $18.3 million (AUS) for EGS research, a large portion of which will be used to
develop CO
2
EGS technologies. Research conducted at Los Alamos National Labora-
tories and Lawrence Berkeley National Laboratories examined the use of supercritical
136 Green Energy Technology, Economics and Policy
CO
2
, instead of water, as the geothermal working fluid with favorable results. CO
2
has numerous advantages for EGS:
• Greater power output
• Minimized parasitic losses from pumping and cooling
• Carbon sequestration
• Minimized water use
11.4.3 Further studies required
Further research is required in three areas:
• Drilling technology – both evolutionary improvements building on conventional
approaches to drilling such as more robust drill bits, innovative casing meth-
ods, better cementing techniques for high temperatures, improved sensors, and
electronics capable of operating at higher temperature in down-hole tools; and
revolutionary improvements utilizing new methods of rock penetration will
lower production costs. These improvements will enable access to deeper, hot-
ter regions in high-grade formations or to economically acceptable temperatures
in lower-grade formations.
• Power conversion technology – improving heat-transfer performance for lower-
temperature fluids, and developing plant designs for higher resource temperatures
to the supercritical water region would lead to an order of magnitude (or more)
gain in both reservoir performance and heat-to power conversion efficiency.
• Reservoir technology – increasing production flow rates by targeting specific zones
for stimulation and improving downhole lift systems for higher temperatures, and
increasing swept areas and volumes to improve heat-removal efficiencies in frac-
tured rock systems, will lead to immediate cost reductions by increasing output per
well and extending reservoir lifetimes. For the longer term, using CO
2
as a reser-
voir heat-transfer fluid for EGS could lead to improved reservoir performance as a
result of its low viscosity and high density at supercritical conditions. In addition,
using CO
2
in EGS may provide an alternative means to sequester large amounts
of carbon in stable formations.
11.4.4 Induced seismicity
Some seismicity is expected in EGS, which involves pumping fluids at pressure to
enhance or create permeability through the use of hydraulic fracturing techniques.
Depending on the rock properties, and on injection pressures and fluid volume, the
reservoir rock may respond with tensile failure, as is common in the oil and gas industry,
or with shear failure of the rock’s existing joint set, as is thought to be the main
mechanism of reservoir growth in EGS efforts.
Seismicity associated with hydraulic stimulation can be mitigated and controlled
through predictive siting and other techniques. Based on substantial evidence collected
so far, the probability of a damaging seismic event is low.
Chapter 12
Algal biofuels
Sabil Francis
University of Leipzig, Leipzig, Germany
12.1 INTRODUCTION
Algal biofuels or oilgae refer to a promising subcategory of liquid fuels produced
from algae. The algae are autotrophic simple aquatic organisms that range from small
unicellular organisms such as pond scum to complex multi-cellular ones such as kelp.
Though photosynthetic, like plants, they are considered “simple’’ because they lack
the many distinct organs found in land plants (Mousdale, 2008).
The oil productivity of microalgae surpasses that of the best oil seed producing terres-
trial plants. Though both depend on sunlight for energy, microalgae are extremely fuel
efficient when compared to land based plants. Microalgae are selected based on a num-
ber of factors, most notably high innate growth rates, favorable overall composition
(lipids, carbohydrates, and proteins), and ability to grow in specific climatic conditions.
Fuel end products, such as biodiesel, ethanol, methane, hydrogen, jet fuel, bio
crude and more via a wide range of processes can be produced using algae (Fig 12.1).
Several by-products with wide ranging applications in the pharmaceutical and chemical
industries are also created in the process of algal fuel extraction. Algal biofuels alone
can replace all fossil fuel consumption on earth.
Two kinds of algae that have the potential for biofuels are the macro algae (with
high oil content, but costly and cultivation intensive) and the micro algae (low oil yield
but easy to cultivate and cheap). Newer processes, such as cellulosic fermentation
(for deriving ethanol), gasification (for deriving biodiesel, ethanol and a wide range
of hydrocarbons), or anaerobic digestion (for methane or electricity generation), have
been developed to tap into the potential of macro algae (Table 12.1).
The major research effort in this area has been “Aquatic Species Program’’ (ASP),
which ran from 1978 to 1996 under the US National Renewable Energy Laboratory
Algal biofuels 139
Table 12.2 Flue gas composition from coal fired power plant that could be used for algae cultivation
and bio fuel generation
Component N
2
CO
2
O
2
SO
2
NOx Soot dust
Concentration 82% 12% 5.5% 400 ppm 120 ppm 50 mg/m
3
Table 12.3 Fuel yield per acre of production per year
Algae 2000 gallons
Palm 650 gallons
Sugar Cane 450 gallons
Corn 250 gallons
Soy 50 gallons
• Mass production: Quantities of algae can be grown quickly, and the process of
testing different strains of algae for their fuel-making potential can proceed more
rapidly than for other crops with longer life cycles.
• Energy efficient: Some algae can produce bio-oils through the natural process of
photosynthesis.
• Greenhouse effect: Growing algae consume carbon dioxide; this provides green-
house gas mitigation benefits. Since algae flourish in high concentrations of carbon
dioxide and nitrogen dioxide, the cultivation of algae in the vicinity of polluting
industries such as cement plants, breweries, or steel plant is an ideal way to clean
up the air, produce bio diesel, and cut down the amount of carbon dioxide in the
atmosphere. One ton algae can absorb about 1.8 tons of CO2, and so the potential
of this form of climate change control is enormous (Table 4.4.2.1) (Oilgae, 2010).
• Similarity to petroleum: Among the biofuels, bio-oil produced by photosynthetic
algae have molecular structures that are the most similar to petroleum and refined
products such as jet fuel. This would mean less transformative technology in the
automotive and other industries.
12.3 PROBLEMS WITH ALGAL BIOFUELS
The extant problems with algal biofuels can be summarized as follows (Biopact, 2007):
• Lack of a constant and high lipid content that is key to the creation of biofuels;
• Lack of stability of algae cultures that leads to intermittent cultivation;
• Varying degrees of photosynthetic efficiency that does not result in high and
constant biomass productivity;
• Inability to withstand seasonal climate changes, and fluctuating temperatures; and
• The physical nature of algae – the membranes have to be easily harvestable, and
must be ideally done without too much loss and without the need for costly
flocculants.
Biotechnology might offer a solution to these problems through genetic engineering of
species. Because of its enormous potential, in comparison with other bio fuel sources,
algae seem to be the best alternative (Table 12.3).
140 Green Energy Technology, Economics and Policy
Water
Algae
Algae
slurry
Algae
oil
Separator
Recovered
water
Biomass
Press
Centrifuge
Nutrients
Feeding
vessel
Photo bioreactor
CO
2
Figure 12.2 Working of a photo-bioreactor
12.4 TECHNOLOGIES
There are three stages in the creation of algal biofuels (a) the cultivation of algae (b) the
harvesting of algae (c) the extraction of the oil.
12.4.1 Cultivation of algae
Open and closed methods of cultivation: One of the key advantages of algae is that
it can be cultivated virtually anywhere. All that is needed is light, carbon dioxide
and water. There are two types of algal cultivation. The first one is “open’’ culti-
vation, which has been the norm in the United States and in the NREL project. In
this method, “raceway’’ ponds, which contain native strains of algae are stirred using
a paddle wheel, while carbon dioxide is introduced. The water can be wastewater
(treated sewerage) freshwater, brackish water, or salt water, depending on the strain of
algae grown.
The Japanese prefer a “closed’’ system. One example of this is a photo-bioreactor
(PBR) a closed translucent container. Depending on whether the heat – in the form of
natural light or artificial light or both – is constant on intermittent, cultivation can be
all the year around. Because PBR systems are closed, all essential nutrients must be
introduced into the system (Fig 12.2).
A PBR can be operated in “batch mode’’, but it is also possible to introduce a
continuous stream of sterilized water containing nutrients, air, and carbon dioxide
and have continuous cultivation. There are two types of illumination that are used in
PBRs—natural and artificial. Naturally illuminated Algal Culture systems with large
illumination surface areas include flat-plate, horizontal/serpentine tubular airlift, and
inclined tubular photo-bioreactors. Generally, laboratory-scale photo-bioreactors are
artificially illuminated (either internally or externally) using fluorescent lamps or other
light distributors.
Table 12.4 shows the comparative advantages and disadvantages of a PBR.
Algal biofuels 141
Table 12.4 Comparative advantages and disadvantages of photo-bioreactor cultivation
Advantages Disadvantages
High Biomass Productivity and cell density High capital cost associated with construction costs,
circulation pumps, and nutrient-loading systems
Less contamination, water use, & CO
2
losses Absence of evaporative cooling, which can lead to
very high temperatures
Better light utilization & mixing Accumulation of high concentration of
photosynthetically generated O
2
leading to
photo-oxidative damage
Controlled culture conditions Absence of evaporative cooling, which can lead to
very high temperatures
12.4.2 Harvesting of algae
The separation of algae from the growth medium, whether closed or open, can be
defined as the harvesting of algae. One of the key aims in this step is the removal of the
high water content, through technical processes such as flocculation, micro-screening
and centrifugation. Again, the harvesting depends on the type of algae (Sheehan et al,
1998).
Harvesting of macro algae depends on the mode of cultivation. While macro algae
that grows on a solid substrate has to be cut, free floating algae can be harvested
merely by the raising of a net that has been installed in a pond, giving it a major cost
advantage over micro-algae that has to be filtered and screened, for separation. While
human harvesting was the norm earlier, currently petrol driven rotary cutters can be
used to gather macro algae efficiently. The harvesting can be done 3 to 4 times, but
the crop declines in yield.
Micro algae is usually cultivated in a thick algae paste, and the key step is the
concentration of the algae so that its harvesting is viable—this can mean a one or two
step process. This will depend on the strain of algae that is cultivated, especially its size
and the particular properties of the strain. There are four ways in which microalgae
can be harvested—floatation, centrifugation, filtration, and culture auto flocculation,
which leads to a clustering of the microalgae. Fast growing algae are usually motile
uni-cells, and therefore the hardest to harvest.
12.4.3 Extraction of various energy products from algae
Extraction can be broadly categorized into two methods: energy intensive mechanical
methods that can be subdivided into (a) expression/expeller press (b) ultrasonic-assisted
extraction. The second option is the use of environmentally hazardous chemical meth-
ods that can be further classified into (a) hexane solvent method (b) soxhlet extraction
and (c) super critical fluid extraction that uses high pressure equipment that is expen-
sive and energy intensive. Many manufacturers of algae oil use a combination of
mechanical pressing and chemical solvents in extracting oil.
Rarer methods include enzymatic extraction that uses enzymes to degrade the cell
walls with water acting as the solvent that makes fractionation of the oil much easier.
142 Green Energy Technology, Economics and Policy
Selection
of micro
algae
species
Growth
of micro
algae
Harvesting
of micro
algae
Further treatment to
recover other valuable
material
Waste liquor
Residual micro
algae
De watering
and extrusion
Extraction of
protein
Incorporated
into human
food
Aqua
feed
animal
feed
petfeed
Extraction
of oil from
micro
algae
Oil for
processing
into
biofuel
Biodiesel
Figure 12.3 Detailed process of biodiesel from algae
The costs of this extraction process are estimated to be much greater than hexane
extraction. While this method may become feasible in the future, but with the relatively
long time enzymatic digestion requires and the developing of alternate methods, it does
not hold much promise for the present (Whitcre et al, 2007).
The third method that can be used is that of osmotic shock which depends on a
sudden reduction in osmotic pressure. An algae farm is designed to produce a number
of products including algal oil, delipidated algal meal (DAM) and dried whole algae
(DWA). The algal oil is suitable for conversion to biodiesel and can be substituted for
any other vegetable oil (Soy, palm, Jatropha) in a commercial biodiesel production
plant. The DAM and DWA are suitable for a wide variety of animal feed applications.
Biodiesel from algae: Bio diesel has been defined as any diesel-equivalent biofuel
made from renewable biological materials such as vegetable oils or animal fats con-
sisting of long-chain saturated hydrocarbons (Fig 12.2). It can be used in pure form
(B100) or may be blended with petrodiesel at any concentration. Traditional sources
such as bio diesels created from corn or soya take away from the food chain leading
to higher food prices, and are extraction inefficient.
In the extraction process the first product is “green crude’’ which is similar to crude
oil. It must be then refined, by mixing it with a catalyst, such as sodium hydroxide and
an alcohol, such as methanol, resulting in biodiesel mixed with glycerol. The mixture
is cleaned to remove the glycerol, a valuable by-product, leaving pure algal biodiesel
fuel, which is similar to petrodiesel fuel.
Although algal biodiesel and petro diesel are similar, there are a few significant
differences between their properties. However, low yields from naturally grown algae,
the selection of high-oil content strains, devising cost effective methods of harvesting,
oil extraction and conversion of oil to biodiesel options are some of the problems that
remain to be overcome.
Ethanol from algae: Processes for the production of ethanol use food crops such as
corn and sugar cane leading to a food crisis. One potential way to produce ethanol
from algae is by converting starch (lipids) in algae into biodiesel and cellulose from the
cell walls of algae (carbohydrate) into ethanol (Fig 12.4).
144 Green Energy Technology, Economics and Policy
Sun
Gas
collection
Circulating
pumps
Transparent tubes
filled with hydrogen
releasing algae and
nutrient medium
Figure 12.5 Hydrogen from algae
REFERENCES
Armstead, H. C. H. and Tester, J. W. (1987) Heat Mining. London: E and F. N. Spon.
Atzeni, S. and Meyer-ter-Vehn, J. (2004) Nuclear Fusion Reactions, The Physics of Internal
Fusion. Oxford: University of Oxford Press.
Avery, W. H., Wu, C. (1994) Renewable Energy From The Ocean – A Guide To OTEC. New
York: Oxford University Press.
Baker, A. C. (1991) Tidal power. London: Peter Peregrinus Ltd.
Beychok, M.R., (1974) Coal gasification and the Phenosolvan process, Proc. American Chemical
Society 168th National Meeting, Atlantic City.
Biopact (2007) An In-depth look at bio fuels from algae. />2007/01/in-depth-look-at-biofuels-from-algae.html.
Bodansky, D. (2003) Nuclear Energy: Principles, practices, and prospects. Berlin: Springer.
BP (2009) BP Statistical Review of World Energy June 2009 ( />statisticalreview)
Bradshaw, J. and T. Dance (2004) Mapping geological storage prospectivity of CO
2
for the
world’s sedimentary basins and regional source to sink matching. Prodeedings of the 7th
International Conference on Greenhouse Gas Technologies, Vol. I; peer reviewed Papers and
Plenary Presentations, pp 583–592. Eds. E.S. Rubins, D.W. Keith and C.F. Gilboy, Pergamon,
2005.
Brauns, E. (2008) Toward a worldwide sustainable and simultaneous large-scale produc-
tion of renewable energy and potable water through salinity gradient power by combining
reversed electrodialysis and solar power, Environmental Process and Technology, vol. 219,
pp. 312–323.
Brogioli, D. (2009) Extracting renewable energy from a salinity difference using a capacitor,
Phys. Rev. Lett., Vol 103, pp 058501.1–058501.4.
CEC (2006) California Energy Commission. />Charlier, R.H. and Justus, J.R. (1993) Ocean Energies: Environmental, Economic and
Technological Aspects of Alternative Power Sources. Amsterdam: Elsevier Science Publishers.
Cohen, B.L. (1990) The Nuclear Energy Option. New York: Plenum Press
Cruz, J. (2008) Ocean Wave Energy – Current Status and Future Prospects. Berlin: Springer.
Curtis, D and Langley, B. (2004) Going With the Flow: Small Scale Water Power. Powys: Centre
for Alternative Technology Publications.
Algal biofuels 145
DOE (1993) Nuclear Physics and Reactor Theory DOE Fundamentals Handbook Volume 1
and 2. Washington, D.C.: Department of Energy
DOE (2002) A Technology Roadmap for Generation IV Nuclear Energy Systems. Washington,
D.C.: DOE Nuclear Energy Research Advisory Committee.
DOI (2006) Technology White Paper on Ocean Current Energy Potential on the U.S. Outer
Continental Shelf. Washington D.C.:US Department of Interior.
Exxon Mobil (2010) Algal biofuels. />con_vehicle_algae.aspx.
Falnes, J. (2002) Ocean Waves and Oscillating Systems. Cambridge: Cambridge University
Press.
Hammons, T. J. (1993) Tidal power, Proceedings of the IEEE, 81(3).
Harvey, A. and Brown, A. (1992) Micro-Hydro Design Manual. Stockholm: ITDG Publishing.
IAEA (1992) INSAG-7, The Chernobyl Accident: Updating of INSAG-1. Vienna: International
Atomic Energy Agency.
IAEA (2003) Review of National Accelerator Driven System Programmes for Partitioning and
Transmutation. Vienna: International Atomic Energy Agency.
IAEA (2005a) Country Nuclear Fuel Cycle Profiles – Second Edition. Vienna: International
Atomic Energy Agency.
IAEA (2005b) Thorium Fuel Cycle – Potential Benefits and Challenges. Vienna: International
Atomic Energy Agency.
IAEA (2006) Nuclear Technology Review 2006. Vienna: International Atomic Energy Agency.
IAEA (2008a) Advanced Applications of Water Cooled Nuclear Power Plants. Vienna:
International Atomic Energy Agency.
IAEA (2008b) Spent Fuel Reprocessing Options. Vienna: International Atomic Energy Agency.
IAEA (2008c) Nuclear Safety Review for the year 2008. Vienna: International Atomic Energy
Agency.
IAEA (2008d) Improving the International System for Operating Experience Feedback INSAG-
23. Vienna: International Atomic Energy Agency.
IAEA (2009a) Nuclear Technology Review 2009. Vienna: International Atomic Energy Agency.
IAEA (2009b) Nuclear Fuel Cycle Information System: A Directory of Nuclear Fuel Cycle
Facilities. Vienna: International Atomic Energy Agency.
IAEA (2009c) Design Features to Achieve Defence in Depth in Small and Medium Sized Reactors.
Vienna: International Atomic Energy Agency.
IAEA (2010) Power Reactor Information System Vienna:
International Atomic Energy Agency.
IEA (2007) Renewables in Global Energy Supply, An IEA Fact Sheet. Paris: International Energy
Agency.
Inderwildi, O.R., Jenkins, S.J. and King, D.A. (2008) Mechanistic Studies of Hydrocarbon
Combustion and Synthesis on Noble Metals, Angewandte Chemie International Edition,47
(5253).
IPCC (2005) IPCC Special Report on Carbon Dioxide Capture and Storage Prepared by Work-
ing Group III of the Intergovernmental Panel on Climate Change [Metz, B., O. Davidson,
H.C. de Coninck, M. Loos and L. A. Meyer (eds.)]. Cambridge: Cambridge University
Press.
Jones, A.T. and Rowley, W. (2003) Global Perspective: Economic Forecast for Renewable Ocean
Energy Technology, Marine Technology Society Journal, 36.
Larson, E.D., Williams, R.H., Regis, M. and Leal, L.V. (2001) ?A review of biomass
integrated-gasifier/gas turbine combined cycle technology and its analysis for Cuba, Energy
for Sustainable Development 5 (1).
Lecomber, R. (1979) The evaluation of tidal power projects, Tidal Power and Estuary
Management. Dorchester: Henry Ling Ltd.
146 Green Energy Technology, Economics and Policy
Lindeberg, E., J F Vuillaume and A. Ghaderi (2009) Determination of the CO
2
storage capacity
of the Utsira formation, Energy Procedia, 1, pp 2777–2784.
Marchetti, C. (1977) On Geoengineering and the CO
2
Problem, Climatic Change, 1, 59–68.
McCormick, M. (2007) Ocean Wave Energy Conversion. New York: Dover Publications.
Meshik, A. (2005) The working of an Ancient Nuclear Reactor Scientific American, vol. 293,
pp. 82–91.
Michal, R. (2001) Fifty years ago in December: Atomic reactor EBR-I produced first electricity
Nuclear News pp 28–29
MIT (2006) The future of geothermal energy. Cambridge, MA: Massachusetts Institute of
Technology.
Moritsuka, H., M. Ashizawa and K. Ichikawa (2009) Electric power stable supply toward
2050 – Substitution fossile fuels for biomass fuel by co-firing. Proceedings of the International
Conference on Power Engineering-09 (ICOPE-09) November 16–20, 2009, Kobe, Japan.
Mousdale, D. M. (2008) Biofuels: Biotechnology, Chemistry, and Sustainable Development.
Boca Raton: Taylor & Francis.
Nakashiki, N., T. Ohsumi and K. Shitashima (1991) Sequestering of CO
2
in a deep-ocean – Fall
velocity and dissolution rate of solid CO
2
in the Ocean, CRIEPI Report EU91003.
NEI (2007) Power Market Development: How much? Kent: Nuclear Engineering International.
Nuttall, W.J. (2008) Fusion as an Energy Source: Challenges and Opportunities. Bristol: Institute
of Physics.
OECD/NEA (2009) Nuclear energy and addressing climate change, Nuclear Energy in
Perspective. Paris: OECD/Nuclear Energy Agency.
OECD/NEA-IAEA (2008) Uranium 2007: Resources, Production and Demand? (Red Book).
Paris: OECD Publishing.
Oilgae (2010) Flue gas and its part in global warming. />flu/flu.html.
Olsson, M., Wick, G. L. and Isaacs, J. D. (1979) Salinity Gradient Power: utilizing vapour
pressure differences, Science 206.
Saling, J.H and Fentiman, A.W. (2002) Radioactive Waste Management. New York: Taylor &
Francis.
Sheehan, J., Dunahay, T., Benemann, J. and Roessler, P. (1998) A Look Back at the U.S. Depart-
ment of Energy’s Aquatic Species Program: Biodiesel from Algae. Colorado: U.S. Department
of Energy’s Office of Fuels Development.
Takahashi, T., T. Ohsumi, K. Nakayama, K. Koide and H. Miida (2009) Estimation of CO
2
Aquifer Storage Potential in Japan, Energy Procedia 1, 2631–2638.
Thorpe, T. W. (1999) An Overview of Wave Energy Technologies: Status, Performance and
Costs, Proc Wave Power: Moving towards Commercial Viability, IMECHE Seminar, London,
pp 1–16.
Trimble, L.C. and Owens, W.L. (1980) Review of mini-OTEC performance, Energy to the 21st
century, Proceedings of the Fifteenth Intersociety Energy Conversion Engineering Conference,
New York.
Twidell, J., Weir, A. D. and Weir, T. (2006) Renewable Energy Resources. New York: Taylor &
Francis.
Volk, T.A., Abrahamson, L.P., White, E.H., Neuhauser, E., Gray, E., Demeter, C., Lindsey, C.,
Jarnefeld, J., Aneshansley, D.J., Pellerin, R. and Edick, S. (2000) Developing a Willow Biomass
Crop Enterprise for Bioenergy and Bioproducts in the United States, Proceedings of Bioenergy
2000, New York: North East Regional Biomass Program.
Walker, S.J. (2004) Three Mile Island: A Nuclear Crisis in Historical Perspective. Berkely:
University of California Press.
WEC (1993) Renewable Energy Resources: Opportunities and Constraints 1990–2020.
London: World Energy Council.