- Trang chủ >>
- Khoa Học Tự Nhiên >>
- Vật lý
Green Energy Technology, Economics and Policy Part 6 potx
Bạn đang xem bản rút gọn của tài liệu. Xem và tải ngay bản đầy đủ của tài liệu tại đây (219.34 KB, 34 trang )
156 Green Energy Technology, Economics and Policy
Efficiency in steel making can be improved by reducing the number of steps involved
and the amount of materials processed in any step, in the following ways: (i) Injecting
pulverized coal in place of coke in the blast furnace. Before coking, ROM coal is
invariably washed in order to reduce the ash content. Direct injection of pulverized
coal avoids the need for coal washing as well as burning coal in coke ovens to convert
it into coke, (ii) New technologies such as COREX can use coal instead of coke, and
(iii) New reactor designs (FINEX and cyclone converter furnaces) can use coal and ore
fines. Coal injection has the potential to save up to half of the coke presently used,
thus saving the energy needed in coke production (2–4 GJ/t). The potential for coal
savings globally would be 12 Mtoe per year, equivalent to 50 Mt of CO
2
/yr.
Improvement in energy efficiency and reduction in CO
2
emissions can be achieved
through process streamlining.
Smelt reduction and efficient blast furnaces: Smelt reduction involves the develop-
ment of a single process in the place of ore preparation, coke making and conversion to
iron in the blast furnace. Small and medium-scale steel plants stand to benefit from this
approach. In the COREX plant design, coal fines, iron ore fines and limestone fines
are palletized into self-fluxing sinter. Such plants are in use in South Africa, Korea and
India. The new kinds of smelt-reduction plants generate about 9 GJ/t of surplus off-
gas, whose reuse could bring about significant additional CO
2
reductions. By blowing
oxygen, instead of air, into blast furnaces, and by recycling top gases, it is possible to
achieve a 20–25% reduction of CO
2
. Japan and the European Union are developing
the ULCOS (Ultra Low CO
2
Steel-making) process. The combination of smelt reduc-
tion and nitrogen-free blast furnaces may bring about 200 to 500 Mt of CO
2
by
2050.
Direct casting: Customarily, steel is continuously cast into slabs, billets and blooms.
They are later reheated and rolled into desired shapes. Near-net casting and thin-
strip casting integrates the casting and hot rolling processes into one step, and saves
considerable energy (typically, 1–3 GJ/t of steel). Material losses are also reduced.
(Table 13.5).
Fuel and feedstock substitution: Iron ore is reduced to iron through the use of coal
and coke. Where available, natural gas is used for the production of DRI. In South
America, particularly Brazil, wood is used, in small-scale plants. In south India, Mysore
Iron and Steel works at Bhadravati used wood for many years. Japan has been using
0.5 Mt (20 PJ) of plastic waste as a coal substitute in the blast furnaces. Hydrogen and
electricity could also be used in steel making, but as the CO
2
reduction benefits cost
more than USD 50/t CO
2
, they are not much favoured.
Table 13.5 Global technology prospects for direct casting
Direct casting 2008–2015 2015–2030 2030–2050
Technology stage R&D, Demonstration Commercial Commercial
Investment costs (USD/t) 200 150–200 150–200
Energy reduction (%) 80% 90% 90%
CO
2
reduction (Gt/yr) 0–0.01 0–0.03 0–0.1
(Source: ETP 2008, p. 488)
Industry 157
CCS for the current blast furnaces would cost USD 40–50/t CO
2
, excluding the
expenses in the furnace redesign. DRI production would allow CCS at a much lower
cost of USD 25/t CO
2
(Borlée, 2007) When the DRI production picks up in the Middle
East, this would contribute significantly to the reduction of CO
2
emissions.
CCS in iron and steel production could save around 0.5–1.5 Gt of CO
2
per year.
13.3 NON-METALLIC MINERALS
Non-metallic minerals are used for the production of cement, bricks, glass, ceramics
and other building materials. This sector is the third largest consumer of energy (10%
of the global energy use), and second largest emitter of CO
2
(27% of the global energy
and process CO
2
emissions). China, India, the European Union and USA account for
75% of the CO
2
emissions. Out of the global cement production of 2310 Mt in 2005,
the developed countries accounted for 563 Mt (24% of the world output), transition
economies 98 Mt (4% of the world output) and the developing countries 1649 Mt
(72% of the world output).
Yates et al (2004) described ways and means of reducing the emission of greenhouse
gases in the cement industry.
China is the world’s largest producer of cement.
Cement industry accounts for 83% of the total energy use and 94% of the total CO
2
emissions pertaining to the non-metallic minerals sector.
Limestone is the principal raw material for making cement. Clinker is produced
by heating limestone and chalk to temperatures above 950
◦
C. Clinker production
accounts for most of the energy consumed in making cement. Large amounts of elec-
tricity are also used in grinding of the raw materials, and in the production of finished
cement. The calcination of limestone leads to the emission of CO
2
, and these emis-
sions are unrelated to energy use. CO
2
emissions in the course of calcination cannot
be reduced through energy efficiency measures – they can only be reduced through
appropriate raw material selection.
Improvements in cement-making have the potential to reduce CO
2
emissions by
290 Mt. If clinker substitutes are included, the potential saving could rise to 450 Mt
of CO
2
. The world average potential is 0.18 t CO
2
/t of cement.
The following Best Available Technologies (BAT) has the potential to reduce the
CO
2
emissions: BF slag clinker substitutes, other clinker substitutes, alternative fuel,
electricity savings and fossil fuel savings.
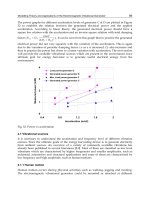
Heat efficiency and management: Large-scale rotary kilns, which are used in the
industrialized countries, are more efficient than small-scale vertical shaft kilns that
are used in developing countries, such as China and India, but these countries are
also switching to rotary kilns. All over the world, the wet process of making Portland
cement is being replaced by dry process, because of two benefits: saving of water to
make the slurry, and saving of energy as drying will not be needed. Dry-process kilns
use about half of the energy as wet-process kilns. The most efficient arrangement is
the dry kiln, with six-stage preheating and pre-calcining.
Grinding is necessary to produce cements. Cements with high fly ash content reduce
energy use and CO
2
emissions. The energy efficiency of grinding is low, typically
5–10%, as the remainder is converted to heat. Grinding is done more efficiently by
158 Green Energy Technology, Economics and Policy
Vertical shaft
kilns
7
6
5
4
3
2
Energy intensity of clinker (GJ/t)
1
0
Wet
kilns
Long dry
process
Dry kiln
(four stage
pre-heater)
Dry kiln
(six stage
pre-heater
and pre-calciner)
Figure 13.2 Energy efficiency of various cement clinker production technologies
(Source: ETP, 2008, p. 492, © IEA-OECD)
using roller presses and high-efficiency classifiers. High-strength cements used in build-
ing skyscrapers involve superior grinding technologies and the use of additives. Such
cements are expensive, and require sophisticated knowledge for using them.
Fuel and feedstock substitution: The use of wastes and biomass (including tyres,
wood, plastics, etc.) in the place of fossil fuels in the cement industry not only brings
about saving in fuels but also reduction in CO
2
emissions. A number of cement plants
in Europe, wastes are co-combusted in the cement kilns to the extent of 35% to more
than 70%. Some individual plants have achieved even 100% substitution. The cement
industry in USA burns 53 million used tyres per year. Another potential source of energy
in USA is carpets. Instead of dumping them in the landfill, as is the usual practice, they
can be burned in the cement kilns. Their fuel value is estimated at 100 PJ.
There is potential for alternative fuels to be raised from 24 Mtoe to 48 Mtoe. When
that happens, there would be CO
2
reductions of the order of 100–200 Mt per year.
Clinker substitutes and blended cements: Increasing the proportion of non-clinker
feedstocks, such as volcanic ash, granulated blast furnace slag , and fly-ash from coal-
fired power generation, is an effective way to reduce energy and process emissions.
The CO
2
savings from blended cements could be 300–500 Mt by 2050.
Blast furnace slag which has been cooled with water is more suitable than the slag
cooled with air. If all the water-cooled blast furnace slag is used, there will be CO
2
reduction of approximately 100 Mt . The setting time of cement is a critically important
consideration in cement use. When fly ash from the coal-fired power plants is used as
a non-clinker feedstock, its carbon content may adversely affect the setting time of
cement. The pre-treatment of fly ash will allow it to be substituted to the extent of
70%. If half of the fly ash is used in the cement industry, instead of dumping it in the
landfill, there will be saving of 75 Mt of CO
2
. If the EAF and BOF steel slag resource
of 100–200 Mt per year, were used in the cement manufacture, there would be CO
2
savings of 50 to 100 Mt per year.
Other feedstocks possible are volcanic ash, ground limestone and broken glass. They
can bring about reduction in the use of energy and CO
2
emissions. When limestone
Industry 159
Table 13.6 Global technology prospects for CCS for cement kilns
CCS 2008–2015 2015–2030 2030–2050
Technology stage R&D R&D Demonstration,
Demonstration Commercialization
Costs (USD/t CO
2
) 150 100 75
Emission reduction (%) 95 95 95
CO
2
reduction 0 0–0.25 0.4–1.4
(Gt CO
2
/yr)
(Source: ETP 2008, p. 495)
is calcined in the cement kilns, the off gas will have a high content of CO2. If oxygen
instead of air were used in the cement kilns, the off gas would be pure CO2. The use
of CCS in the cement kilns will raise the production cost by 40 to 90% (Table 13.6).
13.4 CHEMICALS AND PETROCHEMICALS
The chemicals and petrochemicals industry is the largest consumer of energy (28% of
the world’s industrial energy) and the third largest emitter of energy and process CO
2
emissions (16% of the world’s emissions). The industry is highly complex, both in
terms of processes (distillation, evaporation, direct heating, refrigeration, electrolytic
and biochemical), the number of final products, and size (ranging from a few kgs. to
thousands of tonnes). However, three processes account for 537 Mtoe of energy use
(which is 70% of the energy use in the sector):
High-value chemicals (HVC), such as, olefins (ethylene and propylene) and aromat-
ics (benzene, toluene, and xylene) are produced by the steam-cracking of naphtha,
ethane and other feedstocks. This process accounts for more than 39% of the final
energy use in the chemicals and petrochemicals industry. Out of the total of 318 Mtoe,
about 50 Mtoe is used for energy purposes, and 268 Mtoe is locked up in the cracking
products. The energy used in steam cracking is determined principally by the nature
of the feedstock, and secondarily by the furnace design and process technology. For
instance, 1.25 tonnes of ethane, 2.2 t of propane or 3.2 t of naphtha are needed to
produce 1 t of ethylene. Naphtha cracking is more in use in Asia-Pacific, and Western
Europe, whereas ethane cracking is more prevalent in North America, Middle East and
Africa. This difference is evidently attributable to feedstock availability. Improvements
in steam cracking design have led to 50% reduction in the energy consumption since
1970s.
Methanol: Methanol is used as anti-freeze, solvent and fuel. About 80% of ethanol
production is natural gas-based, and so there is spurt in methanol production in Mid-
dle East and Russia. About 30 GJ of natural gas is needed to produce one tonne of
methanol. China uses coal for methanol production. In 2006, the global production
of methanol was 36 Mt, of which 40 % was used for the production of formalde-
hyde, 19% was used to make methyl tertiary butyl ether (MBTE), which is a gasoline
additive, and 10% for the production of acetic acid.
Ammonia: Almost all the synthetic nitrogen fertilizers are based on anhydrous
ammonia. Ammonia is made by combining nitrogen from air with hydrogen from
160 Green Energy Technology, Economics and Policy
natural gas or naphtha, coke-oven gas, refinery gases and heavy oil. Global ammo-
nia production was 145.4 Mt in 2005. East and West Asia account for 40% of the
global production. About 77% of world ammonia production is based on natural gas-
steam reforming, 14% on coal gasification (mostly in China), and 9% on the oxidation
of heavy hydrocarbon fractions (mostly in India). Coal-based process uses 1.7 times
more energy, and heavy oil-based process uses 1.3 times more energy than the gas-
based process. The cost of natural gas accounts for 70–90% of the cost of ammonia
production.
USA, European Union, Japan and China are the largest producers of HVCs, and
account for 62% of the CO
2
emissions. China, the European Union, India and Russia
are the largest producers of ammonia, and account for 72% of the energy use in the
production of this chemical.
Oil, natural gas and coal feedstock provide more than half of the energy (469
Mtoe/yr) consumed in the sector. Products, such as plastics, solvents and methanol
hold most of the carbon input of the feedstock, but some of the carbon gets released
at a later stage, say, for instance when the product is incinerated. During the com-
plete life cycle, chemicals and petrochemicals emit far more CO
2
than indicated by the
industrial CO
2
emissions.
Energy and Materials efficiency: New Process technologies
Steam cracking per tonne of ethylene cracked needs 18–25 GJ of energy. Energy effi-
ciency of steam cracking is being improved through the use of higher temperature
(>1100
◦
C) furnaces, gas – turbine integration (by which process heat is provided
to the cracking furnace), advanced distillation columns and combined refrigeration
plants. These improvements could result in the savings of 3 GJ per tonne of ethylene.
The adoption of BAT would lead to an energy saving of 24 Mtoe.
Bowen (2006) gave an account of the development trends in ethylene cracking.
The amount of energy used for producing ammonia ranges from 28 GJ to 53 GJ/t,
averaging 36.9 GJ/t. High-capacity, modern plants are about 10% more energy effi-
cient than smaller and older plants. CO
2
emissions range from 1.5 to 3.1Mt , with an
average of 2.1 Mt, per one Mt of ammonia produced. Two-thirds of CO
2
is process
related, and one-third is from fuel combustion. If all the production of ammonia is
based on the natural gas feedstock, it has the energy saving potential of 48 Mtoe, which
represents reduction in CO
2
emissions of 75 Mt. If CO
2
is separated from hydrogen
using high-efficiency solvents, there would be two benefits: there would be an energy
saving of 1.4GJ/t of ammonia produced, and the CO
2
separated could be used for the
production of urea fertilizer for which there is good demand.
Biomass feedstock: There will be considerable saving of energy when the biomass
feedstock is substituted in place of petroleum feedstock. ETP, 2008, p.500, lists four
principal ways of producing polymers and organic chemicals from biomass:
• Direct use of several naturally occurring polymers after subjecting them to thermal
treatment, chemical derivatisation or blending.
• Thermochemical conversions, such as Fischer-Tropsch process of converting coal
to oil, and methanol-to-olefins (MTO) via pyrolysis or gasification. There is
tremendous potential for using low-cost coal and stranded gas feedstocks for MTO
Industry 161
Table 13.7 Global technology prospects for biomass feedstocks and biopolymers
2008–2015 2015–2030 2030–2050
Technology stage R&D R&D Demonstration,
Demonstration Commercialization
Investment costs (USD/t) 5 000–15 000 2 000–10 000 1 000–5 000
Life-cycle CO
2
reductions 50% 70% 80%
CO
2
reduction (Gt/yr) 0–0.05 0.05–0.1 0.1–0.3
(Source: ETP 2008, p. 501)
process. Since the Second World War, South Africa which is deficient in oil, has
been using coal to produce oil by Fischer-Tropsch process.
• “Green’’ biotechnology whereby genetically-modified potatoes or miscanthus are
used to produce biopolymers. Sapphire Energy, San Diego, California, uses single-
cell algae to produce an organic mix which is chemically identical to low-sulphur,
sweet crude (vide image on the cover). The Company plans to produce one million
gallons (3.8 Million litres) of biodiesel and jet fuel by 2011.
• “White’’ biotechnology which makes use of fermentation processes and enzymatic
conversions to produce some specialty and fine chemicals.
Bio-ethylene can be used to produce polyethylene and a wide range of chemical deriva-
tives. The production of biobased chemicals involve not only saving of energy but also
reduction in greenhouse gases. For instance, there would be energy saving of as much
as 60% through the substitution of cellulosic fibre in place of synthetic fibre.
The production of ethylene from bio-ethanol leads to a saving of energy and reduc-
tion in the emission of greenhouse gases by about one-third, relative to petrochemical
ethylene. If advanced fermentation and separation technologies are used, the saving
can be as high as 50%. The large amount of biomass waste produced after the produc-
tion of bio-ethanol from sugarcane, can be used to generate electricity, thereby saving
fossil fuels.
Carbon credits and higher oil prices will make biomass feedstocks competitive.
Though theoretically, whatever is producible from petroleum can be produced
from bio-based feedstocks, the market penetration of bio-based products would
depend upon the relative prices, technological developments, government support and
synergies with biofuel production (Table 13.7).
Plastic waste recycling and energy recovery
Only 20 to 30% of the plastic waste can be mechanically recycled, and the rest
can be used for energy recovery. Considering that the energy recovery per tonne of
plastic waste is 30 to 40 GJ/t, the primary energy saving potential is in the range of
48–96 Mtoe/yr. The quantity of plastic waste produced worldwide is about 100 Mt.
Out of this, only 10 Mt is recycled. About 30 Mt is incinerated. Energy recovery
from the plastics is estimated at 17.9 Mtoe which is3%oftheenergy used in its
production.
162 Green Energy Technology, Economics and Policy
Table 13.8 Global technology prospects for membranes
Membranes 2003–2015 2015–2030 2030–2050
Technology stage R&D, Demonstration, Commercial
Demonstration Commercial
Internal rate of return 8% 10% 15%
Energy savings (%) 15% 17% 20%
CO
2
reductions (Gt/yr) 0–0.03 0.1 0.2
(Source: ETP 2008, p. 502)
Membranes:
Separation technologies involve processes such as distillation, fractionation and extrac-
tion. Their primacy in the chemical industry could be judged from the fact that they
account for 40% of the energy used and 50% of the operating costs of the chemical
industry. Customized membranes are being increasingly used to replace the energy-
intensive separation processes not only in chemical industry but also in food processing,
water purification, paper, petroleum refining, etc. industries. The market penetration
of membranes is impeded because of the higher costs of the membranes and their
susceptibility to fouling . Global technology prospects for membranes are given in
Table 13.8.
Innovations in process technology and equipment in the petrochemical sector have
the potential to increase the energy efficiency in the petrochemical sector by 5% in
the next 10–20 years, and by 20% in the next 30–40 years. The main barrier is the
large-scale demonstration.
13.5 PULP AND PAPER
The pulp and paper industry accounts for 6% of the world’s industrial use and 3%
of the energy and process CO
2
emissions. About 80% of the paper in the world is
produced in European Union, USA, China and Japan. The paper and pulp industry
generates about 50% of the energy needs from its own biomass residues. This explains
the lower intensity of CO
2
emissions of the industry. Greater efficiencies are still pos-
sible through the use of lesser amounts of bioenergy resources which can replace fossil
fuels. Berntsson et al (2007) gave a vision of future possibilities of biorefining. Hector
and Berntsson (2007) described the ways and means of reducing greenhouse gases in
pulp and paper mills.
As the pulp and paper industry uses large quantities of steam, Combined Heat and
Power (CHP) is an attractive technology for the pulp and paper industry. Chemical
pulp mills produce large quantities of black liquor, which is used to produce electricity
through the boiler system. But the efficiency of this process is low. Higher efficiencies
are achievable by the gasification of the black liquor (syngas), and using the gas to
produce electricity through the operation of gas turbines. The total cost of the gasifier-
gas turbine system is 60 to 90% higher than the standard boiler system. USA, Sweden
Industry 163
Table 13.9 Global technology prospects for black liquor gasification
Black liquor gasification 2003–2015 2015–2030 2030–2050
Technology stage R&D, Demonstration, Commercial
Demonstration Commercial
Investment costs (USD/t) 300–400 300–350 300
Energy reduction (%) 10–15% 10–20% 15–23%
CO
2
reduction (Gt/yr) 0–0.01 0.01–0.03 0.1–0.2
(Source: ETP 2008, p. 507)
and Finland are collaborating in this effort with the goal of producing electricity at US
cents 4/kWh.
A highly attractive proposition is to use the black liquid gasifiers to produce dimethyl
ether (DME) which can serve as a substitute for diesel fuel.
Carbon dioxide is produced when black liquor is combusted for energy and produc-
tion of chemicals. The total black liquor production worldwide is 73 Mtoe, which has
a CCS potential of 300 Mt of CO
2
per year.
Black liquor production is expected to grow to 79 Mtoe by 2025. This could yield
an additional 8Mtoe of electricity per year. The consequent savings of primary energy
is estimated to be 12 to 19 Mtoe, and the CO
2
savings potential may be 30 to
75 Mt per year. Global technology prospects for black liquor gasification are given in
Table 13.9.
Best Available Technologies (BAT)
If all waste paper is used for energy recovery, it is theoretically possible to have paper
and pulp industry without CO
2
emissions. This is not, however, the most sensible
option. As much waste paper as possible should be recycled in order to avoid cutting
trees to make pulp. More than 90% of the electricity used in mechanical pulping ends
up as heat. If this heat is recovered and used in paper drying, energy will be saved.
Paper mills which integrate mechanical, chemical, recycled paper and pulp operations
are 10–50% more efficient than stand-alone paper mills. In the industrialized countries,
more paper is recycled than produced. Recycling of paper is a common practice in most
countries – for instance, China recycles 64% of its paper. There can be saving of 10 GJ
to 20 GJ of energy per tonne of paper recycled, depending upon the kind of paper
waste. Canada and USA are rich in wood resources. Canada is the largest producer of
mechanical pulp, and USA is the largest producer of chemical pulp, in the world.
Paper production involves the drying of process fibres. Paper drying consumes 25
to 30% of the energy used in the pulp and paper industry. There could be energy
saving of at least 15–20%, if not 30%, if this is done efficiently. Improved forming
technologies, increased pressing and thermal drying could be made use of to remove
water efficiently. Super-critical CO
2
use and nanotechnology have great potential to
manage the role of water and fibre orientation process. Table 13.10 gives the global
technology prospects for drying.
The Best Available Technologies (BAT) for pulp and paper industry recommended
by the European Union are given in Table 13.11.
164 Green Energy Technology, Economics and Policy
Table 13.10 Global technology prospects for energy-efficient drying technologies
Efficient drying 2003–2015 2015–2030 2030–2050
Technology stage R&D, Demonstration Demonstration, Commercial Commercial
Investment costs (USD/t) 800–1100 700–1000 600–700
Energy reduction (%) 20–30% 20–30% 20–30%
CO
2
reduction (Gt/yr) 0–0.01 0.01–0.02 0.02–0.05
(Source: ETP 2008, p. 507)
Table 13.11 Best Available Technology (BAT) for the paper and pulp industry
Heat GJ/t Electricity GJ/t
Mechanical pulping 7.5
Chemical pulping 12.25 2.08
Waste paper pulp 0.20 0.50
De-inked waste paper pulp 1.00 2.00
Coated papers 5.25 2.34
Folding boxboard 5.13 2.88
Household and Sanitary Paper 5.13 3.60
Newsprint 3.78 2.16
Printing and writing paper 5.25 1.80
Wrapping and packaging paper and board 4.32 1.80
Paper and paperboard not elsewhere specified 4.88 2.88
(Source: ETP 2008, p. 505)
13.6 NON-FERROUS METALS
The non-ferrous metals sector comprises of aluminium, copper, lead, zinc and cad-
mium. Copper, lead and zinc are called base metals. In 2005, the non-ferrous metals
accounted for 3% of the industrial energy, and 2% of the energy and process CO
2
emissions.
World Aluminium (2007) gave a detailed account of the role of electricity in
aluminium industry. European Commission (2001) reviewed the Best Available
Techniques in the non-ferrous metal industry.
Bauxite is the principal ore of aluminium. It is composed of the minerals, gibbsite –
Al(OH)
3
, boehmite – γ AlO(OH), and diaspore – α AlO(OH). There are two kinds
of bauxite: karst bauxite (carbonate bauxite) and lateritic bauxite ( silicate bauxite).
Bauxite formation involves desilication and separation of aluminium from iron, under
conditions of tropical weathering characterized by warm temperatures, high rainfall
and vegetation, and good drainage. Australia is the largest producer of bauxite in
the world, accounting for one-third of the bauxite production. China, Brazil, Guinea,
India and Jamaica are important producers. World production of bauxite in 2008
was 205 Mt. Reserves are 27 billion tonnes. Bauxite is a kind of soil, and hence it is
recovered by surface mining.
Bauxite is treated with sodium hydroxide in pressure vessels at temperatures of 150–
200
◦
C, to separate the aluminous part from the ferruginous part (red mud) (Bayer
Industry 165
Table 13.12 Global technology prospects for inert anodes and bipolar cell design in primary aluminium
production
Inert anodes 2003–2015 2015–2030 2030–2050
Technology stage R&D Demonstration Commercial
Investment costs (USD/t) N/A Cost savings Cost savings
Energy reduction (%) N/A 5–15% 10–20%
CO
2
reduction (Gt/yr) N/A 0–0.05 0.05–0.2
(Source: ETP 2008, p. 512)
process). Most of the energy consumed in alumina production (about 12 GJ/t of alu-
mina) is in the form of steam. Integration of alumina plants with CHP units, can
bring down the energy consumption to around 9 GJ/t. The world alumina production
is 60 Mt, involving the use of 16 Mtoe of energy. Two kg. of alumina is needed to
produce one kg. of aluminium metal.
The calcined alumina is molten with cryolite at a temperature of 1000
◦
C, and
aluminium metal is produced electrolytically by Hall- Héroult process.
The conversion of alumina to aluminium metal is highly energy intensive. The
amount of electricity used to produce one tonne of aluminium metal varies from 14 622
to 15 387 kWh, with a weighted average of 15 194 kWh/t. New generation smelters
use much less energy of 13 000kWh/t. About 18 GJ of pitch and petroleum coke is
needed for the production of anodes per tonne of aluminium.
Since electricity cost constitutes the bulk of the cost of aluminium metal produc-
tion, aluminium smelters are invariably located not where bauxite is, but where large
quantities of cheap electricity are available. For instance, alumina is shipped all the
way from Guiana in South America for being smelted in Ghana in West Africa where
cheap hydropower (∼1 000 MW) from Volta dam is available (the Aksombo dam on
the Volta river created the Volta Lake, the fourth largest man-made lake in the world).
Aluminium smelters have come up in countries like Norway, Iceland, Canada, Russia
and the Middle East where low-cost electricity is available.
Most of the growth in the aluminium industry has taken place in China. China’s
production has doubled from 7 Mt in 2005 to 14 Mt in 2008.
The primary aluminium production requires twenty times more energy than
recycling.
The use of inert cathodes in place of carbon anodes not only reduces the energy
consumption by 10–20%, but also eliminates the CO
2
emissions. But this technology
has yet to achieve market penetration. The global technology prospects for inert anodes
are given in Table 13.12.
13.7 RESEARCH & DEVELOPMENT, DEMONSTRATION
AND DEPLOYMENT
Much R&D, Demonstration and Deployment work is needed to reduce costs, improve
energy efficiency and reduce CO
2
emissions, in order to achieve ACT targets.
Table 13.13 gives the RD&D breakthroughs needed, technology wise (source: EPP,
2008, p. 586–589
166 Green Energy Technology, Economics and Policy
Table 13.13 RD&D breakthroughs needed
RD&D breakthroughs, technology-wise Stage ACT target
Biorefineries: Pulp and paper Demonstration
Black liquor to methanol pilot plants
Biorefineries: Biomass for various industries: Applied R&D
Lower-cost biomass collection system for large-scale plants
CCS overall: Reduce capture cost and improve overall Basic science/
system efficiencies; and storage integrity and monitoring Applied R&D
CCS for blast furnace (iron/steel): Development of new blast 195 Mt
furnace with oxygen and high temperature CO
2
mixture CCS (2050)
CCS for cement kilns (cement): Use of physical absorption 400 Mt (2050)
systems (Selexol or other absorbents); use of oxygen instead (energy +
of air; and process design to accommodate potentially higher process)
process temperatures
CCS for black liquor (paper): Integration with IGCC + CCS
and maximized production of biofuels for other use.
Feedstock substitution – cement: Clinker substitute Applied R&D
(reduction of carbon contents by upgrading of high carbon
fly ash through froth flotation); triboelectrostatic separation,
or carbon burnout in a fluidized bed; special grinding to
increase the pozzolanic reaction rate of fly ash, and use of
steel slag.
Feedstock substitution – Chemical & Petrochemical: Applied R&D 26 Mtoe
Biopolymer (e.g., polyactic acid; polytrimethylene biomass
terephthalate fibres; polyhydroxyalkanoates; monomers from feedstocks
biomass and more advanced fermentation and separation by 2050
technology, e.g. butanol; and naphtha products from biomass
FT process
Fuel substitution: Electric heating technologies; and Applied R&D
development of suitable heating and drying technologies
Fuel substitution – heat pump: Higher temperature application;
larger system; and higher coefficient of performance (COP)
Plastics recycling/ energy recovery – Chemicals and Applied R&D
Petrochemicals: Better low-cost separation technologies; and
dedicated high efficiency energy recovery technologies
Process innovation in basic materials production Basic science 5–10% energy
processes – Aluminium: Development of inert anodes; reduction
fundamental materials research; bipolar cell design; and (2030)
anode wear of less than 5 mm per year
Cement : Development of high performance cement using Basic science
admixtures
Chemicals and petrochemicals: Increased nitrogen fixation Basic science/
(new nitrogen fertilizer formation and understanding of steps Applied R&D
that lead from recognition of signals exchanged between plant
and bacteria to the differentiation and operation of root
nodules; the genes responsible for rhizobia and legumes; the
structural chemical bases of rhizobia/legume communication;
and the signal transduction pathways responsible in respect
of the symbiosis-specific genes involved in nodule
development and nitrogen fixation); and use of membranes
(performance improvement of various membranes for specific
gases; liquid and gas membranes for liquid-liquid extraction and
cr yogenic air separation; and development of membrane reactors).
(Continued)
Industry 167
Table 13.13 Continued
RD&D breakthroughs, technology-wise Stage ACT target
Iron/Steel: Smelt reduction (reduction of surplus gas); and Demonstration/ 195 Mt/yr
direct casting – i.e. near-net shape casting and thin-slip casting Deployment/ (2050)
(increased reliability, control and adoption of the technology to Commercialisation
larger-scale production units; product quality improvement;
and usability improvement by steel processors and users).
Pulp and Paper: Black liquor gasification; increased reliability Applied R&D
of gasifier
Gasifier with a gas turbine Demonstration
Chapter 14
Buildings &Appliances
U. Aswathanarayana
14.1 INTRODUCTION
Buildings are large consumers of energy – in 2005, they consumed 2 914 Mtoe of
energy. The residential and service sectors account for two-thirds and one-third of the
energy use respectively. About 25% of the energy consumed is in the form of electricity.
Thus the buildings constitute the largest user of electricity.
Globally, space and water heating account for two-thirds of the final energy use.
About 10–13% of the energy is used in cooking. Rest of the energy is used for lighting,
cooling and appliances. The end-uses dominated by electricity consumption are impor-
tant from CO
2
abatement perspective, in the context of the CO
2
emissions related to
electricity production.
CO
2
emissions can be reduced significantly through the use of Best Available Tech-
nologies in the building envelope, HVAC (heating, ventilation and air conditioning),
lighting, appliances and cooking. Heat pumps and solar heating are the key technolo-
gies to reduce emissions from space and water heating. New designs of energy-efficient
houses can reduce the heating demand by as much as a factor of ten, without much
additional expense. Through a combination of compact design, careful orientation
towards sunlight, proper insulation, high air tightness, and heat recovery from the
insulation system, it is possible to have houses with virtually no heat loss. Government
policies in respect of passive housing may be so framed as to promote, demonstrate
and deploy new technologies, in the construction of new houses and refurbishment of
old houses.
The buildings sector employs a variety of technologies for various segments, such
as building envelope and its insulation, space heating and cooling, water heating
170 Green Energy Technology, Economics and Policy
systems, lighting, appliances and consumer products. Local climates and cultures have
a profound effect on energy consumption, apart from the life styles of individual users.
The economic lifetimes of the individual segments of the buildings sector have an
enormous range. Building shells can last for decades, even for centuries. So buildings
tend to be renewed, rather than replaced. It is likely that more than half of the existing
buildings will be standing in 2050. As against this, HVAC (heating, ventilation, air
conditioning) systems are changed once in 10–15 years. Household appliances are
changed over a period of 5 to 15 years. At the other end of the scale, incandescent
light bulbs are changed yearly. The economic lifetimes of the various segments of the
buildings have a large range – from a few years for light bulbs, to a few tens of years
for electric transmission equipment, to hundred years or more for building stocks
(ETP, 2008, p. 522). The magnificent Brihadeswara (Lord of the Universe) temple in
Thanjavur, South India, built in 1010 A.D., is an excellent shape after a thousand years.
Under the circumstances, government policies and standards should be such as
to promote the deployment of Best Available Technology for the infrastructure
components at the time of refurbishing a building.
Many a time a person living in a residential building may not be the owner of the
building. Though the tenant would replace on his own, items of infrastructure with
short economic lifetimes (such as lights and fans), major improvements, such as, fit-
ting the building with solar panels, have to be undertaken by the owner. Evidently,
the owner and tenant need to coordinate their efforts to improve efficiency and reduce
CO
2
emissions.
Through the application of integrated, intelligent building systems, it is possible
to achieve about 80% reduction in energy consumption and emission of greenhouse
gases. This involves integrated passive solar design with structural components of
advanced design, such as, high-performance windows, vacuum-insulated panels, and
high-performance reversible heat pumps. Research and Development and professional
training activities have to be undertaken to realize the goal.
Now, France has launched a massive greening programme, starting with the con-
struction business. About 25% the country’s greenhouse-gas emissions come from
energy consumption in the buildings. About 200,000 to 500,000 jobs are expected to
be created in the process of bringing about a 40% drop in the energy consumption in
the construction sector by 2020, involving investment of hundreds of millions of euros.
In about twenty years’ time, France is expected to have houses which are off-
grid (i.e. self-sufficient in electricity). Some may even generate more energy than they
consume.
The heating requirements of a building are very much dependent on the age of the
building. The data obtained from Germany show that pre-1970 buildings require 55
to 130% more energy than modern buildings. The turnover of building stocks in the
developing countries is much faster, typically 25–30 years (this situation is reflected in
the regulation that banks in India do not give loans to buy flats/buildings older than
20 years).
The long economic life of the buildings in the OECD countries act as a constraint
in reducing the energy requirements and greenhouse gas emissions.
About 38% of the global total final energy consumption is attributed to buildings
(this includes structures used in agriculture and fisheries). Buildings in OECD countries
account for 45% of this consumption, transition countries account for 10%, and the
developing countries account for 46%.
Buildings & Appliances 171
Table 14.1 Final Energy consumption in the services and residential sectors in different regions in 2005
OECD countries Economies in Transition Developing countries
Electricity 38% 14% 15%
Oil products 19% 17% 17%
Natural Gas 33% 37% 5%
District heat 4% 31% 1%
Coal products 1% 3% 6%
Renewables and waste 5% 3% 56%
(Source: ETP, 2008, p. 525)
Most of the OECD countries which lie in the temperate and cold regions, use natural
gas and oil for space heating. District heating is important in transitional economies
(like Russia). Developing countries are largely dependent upon renewables and
wastes.
Though reliable information is not available for non-OECD countries, IEA estimates
that two-thirds of energy is used for space and water heating, 10–13% for cooking,
and the rest for lighting, cooling and other appliances. There is much variation among
the developing countries in regard to the fraction of energy use in the buildings sector
for space and water heating – about two-thirds in the case of China and about a quarter
in the case of Mexico (Table 14.1).
Energy consumption in the buildings sector varies greatly among countries and even
parts of countries, depending upon the size of the household, heating and cooling load,
lighting, number and types of appliances, and the pattern of their use. For instance,
the number of light bulbs used in a household in China is 6.7, as against 40 for a
household in Sweden. Senior citizens in USA prefer to live (say) in Florida, because of
low heating bills.
Global population which was about 6.5 billion in 2005, is expected to reach 9.2 bil-
lion in 2050, i.e. by about 1.4 times. The demand for energy in the residential buildings
sector is, however, expected to rise much faster, for two reasons: (i) with the decrease in
the number of persons per household, the number of households globally is expected to
rise 50% faster than the population growth, and (ii) the household floor area and the
appliances used in a household are expected to increase, thus requiring more energy.
Service sector floor area is projected to rise by 195% during the period, 2005–2050.
As a consequence of the rapid growth in the use of appliances, electricity consump-
tion in the buildings sector is expected to increase by 180% during 2005 and 2050.
Consequently, CO
2
emissions (produced in the process of electricity generation) related
to the building sector are expected to increase by 129% during this period. In the
residential sector, energy demand is projected to grow by 1.2% per year according to
the Baseline scenario. The growth is projected to be 1.7% during 2005–2015, falling
to 0.9% during 2030 to 2050.
The growth of the energy consumption in the services sector varies greatly among
the regions: Latin America: 3.2%, Middle East: 3.1%, Africa: 2.7%, developing Asia:
2,6%, transition economies: 2.3%, and OECD countries: 1.0–0.8%.
In the OECD countries, the pattern of consumption of energy in 2004, was as
follows: Space heating: 54%; Water heating: 17%; Appliances: 20%, Lighting: 5%,
and cooking: 4%.
172 Green Energy Technology, Economics and Policy
The energy consumption in the buildings sector in the non-OECD countries is
expected to grow by 98% during 2005 and 2050. During 2005 and 2050, the energy
demand in the service sector is expected to grow at a much faster rate (227%) than in
the case of the residential sector (84%).
The rise in the middle class incomes triggered an urban construction boom in China
and India. This is manifested in increase in the number of households, and the housing
floor area per person. While China is switching from solid fuels (biomass and coals),
India has shifted from fuel wood, cow dung and agricultural waste to kerosene and
LPG. The number of Indians who use biomass for cooking is expected to drop from
668 million in 2005 to 300 million in 2050. It is also projected that by 2050, virtually
all Indians will have access to electricity.
The Baseline scenario makes the following projections upto 2050 in the case of
China: increase in the urban residential floor area at the rate of about 530 million sq,
ft. per year; proportion of the population living in cities from 40 to 60% by 2030 to
73% in 2050; reduction in the size of the average household from 3.5 persons in 2005
to 2.9 persons in 2050. In the case of India, the residential floor area is expected to
increase by 3.2 times during the period, 2005 to 2050.
China has prescribed energy-efficiency standards for the buildings sector, but com-
pliance is not satisfactory – it varies from 60% in the northern region to 8% in the
southern region.
In China and India, the use of household appliances has soared, as incomes rose,
and the prices of the appliances fell. In some cases, they reached saturation levels.
Improvements in the energy efficiency of appliances have partly offset the increasing
energy demand due to larger numbers.
The share in the economy and the energy consumption in the services sector are
expected to grow five-fold in the case of China, and even at a greater rate in the case
of India.
Ageing population is the characteristic of Russia, which is the most important mem-
ber of the transition economies. Consequently, there will hardly be any increase in the
number of households. However, as incomes rise, Russia is experiencing a building
boom – the average size of the new apartments (83 m
2
) is 63% larger than the stock
average.
Because of the cold climate of the transition economies, space heating accounts for
two-thirds of residential sector energy consumption.
Residential Energy demand is projected to be reduced by 31% below the Baseline
in 2050 in the ACT Map, and by 41% under the BLUE Map scenario. There would
be a decline in all fuel sources, with the exception of non-biomass renewables, which
are expected to increase by 128% under the ACT Map scenario and by 270% in the
case of BLUE Map scenario (Table 14.2).
14.1.1 The building shell, heating and cooling
The energy efficiency of a building shell is critically dependent upon the insulation and
the thermal properties of the building shell (walls, ceiling, and ground or basement
floor). It therefore follows that improvement in insulation can reduce the heating
requirement by a factor of two to four compared to the standard practice. It should
be mentioned here that this improvement in insulation can be brought about at a few
174 Green Energy Technology, Economics and Policy
When glazing is achieved using low-conductivity gases, maintenance is the key to
achieve good results – the performance may deteriorate by 60% if the maintenance is
poor.
Glazings are available which while maximizing the transmission of visible sunlight,
reflect or absorb a large fraction of the incident solar radiation. This will reduce the
need for cooling.
The improvement in the technological performance of the windows does not entail
any extra expense. In some cases, the costs have gone down (Jakob and Madlener,
2004).
When windows need to be replaced, replacing single glazing with more efficient
glazing, need not be expensive, in the range of USD 57–490/t CO
2
saved.
14.1.3 Hot water
There are two principal ways to improve the efficiency of hot water systems: installing
hot water cylinder insulation, and installing condensing boilers and heat pumps. It is
possible to have solar water heating, at the cost of USD 1 to 2 per kW, depending upon
the location and the number of sunshine hours. It is possible to have solar power to
provide 60% to 70% of domestic hot water needs in residential buildings. Even in the
case of the service sector buildings which may require higher temperatures (∼250
◦
C),
solar power could provide 50% of heat requirements. Research is on to develop solar
hot-water system which can deliver 2500 kWh per year at the cost US cents 4/kWh.
Experience has shown that it is highly economic to have hot-water cylinder insulation
and to switch from an inefficient boiler to a condensing gas boiler. In Canada, hot water
insulation and water saving devices showed negative costs of USD 209 to 360/t CO
2
saved (Seeline Group, 2005).
14.1.4 Cooling systems: Air conditioning
The efficiency of air conditioners varies a great deal. The least efficient are portable air
conditions with energy ratio of less than 1.5 W/W (watts of cooling output per watts of
power input). Modern split-room air conditioners have energy efficiency of 6.5 W/W.
Further improvements are being made in the energy efficiency through using “vari-
able speed drive compressors, improving heat transfer at heat exchangers, optimizing
the refrigerant, utilizing more efficient compressors, and optimizing controls’’ (ETP,
2008, p. 542).
The energy efficiency of the air conditioners is critically dependent upon the energy
efficiency of heat pumps. The Coefficient of Performance (COP) of heat pump air
conditioners has increased from 4.3 in 1997 to 6.6 in 2006. Some heat pumps have
been able to achieve COP of 9.0.
Evaporative coolers work well in hot, dry climates. In these units, the outdoor air
is cooled by evaporation, and the cool air is blown inside. Evaporative coolers cost
about half of air-conditioners, and use a quarter of as much energy.
A room may be hot or cold in different seasons, or at different times in a day.
Reversible heat pumps may be used if a room is hot and cold in different seasons or
in different parts of the day. The efficiency of these systems depends upon the COP of
the unit, and ventilation and thermal efficiency of the building.
Buildings & Appliances 175
The number of air conditioners is increasing rapidly. Air conditioning has become
a major energy consumer, often accounting for 50% of the cost of the running of
the buildings. Though the initial costs of some types of air conditioners are on the
high side, they may have lower life-cycle costs. The use of programmable thermostat
controls is recommended, as they could save energy and money.
In USA, use of advanced unitary compressors for air conditioning units is character-
ized by an abatement cost of USD 95/t CO
2
. In the case of service sector, an advanced
rooftop air conditioner unit could save over 4000 kWh per year, at a negative cost of
USD 72/t CO
2
saved. In India today, electricity consumption due to air conditioning
can be saved from its present to 10 to 11% (for USD 14 to 65/t CO
2
saved) to about 30
% (for USD 120 to 170/tCO
2
saved). Use of split system heat pump air conditioning
can bring down China’s air conditioner electricity consumption by 27% (at the cost of
USD 20/t CO
2
saved).
14.1.5 Appliances
Households are using more and more appliances. Some appliances like refrigerators
have become more efficient. As against this, higher penetration of electronic home
entertainment has raised the electricity consumption by 20%. On one hand, there is
considerable improvement in the energy efficiency of home entertainment appliances.
For instance, the switch from CRT televisions to more efficient LCD screens did reduce
electricity consumption. But against this, expansion in the size of the screens, increasing
in viewing hours and increase in the number of televisions per household, have tended
to increase energy consumption.
Availability of low-cost electronic control technologies, improved materials, reduced
manufacturing costs, and economies of scale have helped the Developed countries
to improve energy efficiencies by 10 to 60%. Technical potential exists for further
improvements in energy efficiency by 30 to 60%. Potentials for improvements in energy
efficiency in developing countries and transition economies are even greater as they
can leap-frog to more efficient technologies.
As BATs achieve greater market penetration, their costs will be greatly reduced
(Table 14.3).
In most developed countries, rising family incomes meant that the overall running
costs of appliances constitute only a small proportion of the household income, and
is therefore ignored. Often, the consumers are unaware of the energy consumption of
current TV technologies, and do not realize that a saving of 50% energy consumption
is possible with LCD televisions with backlight modulation, or organic LEDS.
Governments should promulgate policy measures, such as regulatory and volun-
tary approaches, fiscal measures and procurement policies, to bring efficient energy
technologies to the market. Manufacturers should be instructed to design all their
devices with the ability to move to lowest power needed for their required functionality.
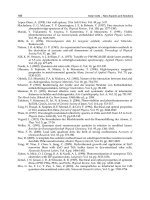
14.1.6 Lighting
Daylight is the largest, cleanest and highest quality source of light. Poor architecture
some times creates need for lighting, where it is not necessary. Each of these areas in
buildings has great potential to reduce lighting energy needs, without compromising
on lighting services.
Buildings & Appliances 177
0 20 40 60 80 100 120 140
Efficacy of lamp and ballast (initial lumens/watt)
Standard incandescent
Tungsten halogen
Halogen infrared reflecting
Mercury vapour
Compact fluorescent (5–26 W)
Compact fluorescent (27–55 W)
Linear fluorescent
Metal halide
Compact metal halide
High-pressure sodium
Light-emitting diode (red, orange, green, blue, and white)
Sunlight, inside glass
Daylight, inside glass
160 180 200 220 240 260 280 300 320 340 360 380
Figure 14.1 System efficacy of various light sources
(Source: ETP 2008, p. 548, © OECD – IEA)
Sweden, Switzerland, Canada). Reversible heat pumps which could be used both for
heating and cooling are popular in countries where heating loads are moderate and
cooling is required during summer.
Electric heat pumps account for 20% to 50% of electricity used for space and water
heating. According to US EPA, the electricity consumption of ground-source heat
pumps is 44% less than air-source heat pumps. Though ground-source heat pumps
are more efficient than air-to-air source heat pumps, they are characterized by higher
installation costs (Sachs et al, 2004).
Heat pumps can also be used for water heating. Some designs (e.g. ECO Cute Heat
Pump) are far more efficient than conventional hot water heaters, but they are 2.5
times more expensive to install than conventional options. Their prices are, how-
ever, coming down. These new pumps may soon present a significant CO
2
abatement
opportunity.
It is interesting to compare the installation and running costs of heat pumps versus
boilers. A typical gas boiler costs about USD 1 500, as against USD 5 000 for a heat
pump. A gas boiler would need about 50 GJ of gas per year, whereas a heat pump would
need only 15GJ of electricity per year. When a gas boiler is replaced by a heat pump,
there will be a saving of CO
2
emissions of 2.8 t per year (assuming that electricity was
produced CO
2
-free), at a lifetime cost of USD 160/t CO
2
saved.
Presently, heat pumps are not a viable option of CO
2
abatement. In China, the
average water heater with a tank capacity of 8–10 litres, costs around USD 100. The
comparable ECO Cute heat pump in Japan with much greater capacity, costs about
USD 5000/ There is a good possibility that when high-efficiency, less expensive,
reversible heat pumps enter the market, the developing countries may find them an
attractive proposition to be used in regions characterized by moderate heating loads
and significant summer cooling requirements.
178 Green Energy Technology, Economics and Policy
14.1.8 Solar thermal heating
Solar thermal heating is making rapid progress – there has been over 15 GW
th
new
capacity in 2006 alone, increasing the total capacity by 16% globally. China leads the
world in solar thermal heating. The total capacity of glazed flat plate and evacuated
tube water collectors in China in Dec. 2005, was 52 500 GW
th
, which is eight times
more than that of Turkey (6 300 GW
th
) which has the next largest installed capacity.
Solar thermal heating is making good progress in Japan, European Union countries,
India, etc.
There are two kinds of solar thermal heating: passive systems which use windows
directed mainly towards the sun, and active systems involving collectors, heat storage
and controls. In the active systems, solar radiation on the collector panel warms water
or some other heat transfer fluid when they are circulated through a duct. The amount
of heat energy that could thus be collected varies from 300 to 800 kWh/m
2
/yr. In some
designs, the warmed heat transfer fluid transfers the heat to be used as hot water or
for space heating.
Solar thermal heating has achieved good market penetration and is used for crop
drying, heating of buildings, and for industrial heat. In China, simple, cheap systems
of solar heating have penetrated the market deeply, in the context of the expensive
conventional hot water systems (Philibert, 2006). These systems do not, however,
have freeze protection which is not necessary in China. Without freeze protection, the
Chinese-type solar thermal heating could not be used in Europe, and hence did not
receive adequate market penetration.
In latitudes below 40
◦
, the substitution of solar heaters in the place of conven-
tional inputs of gas or electricity could lead to saving of 50% in cases that require
temperatures upto 250
◦
C, and saving of 60% to 70% for domestic water heating at
temperatures of around 60
◦
C. In such a situation, the coefficient of performance (COP)
of solar water heaters and heat pumps become comparable.
“Combi’’ designs which can be employed both for water and space heating, are
becoming popular as they are more economically viable. As solar energy is intermittent,
active solar space and water heating need back-up energy in the form of (say) electricity,
bioenergy, or fossil fuels, which add to the costs. New technologies which integrate
solar-assisted water heating with heat pump, are far more efficient than condensing
boilers, have good potential.
Solar hot-water heating can result in modest CO
2
abatement costs. In South Africa,
the abatement cost works out around USD 30/t CO
2
.
Solar thermal systems have achieved good market penetration not only for water
heating, but also heating swimming pools, and residential buildings, in countries, such
as Cyprus, China, Germany, Turkey, Austria, etc. Their market penetration in cold
countries has been insignificant, because of the high costs involved in freeze protection.
There has been a 20% reduction in the initial costs of solar thermal systems. As
Combi systems are becoming cheaper, their market penetration is increasing. Prices
of the solar thermal systems could come down further, through advances in materials
and components, such as the development of effective optical coatings on surfaces,
and anti-reflective and self-cleaning glazing materials. The ability of the materials
to withstand higher temperatures, will prolong the lifetime of, and reduce the need
for servicing of, the devices. Efforts are under way to develop designs whereby new
Buildings & Appliances 179
flat-plate collectors are integrated into building facades and roofs. There is good market
for photovoltaic-thermal collectors which can heat water as also generate electricity.
Currently, the solar thermal market largely involves small-scale units installed in
single-family houses. There is need to enlarge the size of the units to serve larger
establishments like schools, hotels and commercial buildings. In the place of solar
thermal units with back-up energy in the form of electricity, bioenergy, etc., stand-alone
units, i.e. without back-up, with high-efficiency storage applications and well-insulated
buildings, are coming up, and may soon become competitive.
Improvements are needed in the efficiency of Concentration of Solar Heating (CSH)
technologies in order for CSH to be used in district heating or large industrial applica-
tions of megawatt scale. Several collector and component designs need to be optimized
for industrial applications.
There is little doubt that the more the architectural designs are integrated with
standardized elements, the more will be the market penetration. Governments could
give a thrust to market penetration by prescribing standards. In the absence of such
standards and guidelines, the consumer has difficulty in making choices.
14.2 PASSIVE HOUSES AND ZERO-ENERGY BUILDINGS
The energy system of a building is complex, and involves a large number of components
which interact with one another in complex ways. Building-energy simulations allow
the design of “zero-energy’’ buildings (ZEB), in which the energy demand is balanced
by the energy produced in the building. Similarly, it is possible to design “zero-carbon’’
buildings where the net CO
2
emissions over a year will be zero. Where a building sat-
isfies the requirements of both zero-energy and zero-carbon, it is called zero-squared.
Off-the – grid buildings are stand-alone ZEBs that are not connected to an off-site
energy facility. They require energy storage capacity to take care of the situation when
the sun is not shining or the wind is not blowing.
Zero-energy buildings achieve that state in two ways:
(i) By using solar cells and wind turbines for electricity generation and biofuels and
solar collectors for other forms of energy generation. The buildings are connected
to the grid – excess power from solar cells and wind turbines is fed to the grid
during (say) the daytime. During the nights when solar cells cannot generate
electricity or during times when there is no wind, energy requirements for the
house are drawn from the grid.
(ii) By reducing the heating and cooling loads drastically through the use of high-
efficiency equipment, improved insulation, high-efficiency windows, natural
ventilation, etc. Skylites are designed to provide 100% of the day-time illumina-
tion. Fluorescent and LED lamps which require one-third less energy are used for
illumination in the nights. Exhaust from refrigerators and heat recovered from
wastewater can be used to warm domestic hot water.
Where supply-side options (e.g. generating more power) are expensive, recourse could
be taken to demand-side possibilities. The development and deployment of smart grids,
smart appliances and advanced metering could be made use of to manage the peak
180 Green Energy Technology, Economics and Policy
demand. The back-up power in the case of intermittent renewables (e.g. solar PV in
the nights) could be substantially reduced using this approach.
Energy consumption in the case of passive houses can be brought down by 70% to
90% through “intelligent’’ design using 3-D simulation.
Structures have come up in different parts of the world to demonstrate the techno-
economic feasibility of zero-energy buildings. For instance, the 71-storey Pearl River
Tower which houses the headquarters of the Guangdong Company, gets its energy
from solar and wind power. Z-Squared Design Facility has been set up in San Jose,
California, USA. Canada has set up R-2000 standard for energy-efficient housing.
Germany has set up a self-sufficient, solar house in Fraunhofer Institute.
There is increasing public interest in passive/zero-energy/zero-carbon houses. The
design and construction of a building have to be done in such a way that the energy
efficiency of the individual parts of a building as well as that of HVAC (houses, heating,
ventilation and air conditioning) is optimized. The passive house design should achieve
a level of 15 kWh/m
2
for heating and cooling. In some European countries, such as
Germany and Austria, passive housing has gone beyond the demonstration stage. The
market penetration of passive housing will continue to be limited until there are cost
reductions of individual components. Considering that bulk of the 1200 GW solar PV
to be deployed under BLUE scenario will be mounted on buildings, there is little doubt
that prices for passive housing will come down.
The typical additional investments needed for passive houses are in the range of
6–8%. The payback period for passive houses can be long – it is 30 years in Belgium.
The abatement cost to refurbish passive houses in Germany is estimated to be USD
800/t CO
2
. Existing multi-family houses can save as much 90% of the heating costs,
if at the time of refurbishment passive housing technologies are adopted.
In India, green buildings are estimated to cost 8% to 10% more than basic buildings.
The pay-back period is 5 to 7 years (Srinivas, 2006).
There are barriers impeding the market penetration of passive houses. People are
concerned that the initial costs are high, and the long-term benefits and resale values
are uncertain.
There is need to design ultra-passive housing with heating demand of 7 kWh/m per
year or less. Passive buildings require to be integrated with renewable energy resources.
When the new technologies are installed in schools, and public offices, more people
can convince themselves of the viability of passive housing.
14.3 BIOENERGY TECHNOLOGIES
Biomass and waste account for about 10% of the global energy supply. More than
80% of the biomass is used for cooking and heating. For about 2.5 billion people, i.e.
40% of the world population who live in developing countries, biomass in the form
of fuelwood, charcoal, agricultural waste and animal dung, is the only affordable fuel
for cooking. About 668 million people in India continue to use animal dung, agricul-
tural waste and fuelwood as fuel for cooking. Because of the low fuel efficiency of the
cook stoves (∼8%), the particulate matter in the Indian households burning biomass
is 2 000
µ
g/m
3
(as against the allowable 150 µg/m
3
), leading to 400 000 premature
deaths.
Buildings & Appliances 181
According to WEO projections, the percentage of the population in the developing
countries that rely on biomass for fuel is expected to decrease from 52% to 42% by
2050, but this would still be a substantial number.
Liquified Petroleum Gas (LPG), ethanol gel and Dimethyl Ether (DME) are impor-
tant bioenergy sources that could substitute or supplement biomass for heating
purposes. They are projected to contribute 50 Mtoe according to ACT Map scenario
and 150 Mtoe according to BLUE Map scenario. Biogas has considerable potential for
rural communities.
DME is a versatile fuel – it can be used in power generation turbines, diesel engines,
or as a replacement for LPG for household cooking. DME is non-toxic, and could
be produced from a variety of feed-stocks, such as, coal, natural gas and biomass.
Currently DME production involves two steps – methanol is produced from syngas,
which is then dehydrated to form DME. New technologies allow the production of
DME from syngas in one step. Other possibilities that are being developed are co-
production of methanol and DME and co-generation of DME and electricity. China
leads the word in coal-based DME production, which is expected to reach 1 Mt/yr
(0.03 EJ/yr) by 2009. Gas-based DME production is picking up in the Middle East.
Investment costs for conventional DME production vary from USD 11 to 15/GJ per
year. The conversion efficiencies for biomass-based DME production range from 45 to
65%. The capital investment cost for DME production varies from USD 450 to 1050
per tonne of biomass. Sweden has reported a DME production cost of USD 11.6 to
14.5/GJ. The price is less in the developing countries.
By the use of homogenous dry fuel, such as saw dust pellets and wood chips, and
by operating the plant continuously, some developed countries have been able to
achieve high efficiencies in small-scale heating plants. Smaller CHP (Combined Heat
and Power) plants of the capacity of <5 MW, which use solid biomass, operate at
steam pressures of 50 to 60 bars. Investment costs for such systems are typically in
the range of USD 615/kW
th
. Research is going on to develop small-scale (1 to 5 MW)
power plants with lower investment costs and better heat-to-power ratios. Such plants
will revolutionise the energy consumption not only in the services sector but also in the
residential sector. Future designs are expected to have provision for flue gas cleaning
and particle separation to protect air quality in densely populated areas.
Table 14.4 (source: ETP, 2008, p. 559) provides particulars about biomass conver-
sion technology in terms of heat output.
Straw-fired, district heating plants are used in some countries. They have maxi-
mum boiler temperature of 120
◦
C, maximum steam pressure of 6 bars, overall plant
efficiencies of 85%, power-to-heat ratio of 0.25, energy cost of USD 68/t of straw, or
USD 17/MWh.
Table 14.4 Biomass conversion technologies
Combustion technology Minimum output (MW) Typical Output (MW)
Mechanical grate 1 2–30
Fluidised bed 2 10
Circulating fluidized bed 7 20
Gasification 0.5 2–10
182 Green Energy Technology, Economics and Policy
Table 14.5 RD&D Targets
Technical targets (Index)
Technologies Current 2030 ACT Map/BLUE Map 2050 ACT Map/BLUE Map
Electric appliances 1 1.15–1.5 1.25–2
Heating and cooling
Technologies
Heat pump 1 1.4/1.6 1.8/2
Air conditioning efficiency 1 1.3/1.5 1.4/17
Lighting systems
Light Emitting Diodes (LED) 1 4/7 6/10
Table 14.6 RD&D breakthroughs needed
Technologies RD&D breakthroughs Stage
Heating and Reasonable-cost, high-temperature heat pump systems (new and Applied R&D
Cooling retrofit applications); system integration and optimization with
technologies geothermal heat pumps
Lighting Improvement of semiconductors; Modification and optimization Applied R&D
systems of known light-emitting substances for LED
New materials for LED; and stability of organic LED Basic science
Woody biomass is used to heat homes and service centres. When heat-retaining fire
places are used, heat is stored in the retaining structure and released into the room over
a period of time, with efficiency of 80% to 85%. Well-designed fire places in which
wood burns cleanly, could keep the whole building warm.
Fuel pellets can be fabricated by compressing dry sawdust or straw, so as to have less
than 15% moisture content. Freshly produced saw dust must will have high moisture
content of more than 50%, and therefore has lower fuel value. Pellet production costs
in Austria and Sweden show that wet feedstock costs USD 10 to 12.9/GJ, whereas dry
feedstock costs USD 5–7.8/GJ.
Pellet production cost is largely dependent upon the cost of the raw biomass material,
and the amount of drying needed to bring down the moisture content to 15%. The
pellet production cost breakdown is as follows: raw material: 35%, drying: 23%;
pelleting: 17% personnel costs: 11%, crushing: 6%, general investment: 4%, storage
and conveyor: 3%, and cooling: 1%.
14.4 RESEARCH & DEVELOPMENT, DEMONSTRATION
AND DEPLOYMENT
Research, Development & Demonstration (RD&D) targets for existing technologies
in buildings and appliances are given in Table 14.5 (source: ETP 2008, p. 589).
Table 14.6 gives the RD&D breakthroughs required for key technologies in buildings
and appliances (source: ETP, 2008, p. 589).