- Trang chủ >>
- Khoa Học Tự Nhiên >>
- Vật lý
Green Energy Technology, Economics and Policy Part 7 doc
Bạn đang xem bản rút gọn của tài liệu. Xem và tải ngay bản đầy đủ của tài liệu tại đây (296.16 KB, 36 trang )
Transport 193
only after there is a drastic reduction (of the order of magnitude) in terms of fuel-cell
stack system and energy storage system.
Future
Progress is being made at such a rapid pace that Toyota is launching gasoline-electric
hybrids (successor to Prius), and Nissan and Honda are launching fully electric vehicles.
Honda is launching hydrogen fuel-cell vehicle (New York Times, Oct. 21, 2009).
Advanced technology vehicles are expected to play a key role, particularly after
2020.
Governments need to promote simultaneously the development of EVs, PHEVs and
FCVs, batteries, recharging infrastructure, while providing incentives for the market
promotion of such vehicles. A practical way will be for governments is to choose
regions and metropolitan areas which have shown enthusiasm to implement the new
approaches.
Biofuels may find increasing use in LDVs. Currently biofuels production is dom-
inated by ethanol from grain crops and biodiesel from oil-seed crops. This should
be phased out. Governments should provide incentives to shift to second generation
biofuels from non-food feedstocks. Such fuels have to be sustainable, low GHG and
cost-efficient, with minimum adverse land-use impacts.
It is possible to reduce CO
2
emissions by shifting the passenger travel to more effi-
cient modes such as mass transit systems (as Singapore has done successfully). Such
a modal shift brings other benefits such as lower traffic congestion, lower pollutant
emissions and more livable cities. Also, citizens may be encouraged to make short trips
on foot or by bicycle (as Paris has done).
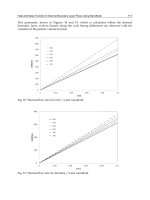
Fig. 15.4 (source: Transport, Energy and CO
2
: Moving towards sustainability, 2009;
© OECD-IEA) shows the extent different technologies and fuels contribute to CO
2
reductions from LDVs in the BLUE Map scenario by 2050.
These projections are no doubt uncertain, but the curves do tell a story. It is possible
to bring about reductions of the order of 5 Gt in CO
2
equivalent emissions from LDVs,
at a marginal cost of about USD 200/tonne with oil at USD 60/bbl. If a higher price
of USD 120/bbl is assumed, the emission reductions can be realized at a marginal
cost of about USD 130/tonne. There is a good possibility that most of the emission
reductions could be achieved at costs far below this. It is expected that most reductions,
particularly up to 2030, could come about from incremental improvements in internal
combustion engine vehicles and hybrid vehicles, at very low average cost.
15.4 TRUCKING AND FREIGHT MOVEMENT
Trucks come in many shapes and sizes – ranging from small delivery vans to heavy
duty tractor-trailers which can carry loads of about 300 tonnes. For most vehicles, fuel
costs represent a significant part of the operating costs. Fuel efficiency gains may be
achieved in the following ways: (i) Downsizing and downweighting, (ii) Improve-
ments in the engine/drivetrain efficiency through turbo-charging, advanced higher
compression diesel engines, and computer controls, (iii) Hybrid drivetrains – they
improve the efficiency of urban delivery trucks and short-haul vehicles, by 25 to 45%,
194 Green Energy Technology, Economics and Policy
0
0
100
200
300
400
Cost per tonne GHG saved
well-to-wheel (USD/t CO
2
eq)
12
GHG savings (G† CO
2
eq/year)
120 USD/bbl
oil price
60 USD/bbl
oil price
3456
FC hybrid
EV, 150 km
of range
CI plug-in hybrid
SI plug-in hybrid
CI hybrid
BTL
Ligno-cellulosic
ethanol
SI hybrid
Sugar cane
ethanol
Figure 15.4 Projected GHG reduction of light duty vehicles and fuels.
Transport, Energy and CO
2
: Moving towards Sustainability, 2009, Executive Summary, p. 37
SI = Spark Ignition (gasoline) vehicle; CI = Compressed Ignition (diesel) vehicle;
ICE = Internal Combustion Engine (ICE) vehicle; Hybrid = Hybrid vehicle;
BtL = Biomass-to-Liquids (Biodiesel); FC = Fuel Cell; EV = Electrical vehicle
(iv)Aerodynamic improvements, particularly for long-haul trucks, through better inte-
gration of tractor-trailer integration, (v) low-rolling, second generation resistance tyres,
(vi) More efficient auxiliary improvement., such as cabin heating/cooling systems and
lighting – long haul trucks use substantial amount of fuel while stationary.
Technology improvements in trucks pay back their costs in fuel savings over the life
of the trucks.
As has happened in the case of LDVs, hybrid propulsion systems are being used with
medium-duty delivery trucks (Duleep, 2007). Electric and fuel-cell powered delivery
trucks and buses used in urban setting, have a good future, as they are often centrally
fuelled. It is unlikely that electric and fuel cell-powered long haul trucks will be viable
in the near future, because of the problems of fueling and durability (long-haul trucks
need to travel 100 000 km/yr).
Truck operational efficiency can be improved in the following ways: (i) On-board
diagnostic systems (real-time, fuel economy computers, data loggers help the drivers
and companies to ensure that they are optimally driven and maintained, (ii) Speed
governors and advanced cruise-control systems helps the drivers to drive safely and
efficiently, (iii) Driver training programmes and good vehicle maintenance system help
to improve trucking efficiency, (iv) Logistical improvements, such as, computerized
truck dispatching and routing, and use of terminals and warehouses.
As the Canadian experience has shown, regular training of drivers in fuel-efficient
driving techniques can yield fuel saving of up to 20% per vehicle kilometer.
Trucking has been growing rapidly during the last two decades, and this is expected
to continue. Trucks can be made 30% to 40% more efficient by 2030 through techno-
logical measures, operational measures and logistical improvements in handling and
routing of goods. In order to optimize the process, governments need to work with the
trucking companies to regulate the driver training programmes and create incentives
for better efficiency. Japan is a pioneer in this effort,
Transport 195
Biodiesel produced from biomass gasification and liquefaction can be readily used
in trucks. Shifting to electricity or hydrogen is not a viable option in the case of trucks
due to constraints of range and energy storage limitations. Thus, second generation,
non-food based biofuels is effectively the only way to decarbonise the trucking fuel.
Shifting to rail transport constitutes an attractive option to save energy and cut CO
2
emissions. Rail transport in the OECD countries costs one-fifth of the truck transport.
Bulk raw materials like coal are often transported by rail. China moves a billion tonnes
of coal per year, using dedicated rail links and trains with payloads of 25 000 tonnes.
High speed rail
Trains with cruise speed of more than 200 km/hour exist in Japan, Europe, and western
USA. High speed rail (HSR) trips of about three hours (700–800 kms.) constitute an
attractive alternative to air travel, as they avoid the hassles of traveling to the airport,
checking-in and security checks. Since electricity used in HSR trips will be generated
primarily by zero-carbon sources after 2030, there will be saving in energy and CO
2
emissions.
Studies made in Europe and Japan show that the energy consumption per line-km in
HSR is about one-third to one-fifth of the aeroplane and car energy use per passenger
line-km (ENN, 2008). The total CO
2
emissions of rail systems are near zero (ignoring
possible fossil-fuel use to heat the rail stations).
The cost of HSR construction varies from country to country, ranging from USD
10 million to 100 million per line-km, depending upon the land costs, labour costs,
financing methods and topography. Europe has 2000 km of HSR in operations, and
plans to add 4000 km by 2020. China is expected to build 3 000 km of HSR in the next
15 years. IEA estimates that HSR travel will save 0.5 Gt of CO
2
per year by 2050.
15.5 AVIATION
Commercial travel has been growing at the rate of about 5% per year in terms of
passenger-kilometers. There has been a steep drop in air travel after September 11,
2001 attack in US, but it picked up later. In 2006, global average growth rate has been
5% in passenger air traffic and 6% in cargo traffic. As air traffic increases, there would
be increase in fuel use and CO
2
emissions. IEA estimates that the technical potential
for efficiency improvement (in terms of energy – intensity reduction) of aviation will
be 0.5% to 1% on an average, i.e. 25% to 50% by 2050. Load factor improvement
in energy efficiency may be 0.1–0.3% per annum. The total potential annual rate of
change may be 0.7 to 1.2%.
Large aircraft burn up to a billion litres of jet fuel over their life times. So reducing
fuel use could provide enormous fuel cost savings. So improvements in the aircraft
design and operation are cost-effective, definitely in the long-term.
Apart from CO
2
, aircraft emissions include nitrogen oxide, methane, and water
vapour which are capable of radiative forcing (i.e. climate warming). More work is
needed to understand the impact of GHG emissions due to aviation.
Improvements in aviation fuel efficiency can be brought about through increasing
engine efficiencies, lowering weight, and lift-to-drag ratio (Karagozian et al, 2006).
196 Green Energy Technology, Economics and Policy
Potential for improved aerodynamics
The higher the lift-to-drag ratio, the less the fuel consumption. The lift-to-drag ratio
can be increased in the following ways: (i) Wing modifications- retrofitting the aircraft
with winglets has improved the lift-to-drag ratio by 4% to 7%, (ii) Hybrid laminar
flow control: when hybrid laminar control processes are applied to fin, tail-plane and
nacelles as well as to the wings, fuel consumption has been found to be reduced by
15%. Improvement of 2 to 5% efficiency are more typical, (iii) Flying wing/blended
wind-body configuration: In this design, the entire aeroplane generates lift, and the
body is streamlined to minimize drag, leading to a high lift-to-drag ratio, and 20%
to 25% less fuel consumption. The commercialization of flying wing aircraft may be
possible by 2025.
Structure/materials-related technology potential
Fuel efficiency can be improved and GHG emissions reduced by making the aircraft
lighter through the use of new materials and composites.
(i) Carbon-fibre reinforced plastic: Carbon fibre – reinforced plastic (CRPF) has
many merits: it is stronger and more rigid than metals such as aluminium, tita-
nium and steel. Its density is half of that aluminium, and one-fifth that of steel.
It is corrosion-resistant, and fatigue-resistant. If aluminium is fully replaced by
CRPF, the weight of the aircraft will be reduced by. 10–15%. Boeing 787 uses
CRPF for 50% of the body (on a weight basis) and one-third of the fuel efficiency
gain of 20% in this kind of aircraft is attributed to this substitution. As CRPF
technology matures, it will be used for wings, wing boxes and fuselages.
(ii) Fibre-metal-laminate (FML): FML is made up of a central layer of fibre sand-
wiched between thick layers of aluminium. It is stronger than CRPF. About
3% of the fuselage skin of Airbus A 380 is made up of FML. It is also finding
increasing use in the construction of aircraft wings.
(iii) Reduction in the weight of engines: New composites not only reduce the weight
of the engines, but they also allow higher operating temperatures and greater
combustion efficiency, which have the consequence of reduced fuel consumption.
Baseline scenario envisages 25% technical efficiency improvement. BLUE Map
scenario projects 35% technical efficiency improvement by 2050.
Operational system improvement potential
Fuel consumption can be reduced in the following ways:
(i) Continuous Descent Approach (CDA): Computerised CDA systems ensures
smoother descent that reduces changes in the engine thrust, and thereby saves
fuel and reduces noise.
(ii) Improvements in CNS/ATM system: Improvement in communications, naviga-
tion and surveillance (CNS) and air traffic management (ATM) systems would
enable the optimization of flight paths, with resulting fuel economy. The Inter-
national Civil Aviation Organization (ICAO) projects fuel savings of about 5%
by 2015 in USA and Europe by this approach (ICAO, 2004).
Transport 197
(iii) Multi-stage long distance travel: Today’s technology is standard for a range of
4000 km. Fuel efficiencies may be improved by developing fleets with ranges of
5000 to 7500 km. This may not be acceptable to all travelers, however.
Alternate Aviation Fuels
Aviation fuel needs to satisfy a number of stringent requirements: it should have large
energy content per unit mass and volume; it should be thermally stable (in order to
avoid freezing at low temperatures; and it should have the prescribed viscosity, surface
tension, and ignition properties. Synthetic jet fuels, derived from coal, natural gas or
biomass, have characteristics similar to conventional jet fuel, and could serve as alter-
nate aviation fuels. Also, their use reduces GHG emissions. Liquid hydrogen is another
possibility, as it delivers a large amount of energy per unit mass. Its use as fuel require
major modifications in aircraft design (Daggett et al, 2006). Other alternatives, such
as methane, methanol and ethanol, do not make the grade because of their low energy
density.
Thus, high-quality, high energy-density aviation biofuels hold great potential as
low-GHG aviation fuels in future. Their sustainability is dependent upon produc-
tion from non-food sources. In the BLUE map scenario, second-generation biofuel,
such as biomass-to-liquid (BTL) fuel, will be providing 30% of the aircraft fuel by
2050.
In the BLUE scenario, air travel growth can be tripled rather than quadrupled by
2050, through alternatives such as high-speed rail systems, and substituting telecon-
ferencing for long-distance trips. Governments and businesses are urged to promote
these developments through appropriate policy actions.
15.6 MARITIME TRANSPORT
International water-borne shipping has grown very rapidly in the recent years due to
the high economic growth of countries like China and India. It now represents about
90% of all shipping use, the rest 10% being used through in-country river and coastal
shipping. The average DWT of the ships is increasing, and so are tonne-kilometres of
goods moved.
The structure of the shipping industry continues to be heavily fragmented, in terms
of ownership, operation and registration. This has constrained optimizing the ship
efficiency. It is not uncommon for a ship to be owned by the Greeks, registered in
Panama and operated by Philippinos. There will be endless legal problems when the
ship runs into trouble (e.g. oil leak).
The world shipping fleet made use of 200 Mtoe of fuel in 2005, which is about
10% of the total transport fuel consumption. During the last decade, the shipping fuel
consumption and CO
2
emissions have been growing at the rate of 3% per annum.
International shipping involves three types of freight movement: dry bulk cargo,
container traffic, crude oil and other hydrocarbons such as liquefied petroleum gas.
Among these, the container traffic has been growing at the fastest rate of about 9%
(Kieran, 2003). It is projected that the container shipping will increase eight-fold by
2050.
198 Green Energy Technology, Economics and Policy
Efficiency technologies
There are a number of ways to improve energy efficiency and reduce GHG emissions of
maritime transport. The fuel consumption of ocean-going ships can be reduced by 30%
through the optimization of the propulsion plant configuration, such as, operating
one engine instead of two per shaft at moderate speeds, reducing auxiliary electricity
demand through greater use of thermostats to regulate ship-board temperatures, and
use of secondary propulsion systems, such towing sail. Towing sails can be retrofitted
to existing ships. It has been claimed that the computerized operation of the towing
sails, can bring down average fuel costs by 10% to 35% (SkySails, 2006).
Changes in hull design by tailoring the stern flaps and wedges to reduce energy
consumption, and increasing ship speed, can reduce the fuel consumption and related
CO
2
emissions by 4% to 8%. Using advanced light-weight materials in ship design
can reduce the hull weight by 25 to 30%, resulting in significant reduction in fuel
consumption.
It has been found that if the ship speed is reduced from 25 knots to 20 knots, there
will be fuel savings of 40 to 50%. So slowing down is a cost-effective approach to
reduce CO
2
emissions. Even if a 10% reduction in speed may require 10% more ships,
that would still be worth it.
Use of high-efficiency, inter-cooled, recuperative (ICR) gas turbine engines can
reduce fuel consumption by 25% to 30%.
Alternative Fuels
Ships presently use heavy fuel oils (HFO). Significant reductions can be achieved if
the ships shift to new carbon-free fuels. Some of the large ship engines with output
exceeding 50 MW have dual-fuel configuration involving natural gas (NG) and HFO
and have thermal efficiencies of over 50%. It is feasible to introduce other liquid and
gaseous fuels (H
2
) in such a set-up. Carbon-free “Green’’ crude produced from algae
has the potential to be used as a fuel in ships. It may presently be more expensive than
heavy fuel oil. Some kinds of bio-crude are not as stable as petroleum fuel. Catalytic
cracking or hydro-treating of bio-crude could upgrade it to the acceptable level, but
that will add costs to the bio-crude.
Despite these constraints, bio-crude or its derivative products have good potential as
low-carbon fuels usable in ships. Liquid hydrogen (LH
2
) has high gravimetric energy
density, as it is 2.8 times lighter than HFO. It increases useful payload, and hence
brings higher economic returns. Most importantly, it is extremely clean. Much R&D
effort is needed to develop LH
2
based fuel-cell systems for ship propulsion (Velduis
et al, 2007). In BLUE map scenario, biofuels share is expected to go up by 30% of
overall fuel use by 2050.
International agreements are needed to bring about improvement in international
shipping efficiency and CO
2
reduction. CO
2
cap-and-trade system may be made appli-
cable to shipping. A standard ship efficiency index to which all new registration of ships
have to adhere (and old ships need to be retrofitted), may be designed and be brought
into existence through institutions such as UN International Maritime Organization
(IMO).
Transport 199
15.7 RESEARCH & DEVELOPMENT BREAKTHROUGHS
REQUIRED FOR TECHNOLOGIES IN TRANSPORT
Table 15.4 Technology breakthroughs in transport sector
Technologies RD&D Breakthroughs Stage
Vehicles
Hydrogen fuel Material investigation for solid storage; Cost Basic science/Applied
cell vehicles reduction and improvements in durability and R&D/Demonstration
reliability of hydrogen on-board gaseous and
liquid storage; cost reduction for fuel-cell
system; durability improvement of fuel cell
stack and balance of system components
(system controller, electronics, motor, and
various synergistic fuel economy
improvements, etc.)
Plug-in Hybrid/ Energy storage capacity and longer life for Basic science/Applied
Electric vehicles deep discharge (further development of Li-ion R&D/Demonstration
batteries, e.g. Li-polymer, Li-sulphur, etc.)
ultracapacitors and fly-wheels; systems that
combine storage technologies, (such as
batteries with ultracapacitors); and
optimization of materials characteristics and
components for batteries
Fuels
Advanced biodiesel Feedstock handling; gasification/treatment; Applied R&D/
(BtL with FT process) co-firing of biomass and fossil fuels; syngas Demonstration
production/treatment; better understanding
of cost trade-offs between plant scale and
feedstock transport logistics
Ethanol (cellulosic) Feedstock research; enzyme research (cost Applied R&D/
and efficiency); system efficiency; better data Demonstration
on feedstock availability and cost per region;
land use change analysis; and co-products and
biorefinery opportunities
Hydrogen Development of hydrogen production; Applied R&D
distribution and storage systems
(Source: ETP, 2008, p. 590)
Chapter 16
Electricity systems
U. Aswathanarayana
16.1 OVERVIEW
About one-seventh of the electricity produced worldwide is lost. Out of this, Trans-
mission and Distribution (T&D) losses account for 8.8%. In developing countries,
considerable amount of electricity is lost through pilferage, often with the con-
nivance of the local employees of electricity corporations. The total Transmission and
Distribution losses are the highest in India (31.9%), and the lowest in Japan (8.7%).
Transmission and Distribution losses as a percentage of gross electricity production
in various countries are given in Table 16.1 (source: ETP, 2008, p. 402).
Unlike other energy carriers, such as coal or oil, it is not possible to store electricity
in large quantities (except in the form of other types of energy, such as pumped storage
or compressed air).
Electricity demand varies according to the time of the day (lower demand in the night)
and climate and season (air conditioning demand during the summer, and heating
demand in the cold countries during winter). Consequently, peak national grid demand
may be two to three times more than the minimum demand. In an electricity grid, it
is imperative that electricity production should keep pace with consumption. If this
condition is not ensured, there would be instability in the grid with severe voltage
fluctuations.
In order to cope with this variability in electricity demand, grids make use of three
types of power generating stations:
(i) Base-load plants, that can provide consistent supply of electricity over long
periods, such as coal-fired thermal power stations and nuclear power stations.
Though both capital and operating costs of coal-fired stations are low, moves
202 Green Energy Technology, Economics and Policy
Table 16.1 Transmission and distribution losses
Direct use T&D Pumped
Country in plant (%) losses (%) storage (%) Total (%)
India 6.9 25.0 0.0 31.9
Mexico 5.0 16.2 0.0 21.2
Brazil 3.4 16.6 0.0 20.0
Russia 6.9 11.8 −0.6 18.1
China 8.0 6.7 0.0 14.7
EU-27 5.3 6.7 0.4 12.5
USA 4.8 6.2 0.2 11.2
Canada 3.2 7.3 0.0 10.5
Japan 3.7 4.6 0.3 8.7
World 5.3 8.8 0.2 14.3
are afoot to phase them out because of their environmental and climate change
impacts. The capital costs of nuclear power are high, but the operating costs are
low. As they have no carbon footprint, they are being favoured, even though the
problems of disposal of nuclear waste, safety and proliferation continue to be
troublesome issues.
(ii) Shoulder-load plants, that can provide electricity during periods of extended
high demand, such as, a natural gas combined cycle plant (NGCC) plant or gas
turbine which has lower capital and operating costs. Such plants can also serve
as base-load plants.
(iii) Peak-load plants, which can provide highly flexible power supply of short
duration, in order to meet the fluctuations in demand, such as, pumped
(hydroelectric) storage.
Variable renewables like wind and solar PV need to have back-up systems based on
storable fuels, like coal or biomass.
The load duration curves have significant impact on CO
2
mitigation costs. In Europe
and USA, the peak demand is double that of minimum demand. Irrespective of whether
a power station is used as a base-load plant or peak-load plant, they will require the
same capital investment. The base-load plant is likely to be coal-fired, whereas the
peaking plant is likely to be gas-fired. CCS (CO
2
capture and storage) of an NGCC
plant costs twice as much as coal-fired plant. At USD 50/t CO
2
, the costs of mitigating
CO
2
may turn out to be much higher for shoulder-load and peak-load plants than for
base-load plants.
16.2 TRANSMISSION TECHNOLOGIES
Power generating units supply electricity to the consumers through a network of trans-
mission and distribution (T&D) grids. Through an intelligent use of the grid system,
France is able to cater to a total supply capacity with one-quarter of the total demand
potential. This is possible because not all consumers will draw the maximum potential
demand at the same time.
Electricity systems 203
Table 16.2 Cost performance of transmission systems
Parameter Unit HVAC HVDC
Operation voltage kV 760 1160 ±600 ±800
Overhead line losses %/1000 km 8 6 3 2.5
Sea cable losses %/1000 km 60 50 0.33 0.25
Terminal losses %/station 0.2 0.2 0.2 0.6
Overhead line cost M Eur/1000 km 400–750 1000 400–450 250–300
Sea Cable cost M Eur/1000 km 3200 5900 2500 1800
Terminal cost M Eur/1000 km 80 80 250–350 250–350
Customarily, electricity is transmitted over long distances on Alternating Current
(A.C.). The higher the A.C. transmission voltage, the lower would be the transmission
losses – the transmission losses would be 8% for 1 000 km at 750 KV, and 15% for
1 000 km at 380 KV. Residences use 220 V A.C. in most countries, and 110 A.C. in
some countries, notably USA. As many as five step-downs may be involved between
generation and actual use. T&D may cost USD 5.5 to 8/MWh, and may constitute 5
to 10% of the delivered cost of the electricity.
The development of high-voltage valves has enabled the transmission of DC power
at high voltages for long distances with lower transmission losses. DC transmission
losses are typically 3% for 1000 km. Most sub-sea cables use DC supply, as losses
by AC cable will be excessive. 800 KV High voltage DC (HVDC) transmission lines
are being increasingly used, as they are more economical than AC lines for longer
distances (>500 kms.). Also, HVDC systems are easier to control, and occupy less
space (Rudervaal et al, 2000).
HVDC has some disadvantages – failure in one line cannot receive help from
elsewhere, as synchronization is not possible.
Because of the public resistance to new overhead HVDC lines, attempts are being
made to lay the HVDC lines underground. This is technically feasible, but the costs
are a deterrent - an underground DC line is 5 to 25 times more expensive than the
overhead line. Advances in new technologies in respect of cables and insulation are
bringing down the costs of the underground cables. This will improve the viability of
underground cables.
The cost performance of transmission systems is summarized on Table 16.2 (source:
ETP, 2008, p. 405).
16.3 DIS TRIBUTION
Transformers are used to step-down the voltage from high to medium and then to
low, in the process of supplying electricity to the consumer. In some cases, as many as
five step-downs may be involved. Power transformers are very highly efficient – losses
are usually less than 0.25% in large units, and do not exceed 2% even in the case
of small units. In a power network, the losses due to transformers can exceed 3% of
total electricity. Replacement of conventional steel cores by amorphous iron cores can
reduce the losses by 30%. In rural India, where there are a large number of lower-
capacity sub-stations, and where conversion of single-phase supply to three-phase
204 Green Energy Technology, Economics and Policy
supply is resorted to, the distribution losses may exceed 30%. During periods of peak
load, the losses may even exceed 45%.
There has been rapid increase in the use of AC/DC transformers in the electronic
equipment. These transformers are switched on permanently, but the device concerned
is used intermittently. Such losses beyond the meter may amount to 5 to 10% of total
electricity.
In the case of wind turbines, transportation over 2 000 km. would add 50% to the
production cost (US cents 2 to 3/kWh).
The development of regional interconnections would reduce the need for storage
and backup facilities, and therefore should be promoted.
Transmission and Distribution (T&D) losses are most serious in developing coun-
tries. It is possible to reduce the global T&D losses from the present 18% to 10%,
through the application of new technologies, and policies.
16.4 ELECTRICITY STORAGE SYSTEMS
Electricity cannot be stored, except in a small way in the form of capacitors. It can,
however, be converted to other forms of energy and stored. In batteries, it is converted
to chemical energy. In pumped storage, it is stored as potential energy. Electricity can
also be stored in the form of compressed air or in fly wheels.
The cost of storage or backup capacity typically adds US cents 1 to 2/kWh.
Fig. 16.1 (source: Thijssen, 2002, quoted by ETP, 2008, p. 407, © OECD-IEA)
depicts the capital cost of different storage options.
Battery electricity storage is efficient, but expensive. For instance, Lithium-ion
battery typically costs USD 500/kWh. Delivered costs are around USD 0.20/kWh.
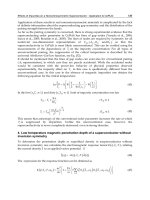
The discharge times and system ratings of different storage options are given in
Fig. 16.2 (source: Thijssen, 2002, quoted by ETP, 2008, p. 408, © OECD-IEA).
Pumped storage is the preferred option. It has an efficiency ranging from 55 to
90%, system rating of about 100 MW, and discharge times of hours. Pumped storage
plants can respond to load changes almost instantly (less than 60 seconds). Compressed
air energy systems (CAES) have efficiencies of about 70%. The biggest problem with
CAES is finding suitable storage caverns. Aquifer storage is a good possibility for CAES
(Shepard and van der Linden, 2001).
Superconducting Magnetic Energy Storage (SMES) stores electrical energy in super-
conducting coils. SMES has the advantage of being able to control both active and
reactive power simultaneously. Also, it can charge/discharge large amounts of power
quickly.
Hydrogen that can be produced from electrolysis could serve as an energy carrier.
During periods of excess demand, it can be used to generate power. The efficiency of
electrolysis is about 70%, and the efficiency of power generation is 60%. Thus, the
hydrogen storage system, has an overall efficiency of 42%. Hydrogen can be stored in
salt caverns, manmade caverns, and depleted oil and gas reservoirs. It costs money to
excavate the caverns, and storage of hydrogen in depleted oil and gas reservoirs may
contaminate hydrogen. Aquifer storage is the cheapest option. Hydrogen fuel storage
will become viable when the appropriate infrastructure for hydrogen production and
use comes into existence, and fuel-cell vehicles become popular.
Electricity systems 205
100
10
100
Investments cost per unit energy (USD/kWh)
1 000
Better for energy management
applications
10 000
300
Better for UPS and power quality applications
Investment cost per unit power (USD/kw)
1 000 3 000 10 000
Super
capacitors
Li-ion
Other advanced
batteries
NAS battery
Ni-Cd
Lead-acid
batteries
Metal-air
batteries
Flow batteries
Comp.
air
Pumped hydro
Figure 16.1 Capital cost of different storage options. ETP, 2008. p. 407 © OECD-IEA
10 kW1 kW
Seconds Minutes Hours
Discharge time
100 kW
System power ratings
1 MW 10 MW 100 MW
SMES
High
energy
fly wheel
Super capacitors
Lead-acid batteries
Ni-Cd
Li-ion
Other adv. batteries
NAS batteries
Flow batteries
Compressed air
Pumped hydro
Metal-air
batteries
Power quality UPS
Bridging power
Energy management
Figure 16.2 Discharge times and System ratings of different storage options. ETP, 2008. p. 408. ©
OECD-IEA
206 Green Energy Technology, Economics and Policy
Table 16.3 Cost comparisons of base-load supply systems
Investment Fuel Baseline CO
2
ACT Map BLUE Map
(USD/MW) (USD/kW/yr) (USD/yr) (t/yr) (USD/yr) (USD/yr)
3 wind turbines 4000 0 600 0 600 600
+ 2 CAES units
1 wind turbine 1500 229 454 2.0 503 848
+ 1 NGCC
1 NGCC 500 341 416 2.9 490 1005
Note: Assumes 33% availability of wind turbines, USD 1000/kW for wind turbines, USD 500/kW for CAES, 15%
annuity, USD 6.5/GJ gas.
Intermittent supplies, such as wind power, require storage arrangements to ensure
uninterrupted supply. Storage is not, however, the least cost option.
Table 16.3 gives cost comparisons of three base-load supply systems (ETP, 2008,
p. 410).
The high costs of transmission and distribution can be avoided through decentralized
power stations sited close to the demand centers. Small distributed generation units
are usually less efficient, and are characterized by higher investment costs per unit of
capacity. However, certain renewables (such as, PV, landfill gas, biomass residues) are
more suited to decentralized units.
Decentralized generation units are more suitable to places, such as, parts of India
and Africa, where grid does not exist or is unreliable. In general, such units are viable
in rural and remote areas. However, since it is projected that by 2050, 80% of the
world population will live in urban areas, the viability of decentralized power stations
will depend upon how they fit into the urban environment.
16.5 DEMAN D RESPONSE
Demand Response (DS) seeks to manage customer consumption of electricity in
response to the supply conditions (vide Wikipedia: Electricity Distribution). Demand
response serves to avoid outages and to help utilities manage daily system peaks. Cus-
tomarily, the capacity of the electrical systems are sized to correspond to peak demand.
So when the demand is less (as in the nights), it amounts to inefficient use of the
capital. If peak demand can be lowered through an intelligent management of demand,
it would lead to reduction in overall plant and capital cost requirements. Demand
response may also be used to increase demand (load) at times of high production and
low demand.
Demand Response is different from energy efficiency which means using less power
to perform a particular task, whenever that task is performed (in other words, there is
no time element built into it).
Most often, consumers pay for electricity tariff at a fixed rate per unit (kWh),
independent of the actual cost of production of electricity at the relevant time.
The tariff is fixed by the government or a regulator on a long-term basis. If con-
sumption is made sensitive to the cost of production in the short term, the consumers
Electricity systems 207
would (presumably) increase and decrease their use of electricity in reaction to price
signals. Since the consumers do not face actual market prices, they have little or no
incentive to reduce consumption (or defer consumption to later periods) as there is no
benefit to them for doing so.
Whereas nuclear power and thermal power are produced at a constant rate, irrespec-
tive the demand, there is intermittency associated with wind power (power is produced
when the wind blows), and solar power (which is produced only during day time when
the sun shines).
The value of one unit of energy depends upon when it is available, where it is avail-
able and how it is available. A unit of energy has more value if it can be made available
when needed by the consumer. Thus energy delivered at peak is more valuable than
energy delivered off-peak. Also, reductions in energy use are more valuable if they
occur at the time of the peak consumption. The capacity value of an energy system is
given by the energy that can be reliably delivered at the time of the peak consumption,
whereas the energy value of a system is the total amount of energy delivered over the
course of a year.
The system of payment to electricity producers is such that it encourages prior-
ity usage of lower-cost sources of generation (in terms of marginal cost). In systems
where market-based pricing is used, there can be considerable variation in pricing. For
example, in Ontario between August and September 2006, wholesale prices paid to
producers ranged from a peak of C$318 per MWh to a minimum of negative $C3.10
per MWh (consumers paying real-time pricing may have actually received a rebate for
consuming electricity during the latter period). Some times, prices may vary 2 to 5
times in a 24-hour period.
For instance, there is no rigid time when a clothes dryer should be switched on.
Using a demand response switch, it can be got switched on during off-peak time,
thereby reducing peak demand. As against this, air-conditioning has to be switched on
when it is hottest, namely, mid-noon. That is also the time when the solar PV produces
peak power.
When an intermittent renewable energy unit like a windmill is combined with a
peaking unit such as combustion turbine, and if an analysis of the hybrid system shows
it to be the most economic alternative, there is no difficulty in making the choice in
favour of the wind mill- turbine unit. Even if the turbine unit alone is found to be cost
effective, decision cannot be made in its favour. This is so because the government, as a
matter of policy in the context of climate change, is committed to easing out fossil fuel
energy generation and promoting renewable energy systems. The turbine unit should
therefore be considered as a “necessary evil’’ in order to make the windmill viable.
16.6 “SMA RT’’ GRID APPLICATION
“Smart’’ grid involves the delivery of electricity from the suppliers to the consumers
through the use of digital technology for controlling appliances in consumer’s home.
This saves energy, reduces the costs to the consumer, and improves reliability and
transparency. Fig. 16.3 depicts the general layout of the electricity systems and Fig. 16.4
shows the arrangement of grid.
Future electricity systems are likely to have large component of intermittent power
sources such as wind power and solar PV. Under these circumstances, smart grid would
208 Green Energy Technology, Economics and Policy
Solar farm
City network
substations
Low voltage
(50 kV)
Rural Network
factory
Industry power point
Distribution Grid
High voltage 110 kV and higher
Extra High Voltage
275 kV to 765 kV
(mostly AC, some HVDC)
Transmission Grid
Industrial customers
City
Power plant
~2 MW
~5 MW
~400 MW
Farm
up to
~150 MW
Medium sized
power plants
Nuclear plant
Coal plant
Wind farm
KEY:
Transformer
Extra high
high
Medium
Low voltage
~30 MW
~200 MW
~800 MW
800–1700 MW
Hydro-electric plant
~150 MW
Figure 16.3 General layout of electricity networks. Wikipedia – Electricity Distribution
be an effective way to manage the situation. For instance, in the case of a region heavily
dependent on wind power, there are two options for getting over the intermittency
problem. One is to build energy storage to deposit excess power. This is an expensive
option. A cheaper option will be to use the demand response approach. The excess
power instead of being stored, may be used to recharge vehicle batteries during times of
excess wind. When the wind dies down, the demand is shed by, say, delaying activation
of the refrigeration compressor, or hot water heater coils.
Electricity systems 209
Figure 16.4 Arrangement of grid
Source: Wikipedia – Electricity Distribution
P1
P2
P
S
D2
Q2 QQ1
D1
∆Q
∆P
Figure 16.5 Relationship between quantity and power
Source: Wikipedia – Electricity Distribution
16.6.1 Electricity Pricing
The relationship between Quantity and Power under conditions of elastic and inelastic
demand is depicted in Fig. 16.5 (source: Wikipedia; Fig. Courtesy: M.G. Tom, 2006).
If the demand is inelastic (curve D1), the price will be high (P1) and it may strain
the electricity market. If through the use of demand response measures, the demand
could be rendered elastic (curve D2), the price will be lower (P2). A small reduction in
quantity (Q) could result in a large reduction in price (P).
It has been found that during the peak hours of the California electricity crisis in
2000/2001, a 5% lowering of demand would result in reduction of the price by 50%.
This demonstrates the efficacy of demand response approach.
210 Green Energy Technology, Economics and Policy
Carnegie Mellon studies in 2006 found that even small shifts in peak demand would
result in large savings to the consumers, while avoiding costs for additional peak
capacity demonstrated the profound importance of the demand response in electrical
industry: a 1% shift in peak demand would result in savings of 3.9%, which would
be in billions of dollars at the system level. A 10% reduction in peak demand could
save USD 8 to 28 billion. For this reason, it is worthwhile to make a special effort to
improve the elasticity of demand of a system.
A study made by the Brattle Group (USA) in 2007 found that even a 5% drop in the
peak demand would bring about an annual savings of USD three billion, by eliminating
the need to install and operate 625 infrequently used peaking power plants and the
associated delivery infrastructure.
The Independent Electricity System in Ontario, Canada, was built for a peak demand
of 25 GW. A maximum demand of 27 GW occurred during only 32 system hours (i.e.
less than 0.4% of the time). Thus, by “shaving’’ the peak demand through appropriate
demand response measures, it was possible for the province to reduce the built capacity
by about 2000 MW.
16.6.2 Electricity grid and peak demand response
In an electricity grid, it is imperative that electricity production should keep pace with
consumption. If this condition is not ensured, there would be instability in the grid
with severe voltage fluctuations. Tripping may take place, and this could trigger a
chain reaction, with disastrous results.
Governments or electricity corporations optimise the operation of the electricity grid
through the following kind of strategy: (i) Total generation capacity is sized slightly in
excess of the total peak demand, to take care of unforeseen circumstances, (ii) Least
expensive generating capacity (in terms of marginal cost) (say, wind power) is used to
the maxiumum extent possible, with expensive source of power (say, nuclear power)
being used as demand increases, (iii) The goal of the demand response is to reduce
the peak demand in such a manner that there is no risk of voltage fluctuation, while
avoiding additional costs for additional plant and infrastructure, and making minimum
use of power from more expensive and/or less efficient plants.This will benefit the
consumers of electricity through lower prices.
Some types of generating plants, such as, nuclear power plants, must be run at full
capacity. Some times there may be enough demand for it. Demand response approach
can be used to increase the load during periods of high supply. Pumped (hydroelectric)
storage is an economical way to increase the load in order to make use of the excess
power. In the province of Ontario, Canada, in September 2006, there was a short
period of time when the prices were negative for some category of users, and they had
to be paid a rebate. Pumped storage was made use of to get over the problem. Use
of demand response to increase load is not common, but may some times has to be
resorted to when there is large generating capacity that cannot be cycled down.
In 2006, the province of Ontario, Canada, launched a “Smart Meter’’ programme
to bring the benefits of the demand response to the consumer using the TOU (Time-of-
Use) principle. This system has three tiers of pricing: on-peak, mid-peak and off-peak
schedules. During winter, on-peak refers to morning and early evening, mid-peak is
defined as mid-day to late-afternoon, and off-peak at night time. During the summer,
Electricity systems 211
the on-peak covers mid-day to late afternoon, as air conditioning drives the summer
demand. In 2007, prices during the on-peak were C$0.097/kWh, i.e. about three
times more expensive than off-peak (C$0.034 per kWh). Though the system has not
yet gotten into full use, Ontario plans to make TOU metering obligatory by 2010.
16.6.3 Incentives to shed loads
Demand Response incentives to shed loads may take many forms. A utility may pass
on to the customers tariff reductions in the price of electricity. During a heat wave,
a mandatory cutback may be imposed on high-volume users who are compensated
for their participation. Others may receive a rebate for reducing power consumption
during the periods of high demand.
Some businesses which have their own captive power stations, usually take steps to
stay within that capacity in order to avoid buying power from the grid. Some utilities
have framed their tariff structure such that the tariff that a customer has to pay is
calculated on the basis of the moment of highest use, i.e. peak demand, in a month.
This will serve as incentive to the customer to flatten their energy use, even if that may
mean cutting back service temporarily.
Some customers may not be in a position to reduce their demand, or the peak
prices may not be that high as to induce the customer to reduce the peak consumption.
Automated control systems do exist, but they may not be affordable to some categories
of customers.
16.6.4 Technologies for demand reduction
The process of demand response can be automated. Computer systems are available
to detect the need for loads shedding, inform the concerned unit how much load need
to be shed, implement the directive to shed the load, and communicate compliance to
the control unit. Companies such as Ziphany, LLC and Convia have developed the
necessary scalable and comprehensive solutions for the purpose.
Electricity demand of a given geographical unit depends upon the size of the pop-
ulation, their life-style, climate, agriculture, industry, tourism, etc. Also, it is highly
dependent upon the time of the day (e.g. the demand for air-conditioning is maxi-
mum at noontime).Under the provisions of “smart’’ grid, industrial, residential and
commercial users in an area are linked with various power generating units (thermal,
wind power, solar PV, nuclear power, etc.) in the area. When it becomes necessary to
reduce the peak demand in the area, the central control system may turn down the
temperature of heaters, or raise the temperature of some appliances (such as air condi-
tioners and refrigerators) in order to reduce their power consumption. This essentially
means delaying the draw marginally. Though the amount of demand involved in this
exercise is small, it will have significant financial impact on the system, as electricity
systems are sized to take care of extreme peak demands, though such events occur very
infrequently.
The city of Toronto is experimenting with a demand response programme (Peaksaver
AC) whereby the system operator can automatically regulate air conditioning during
the peak demand through allowing the peaking plants time to cycle up. This benefits
the grid, and the benefit is passed on to the consumer in the form of lower tariff.
212 Green Energy Technology, Economics and Policy
Bonneville Power experimented with such control technologies in residences in the
states of Washington and Oregon, and found that the avoided investment justifies
the cost of technology. REGEN Energy developed swarm-logic methods to coordinate
multiple loads in a facility. New models of appliances such as refrigerators and clothes
dryers are being fixed with sensing devices to respond to the directions of grid.
Thus, pricing can be used as an incentive to reduce the great variability in the con-
sumption of electricity in residential and commercial sectors. There are three guiding
principles in this regard:
(i) Every effort should be made to make efficient use of a production facility. If a
production facility is not used or used insufficiently, it will earn little revenue. It
would thus constitute waste of investment.
(ii) Electric systems are sized for peak loads with provision for unforeseen events.
(iii) If peak demand can be reduced by “smoothing’’, it would mean less investment
and more efficient use of generating facility, since significant peak events occur
rarely.
16.6.5 “Power Plant in a box’’
In San Jose, Calif., on Feb. 24, 2010 (WE), Indian American K.R. Sridhar launched
the “Bloom Box’’ which has the potential to revolutionise electricity production, just
as a cell phone did in the case of communications. The “Bloom Box’’ is a fuel-cell
device, consisting of a stack of ceramic disks with secret green and black “inks’’. These
disks are separated by cheap metal plates. The “Bloom Box’’ can covert air and nearly
any renewable and fossil fuel (e.g. natural gas, biogas, coal gas) into electricity by
electrochemical process. Since no combustion is involved, there will be no emissions,
sound or smell. Unlike solar or wind energy, which are intermittent, Bloom technology
would be able to provide electricity 24 × 7. The Bloom Energy Server, a smooth metal
box the size of a metal truck, can provide 100 kW of electricity, enough to power 100
American homes or 400 Indian homes. Sridhar says that by 2020, a Bloom Box of
1 kW capacity, costing about USD 3 000, would be available to provide clean, reliable
and affordable electricity to individual households.
REFERENCES
Berntsson, T., et al (2007) Swedish Pulp Mill Biorefineries: A Vision of Future possibilities.
Chalmers Univ. of Technology, Sweden.
Borlée, J. (2007) Low CO
2
Steels: ULCLOS Project. Paper presented at the IEA Workshop,
Deploying Demand Side Energy Technologies, 8–9 October. OECD-IEA, Paris.
Bowen, C.P. (2006) Development Trends in Ethylene Crackers: Existing Technologies and
RD&D. Paper presented in IEA/CEFIC Workshop, Feedstock substitutes: Energy Efficient
Technology and CO2 Reduction for Petrochemical Products. 12–13 December, OECD/IEA,
Paris.
Daggett, D. et al (2006) Alternative Fuels and their potential impact on aviation. NASA,
Hanover, M.D. />Electricity systems 213
Duleep, K.G. (2007) Fuel economy of heavy-duty trucks in the USA. Presented at
IEA Workshop on Fuel Efficiency Policies for Heavy Duty Vehicles, June 2007,
/>ENN (Environmental News Network) (2008) High Speed Rail Advances Globally, Crawls
in the US. Green Energy News, Feb. 11. v. 12, no.47. www.green-energy-news.com/arch/
nrgs2008/20080012.html.
European Commission (2001) Best Available Techniques in the Non-Ferrous Metal Industry.
IPPC (Integrated Pollution Prevention and Control), EC, Brussels.
European Commission (2007) Rail Transport and Interoperability. http//ec.europa.eu/transport/
rail/interoperability/tsi_revised_en_htm.
Fargione, J. et al (2008) Land Clearing and Biofuel Carbon Debt. Science, v. 319, no. 5867,
p. 1235–1238.
Florides, G.A. et al (2002) Measures used to Lower Building Energy Consumption and Their
Cost Effectiveness. Applied Energy, v.73, no.3, p. 299–328.
Hector, E., and T. Berntsson (2007) Reduction of greenhouse gases in Integrated Pulp and Paper
Mills: Possibilities for CO
2
capture. Chalmers University of Technology, Sweden.
ICAO (2004) Operational Opportunitiesto Minimize Fuel Use and Reduce Emissions. ICAO
Circular 303-AN/176, ICAO, February. Montreal, Quebec.
IEA (2008) Energy Technology Perspectives. Paris: OECD-IEA,
IEA (2009) Transport, Energy and CO
2
:Moving towards sustainability. Paris: OECD-IEA.
Jakob, M., and R. Madlener (2004) Riding Down the Experience Curve for Energy Efficient
Building Envelopes: the Swiss case for 1970–2020. International J. Energy Technology and
Policy, v. 2, nos. 1–2.
Karagozian, A. et al (2006) Report on the Technology Option for Improved Air Vehicle Fuel
Efficiency: Executive Summary and Annotated Brief. U.S. Air Force Scientific Advisory Board,
Washington, D.C.
Kieran, P. (2003) World Trends in Shipping and Port Reform. Port Reform Seminary, South
Africa. www.dpe.gov.za/res/peterKieranWorldTrendsinShippingand PortReform.pdf
McNeil, M. et al (2005) Potential Benefits from Improved Energy Efficiency of Key Electrical
Producys: The Case of India. LBNL, Berkeley, CA.
Passier,G. et al (2007) Status Overview of Hybrid and Electrical Vehicle Technol-
ogy, Final Report, Phase III, Annexe VII, Hybrid Vehicles.IEA Hybrid and Electrical
Implementing Agreement.OECD/IEA, Paris. www.ieahev.org/pdfs/annex_7/annex7_hev_Final
_rpt_110108. pdf.
Philibert. C. (2006) Barriers to Technology Diffusion: The Case for Solar Thermal Technolo-
gies.OECD/IEA, Paris.
Rudervaal, R. et al (2000) High Voltage Direct Current (HVDC) Transmission Systems,
Technology. Review Paper, Energy Week, 2000, Washington, D.C., Mar. 7–8, 2000,
www.worldbank.org/html/fpd/em/transmission/technology_abb.pdf
Sachs, H. et al (2004) Emerging energy-saving technologies and practices in the building sector.
ACEEE, Washington, D.C.
Seeline Group (2005) Technology Assessment Study and TRC Analysis. Seeline Group, Ontario
Power authority.
Shepard, S., and S. van der Linden (2001) Compressed Air Energy Storage Adapts Proven
Technology to Address Market opportunities. Power Engineering, Apr. 2001
Simpson,A. (2006) Cost-Benefit Analysis of Plug-in Hybrid Electric Vehicle Technology. Paper
presented in the 22nd. International Battery, Hybrid and Fuel Cell Electrical Vehicle Sym-
posium and Exhibition (EVS-22), Yokohoma, Japan. Oct. 23–29, 2006. Conference Paper
NREL/ CP-540-40485. www.nrel.gov/vehiclesandfuels/vsa/pdfs/40485.pdf.
SkySails (2006) SkySails – Turn Wind into Profit. Technology Information, Hamburg, Germany.
o/index.php?id=6&L=1.
214 Green Energy Technology, Economics and Policy
Srinivas, S. (2006) Green Buildings in India: Lessons Learnt. Indian Green Building Council,
Hyderabad.
Thijssen, G. (2002) Electricity Storage and Renewables. Electricity Storage Association (ESA),
Morgan Hill, CA, and Transmission and Distribution Counselling (KEMA), Arnhem,
Netherlands. www.electricitystorage.org/pubs/ 2002/Lisbon_May_2002_KEMA.pdf
Velduis, I.J.S., R.N. Richardson, and H.B.J. Stone (2007) Hydrogen Fuel in a Marine
Environment. Int. J. Hydrogen Energy, v. 32, no. 13.
Wikipedia – Elecricity Distribution.
World Aluminium (2007) Electrical Power Used in Primary Aluminium Production. Interna-
tional Aluminium Institute, London.
Yates, J.R, D. Perkins, and R. Sankarnarayanan (2004) Cemstar Process and Technology for low-
ering Greenhouse Gases and Other Emissions While Increasing Cement Production. Hatch,
Canada />20of%20Cemstar-Process-final-4-30-03.pdf
Section 5
Making green energy competitive
U. Aswathanarayana
Chapter 17
Roadmaps and phases of development
of low-carbon energy technologies
U. Aswathanarayana
17.1 W H Y LOW-CARBON ENERGY TECHNOLOGIES?
It is now generally accepted that if we are to escape the catastrophic consequences of
global warming, the world must restrict the total carbon emissions to 190 gigatonnes
(Gt = 10
9
t) by 2050. In 2008, the global carbon emissions were 9 Gt, and the rate
of carbon emission is increasing at the rate of 3% per annum. At this rate, the entire
carbon budget available to humankind will be reached in 1929 itself. Business-as-
usual is hence not a viable option. It is therefore critically important to bring down
carbon emissions. The global energy economy needs to be transformed profoundly in
the coming decades in terms of ways by which energy is supplied and used. This is
to be accomplished through greater energy efficiency, greater use of renewables and
nuclear power, CO
2
Capture and Storage (CCS) on a massive scale, and development
of carbon-free transport. Among these, improvement in energy efficiency is the least
expensive and most effective pathway.
The Developed countries which have 15% of the world’s population are responsible
for 50% of the CO
2
emissions (Table 17.1).
The CO
2
emissions of the top five emitters in 2005, 2015 and 2030 are given in
Table 17.2
Five countries (USA, China, Russia, Japan and India) currently account for 55%
of global energy-related CO
2
emissions. The same countries will remain the top CO
2
emitters in 2030, but their relative ranks will change. China has overtaken USA in
2007, and will continue to remain the top emitter. India’s rank will jump from fifth to
third rank in 2015, and will remain so in 2030.