Atomic Force Microscopy in Cell Biology Episode 1 Part 7 ppt
Bạn đang xem bản rút gọn của tài liệu. Xem và tải ngay bản đầy đủ của tài liệu tại đây (399.08 KB, 20 trang )
106 Martin Benoit
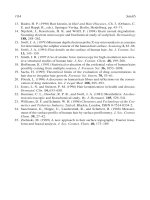
Fig. 9 Light microscopic image of a single cell on the sensor (cells on the surface are out of focus) and
schematics of a force experiment (Benoit et al., 2000).
interactions. Particularly in the last part of this deadhesion force trace the typical pattern
for tether formation appears (Hochmuth et al., 1996). Adhesion of the nondeveloped
cells used in this experiment is known to be Ca
2+
dependent (Beug, Katz, Stein, et al.,
1973). To test this Ca
2+
sensitivity, 5 mM EDTA, a chelating agent, was added to the
buffer. As illustrated (at the bottom of Fig. 10B) the adhesion is drastically reduced.
Within the duration of the experiments this low amount of EDTA did not affect the cells’
integrity. Since the cells tend to move on the surface of the dish it is necessary to check
the cell contact by the built-in light microscope and readjust the positioning of the cells.
After growth-phase cells were brought together by contact forces of 30–40 pN applied
for only 0.2 s, less than 20% of the de-adhesion traces showed binding between the cells
(Fig. 10A). The histogram of the deadhesion forces showed a broad distribution with
a maximum at about 50 pN. The low frequency of these de-adhesion events implies
that, based on Poisson statistics, more than 90% of the contacts should reflect single
binding events. Thus, the width of the force distribution most likely reflects a multitude
of molecular species involved in the Ca
2+
-dependent adhesion. In the presence of 5 mM
EDTA, 96% of the cells did not establish detectable adhesion within 0.2 s, even when
they were brought into contact with an increased force of 90 pN (Fig. 10B). On the basis
Fig. 10 Undeveloped cells lacking the CSA molecule express several Ca
2+
-dependent adhesion molecules (A+B). Experiments in PBS (A) result in a typical
rupture force spectrum derived from 5760 traces (inset) after contact for 0.2 s at 35 pN. Below: a representative trace from a prolonged contact for 20 s at 150 pN.
Experiments in 5 mM EDTA (B) result in a force spectrum with reduced adhesion (only 4%) from 960 traces (inset) even though there was an increased contact
force of 90 pN for 0.2 s. The prolonged contact for 20 s at 150 pN (below) does not show significant adhesion. Experiments in EDTA with developed cells (C) in
contrast show typical force spectra for the CSA molecule. For 0.2 s at 35 pN, one peak at 20 pN becomes prominent from 1334 traces (inset). After contact for1s,
the spectrum derived from 1088 traces (not shown) raises a second peak around 45 pN, and after 2 s, a third peak at 74 pN appears from 1792 traces (not shown)
(Benoit et al., 2000).
108 Martin Benoit
of these data, de-adhesion forces were measured in developing cells in which additional
cell adhesion proteins are expressed. Cells in the aggregation stage are distinguished
from growth-phase cells by EDTA-stable cell adhesion (Beug, Katz, and Gerish, 1973).
When 5 mM EDTA was added to these cells and de-adhesion forces were determined
after a contact force of 35 ± 5 pN, binding was observed in roughly half of the traces.
The collection of traces shown in Fig. 10C illustrates the type of results obtained at
various contact times. Often initial forces rose up to several hundred piconewtons, and
unbinding occurred in several steps until the last tether connecting the two cells was
disrupted at long contacts. In contrast to these multiple de-adhesion events, single steps
of deadhesion prevailed after a contact time of 0.2 s.
The last force step, the one that completely separated the cells, was measured in more
than 1000 traces after contact times of 2, 1, or 0.2 s (Fig. 10C). When these data were
compiled in histograms, a pronounced peak indicating a force quantum of 21 ± 5pN
became apparent. Upon increasing of contact times from 0.2 sec to 2 sec, this peak only
negligibly shifted to higher de-adhesion forces (23 pN). The main difference between
the histograms resided in the lower contribution of higher forces upon the reduction of
contact time. The higher forces contributing to de-adhesion after 2 or1sofcell-to-cell
contact are interpreted as superimposed multiples of a basic force quantum of 23 pN.
Developmental regulation and EDTA resistance suggest that the measured force quan-
tum of 23 pN is due to the unbinding of csA molecules. However, cells in the aggregation
stage differ from growth-phase cells not only in the csA protein but also in several other
developmentally regulated cell surface proteins. Therefore, to attribute the peak of 23 pN
to the presence of this particular cell adhesion protein, different types of cells in which
specifically csA expression was genetically manipulated were employed (Benoit et al.,
2000). The csA gene was selectively inactivated by targeted disruption using a transfor-
mation vector that recombined into the gene’s coding region (Faix et al., 1992). Only
25% of the cells in this csA knock-out strain showed measurable de-adhesion forces
as compared to 86% of wild-type cells. Also, cells of a mutant unable to produce csA
(Harloff et al., 1989) were transfected with vectors that encode the csA protein under
the control of the original promoter. Indeed these “repaired” cells showed adhesion like
the wild-type only when developed. Together these results demonstrate that the csA
molecule is the primary source of the intercellular adhesion measured by force spec-
troscopy in the presence of EDTA.
3. Dicussion
The quantized de-adhesion force of 23 pN indicates discrete molecular entities as
the unit of csA-mediated cell adhesion. The most likely interpretation of this peak is
that one unit reflects the interaction of two csA molecules, one on each cell surface.
Nevertheless, since oligomerization may strongly increase the affinity of cell adhesion
molecules (Tomschy et al., 1996), we cannot exclude the possibility that defined dimers
or oligomers represent the functional unit of csA interactions (Baumgartner et al., 2000;
Chen and Moy, 2000).
5. Cell Adhesion Measured by Force Spectroscopy 109
The measured de-adhesion force of 23 pN for csA is small compared to that of most
antibody–antigen or lectin–sugar interactions, which frequently exceeds 50 pN at com-
parable rupture rates (Dettmann et al., 2000). These moderate intermolecular forces
involved in cell adhesion are consistent with the ability of motile cells to glide against
each other as they become integrated into a multicellular structure. Moreover, in view of
the limited force that the lipid anchor may withstand, much higher molecular unbinding
forces would be of no advantage.
Here theseparation ratewas kept constant at 2.5 μm/s, resultingin forceramps between
100 and 500 pN/s depending on the elasticity of the cells. This rate is on the same order
as the protrusion and retraction rates of filopods, the fastest cell surface extensions in
Dictyostelium cells. With their adhesive ends, the filopods can act as tethers between cells
or between cells and other surfaces. Our measurements of separation forces are therefore
representative of upper limits to which the cells are exposed by their own motility.
IV. Cell Culture
A. HEC/RL Cell Culture on Coverslips
Measurements on human endometrial cell lines, purchased from the American Type
Culture Collection (ATCC, Rockville, MD/USA), i.e., HEC-1-A (short HEC; HTB 112;
(Kuramoto et al., 1972)) and RL95-2 (short RL; CRL 1671 (Way et al., 1983)), were
performed in JAR medium at 36
◦
C and 5% CO
2
. For routine culture, cell lines were
grown in plastic flasks in 5% CO
2
–95% air at 37
◦
C.
In brief, HEC cells were seeded out in McCoy’s 5A medium (Gibco-Life Technology,
Eggenstein, Germany) supplemented with 10% fetal calf serum (Gibco); RL cells, in a
1 + 1 mixture of Dulbecco’s modification of Eagle’s medium and Ham’s F12 (Gibco)
supplemented with 10% fetal calf serum, 10 mM Hepes (Gibco), and 0.5 μg/ml in-
sulin (Gibco). All media were additionally supplemented with penicillin (100 IU/ml;
Gibco) and Streptomycin (100 μg/ml; Gibco). The growth medium was changed
every 2 to 3 days, and cells were subcultured by trypsinization (trypsin–EDTA solution;
Gibco) when they became confluent. For experiments, cells were harvested by trypsiniza-
tion from confluent cultures, counted, and adjusted to the desired concentration, i.e.,
RL95-2 700,000 cells and HEC-1-A 200,000 cells each in 2.0 ml of their respective
culture medium (Fig. 2A and 2B). Subsequently, suspended cells were poured out on
poly-
D-lysine-coated glass coverslips (12 mm in diameter) situated in 4 cm
2
wells. Cells
were grown in medium to confluent monolayers and transferred into a Petri dish before
used for experiments.
B. JAR Cell Culture on Cantilever
Cantilevers mounted withsephacryl microspheres, as described earlier, wereimmersed
in 0.01% poly-
D-lysine for1hatroom temperature, washed in medium several times,
110 Martin Benoit
and subsequently incubated with a human JAR choriocarcinoma cell suspension (ATCC:
HTB 144 (Patillo et al., 1971)) (200,000 cells/ml RPMI 1640 medium, Gibco, supple-
mented with 10% fetal calf serum and 0.1% glutamine). After JAR cells had settled,
these cantilever–cell combinations were incubated in 5% CO
2
–95% air at 37
◦
C. Usually
3 to 4 days after the start of the cultures, cells were grown to confluency and cantilevers
were ready to be used for the experiments.
C. Dictyostelium Cell Culture
All mutants were derived from the D. discoideum AX2-214 strain, here designated
as wild-type. Mutant HG1287 was generated by E. Wallraff (Beug, Katz, and Gerish,
1973). In mutant HG1287, csA expression was eliminated by a combination of chemical
and UV mutagenesis. In this mutant not only the csA gene but also other genes may
have been inactivated by this shot-gun type of mutagenesis. Cells were cultivated in
nutrient medium as described (Malchow et al., 1972) in Petri dishes up to a density
of 1 × 10
6
cells/ml. For transformants HTC1 (Barth et al., 1994), CPH (Beug, Katz,
and Gerish, 1973), and T10 (Faix et al., 1992), 20 μg/ml of the selection marker G418
was added to stabilize csA expression. Before measurements were taken, cells were
washed and resuspended in 17 mM K/Na buffer, pH 6.0, and used either immediately
as undeveloped cells or after shaking for about6hat150rpmasdeveloped cells. The
temperature was about 20
◦
C. For the measurement, cells were suspended in 17 mM K/Na
phosphate buffer, pH 6.0, and spread on polystyrene Petri dishes, 3.5 cm in diameter,
at a density of about 100 cells/mm
2
. To chelate Ca
2+
,5mM ethylendiaminotetraacetic
acid (EDTA) was added at pH 6.0 in the same buffer. To avoid laser beam scattering of
the detection system, nonadherent cells were removed by gently rinsing the dish after
10 min.
V. Final Remarks
The two concepts of either monolayer interactions or single-cell interactions illumi-
nate complementary aspects of the complex cellular adhesion mechanisms. By reduc-
ing the complexity, as in the case of measurements between individual Dictyostelium
cells, processes on the single molecular level are resolved. And the principle of gain-
ing adhesion strength by oligomerization of molecular binding partners can be assumed
from these measurements. Insights into the complexity of molecular arrangements, dur-
ing cell adhesion processes, become possible by the measurements between interacting
monolayers.
Bond rupture experiments are performed under nonequilibrium conditions, thus the
measured forces are rate dependent. As shown by several groups (Grubm¨uller et al.,
1995; Merkel et al., 1999; Rief et al., 1998), this rate dependence may reveal additional
information on the binding potential. For living cells this detailed analysis will be im-
portant to relate cell adhesion to the rate of cell movement or shear forces in the blood
stream (Chen and Springer, 1999).
5. Cell Adhesion Measured by Force Spectroscopy 111
The combination of nanophysics with cell biology establishes a mechanical assay
that relates qualitatively cooperative molecular processes during contact formation, or
even quantitatively the expression of a gene, to the function of its product in cell ad-
hesion. This type of single-molecule force spectroscopy on live cells is directly appli-
cable to a variety of different cell adhesion systems. A wide field of applications of
this cell-based molecular assay is predictable, for instance, in investigating mutated cell
adhesion proteins or coupling of cell adhesion molecules to the cytoskeleton and also
in the evaluation of adhesion-blocking drugs. Furthermore, not only initial steps in the
receptor-mediated adhesion of particles to phagocyte surfaces but also interaction of
cells with natural and artificial surfaces of medical interest can be measured with this
technique.
Acknowledgments
This work became possible only through collaborations with M. Thie, R. R¨ospel, B. Maranca-Nowak, and
U. Trottenberg at the Uni-Klinikum Essen in H W. Denker’s institute; D. Gabriel, E. Simmeth, and M. Westphal
at the MPI-Martinsried in G. Gerisch’s institute; M. Grandbois at the University of Missouri-Columbia; and
W. Dettmann, A. Wehle, and A. Kardinal in the LMU M¨unchen at H. E. Gaub’s institute. We are also grateful
to the Deutsche Forschungsgemeinschaft and the Volkswagenstiftung for funding.
References
Albers, A., Thie, M., Hohn, H P., and Denker, H W. (1995). Differential expression and localization of
integrins and CD44 in the membrane domains of human uterine epithelial cells during the menstrual cycle.
Acta Anatom. 153, 12–19.
Barth, A., M¨uller-Taubenberger, A., Taranto, P., and Gerisch, G. (1994). Replacement of the phospholipid-
anchor in the contact site A glycoprotein of Dictyostelium discoideum by a transmembrane region does not
impede cell adhesion but reduces residence time on the cell surface. J. Cell Biol. 124, 205–215.
Baumgartner, W., Hinterdorfer, P., Ness, W., Raab, A., Vestweber, D., Schindler, H., and Drenckhahn, D.
(2000). Cadherin interaction probed by atomic force microscopy. PNAS 97, 4005–4010.
Benoit, M., Gabriel, D., Gerisch, G., and Gaub, H. E. (2000). Discrete molecular interactions in cell adhesion
measured by force spectroscopy. Nature Cell Biol. 2, 313–317.
Beug, H., Katz, F. E., and Gerisch, G. (1973). Dynamics of antigenic membrane sites relating to cell aggregation
in Dictyostelium discoideum. J. Cell Biol. 56, 647–688.
Beug, H., Katz, F. E., Stein, A., and Gerisch, G. (1973). Quantitation of membrane sites in aggregating
Dictyostelium cells by use of tritiated univalent antibody. Proc. Natl. Acad. Sci. U.S.A. 70, 3150–3154.
Binnig, G., Quate, C. F., and Gerber, C. (1986). Atomic force microscope. Phys. Rev. Lett. 56, 930–933.
Bruinsma, R., Behrisch, A., and Sackmann, E. (2000). Adhesive switching of membranes: Experiment and
theory. Phys. Rev. E. 61, 4253–4267.
Chen, A., and Moy, V. T. (2000). Cross-linking of cell surface receptors enhances cooperativity of molecular
adhesion. Biophys. J. 78, 2814 –2833.
Chen, S., and Springer, T. A. (1999). An automatic breaking system that stabilizes leukocyte rolling by an
increase in selectin bond number with shear. J. Cell Biol. 144, 185–200.
Choquet, D., Felsenfeld, D. P., and Sheetz, M. P. (1997). Extracellular matrix rigidity causes strengthening of
integrin-cytoskeleton linkages. Cell 88, 39–48.
Curtis, A. S. G. (1970). Problems and some solutions in the study of cellular aggregation. Symp. Zool. Soc.
London 25, 335–352.
Dai, J., and Sheetz, M. P. (1998). Cell membrane mechanics. In “Methods Cell Biology,” (M. P. Sheetz, ed.),
Vol. 55, pp. 157–171. Academic Press, San Diego.
112 Martin Benoit
Denker, H W. (1994). Endometrial receptivity: cell biological aspects of an unusual epithelium. Ann. Anat.
176, 53–60.
Dettmann, W., Grandbois, M., Andr`e, S., Benoit, M., Wehle, A. K., Kaltner, H., Gabius, H J., and Gaub, H. E.
(2000). Differences in zero-force and force-driven kinetics of ligand dissociation from β-galactoside-specific
proteins (plant and animal lectins, immunoglobulin G) monitored by plasmon resonance and dynamic single
molecule force microscopy. Arch. Biochem. Biophys. 383, 157–170.
Domke, J., Dann¨ohl, S., Parak, W. J., M¨uller, O., Aicher, W. K., and Radmacher, M. (2000). Substrate
Dependent Differences in Morphology and Elasticity of Living Osteoblasts Investigated by Atomic Force
Microscopy. Colloids Surf. B Biointerfaces, 19, 367–379.
Evans, E. A. (1985). Detailed mechanics of membrane-membrane adhesion and separation II. Discrete kineti-
cally trapped molecular cross-bridges. Biophys. J. 48, 185–192.
Evans, E. (1995). Physical Actions in Biological Adhesion. In “Handbook of Biological Physics,” (R.a.S., E.
Lipowsky, ed.), Vol. 1B, pp. 723–754. Elsevier Science Amsterdam.
Evans, E., and Ritchie, K. (1997). Dynamic strength of molecular adhesion bonds. Biophys. J. 72, 1541–
1555.
Faix, J. (1999). Contact site A. In Guidebook to the Extracellular Matrix, Anchor, and Adhesion Proteins
(T.K.a.R. Vale, ed.), Oxford Univ. Press, London.
Faix, J., Gerisch, G., and Noegel, A. A. (1992). Overexpression of the csA cell adhesion molecule under its
own cAMP-regulated promoter impairs morphogenesis in Dictyostelium. J. Cell Sci. 102, 203–214.
Felsenfeld, D. P., Choquet, D., and Sheetz, M. P. (1996). Ligand binding regulates the directed movement of
betal integrins on fibroblasts. Nature 383, 438–440.
Florin, E L., Moy, V. T., and Gaub, H. E. (1994). Adhesive forces between individual ligand-receptor pairs.
Science 264, 415–417.
Fritz, M., Radmacher, M., and Gaub, H. E. (1993). In vitro activation of human platelets triggered and probed
by SFM. Exp. Cell Res. 205(1), 187–190.
Gimzewski, J. K., and Joachim, C. (1999). Nanoscale science of single molecules using local probes. Science
283, 1683–1688.
Goldmann, W. H., Galneder, R., Ludwig, M., Kromm, A., and Ezzell, R. (1998). Differences in F9 and 5.51
cell elasticity determined by cell poking and atomic force microscopy. FEBS Lett. 424, 139–142.
Grandbois, M., Beyer, M., Rief, M., Clausen-Schaumann, H., and Gaub, H. E. (1999). How strong is a covalent
bond? Science 283, 1727–1730.
Grandbois, M., Dettmann, W., Benoit, M., and Gaub, H. E. (2000). Affinity imaging of red blood cells using
an atomic force microscope. J. Histochem. Cytochem. 48, 719–724.
Grubm¨uller, H., Heymann, B., and Tavan, P. (1995). Ligand binding: molecular mechanics calculation of the
streptavidin-biotin rupture force. Science 271, 997–999.
Harloff, C., Gerisch, G., and Noegel, A. A. (1989). Selective elimination of the contact site A protein of
Dictyostelium discoideum by gene disruption. Genes Dev. 3, 2011–2019.
Hinterdorfer, P., Baumgartner, W., Gruber, H. J., Schilcher, K., and Schindler, H. (1996). Detection and
localization of individual antibody-antigen recognition events by atomic force microscopy. Proc. Natl.
Acad. Sci. U.S.A. 93, 3477–3481.
Hochmuth, R. M., Shao, J Y., Dai, J., and Sheetz, M. P. (1996). Deformation and flow of membrane into
tethers extracted from neuronal growth cones.
Biophys. J. 70, 358–369.
Hoh, J. H., and Schoenenberger, C A. (1994). Surface morphology and mechanical properties of MDCK
monolayers by atomic force microscopy. J. Cell Sci. 107, 1105–1114.
Holmberg, M., Wigren, R., Erlandsson, R., and Claesson, P. M. (1997). Interactions between cellulose and
colloidal silica in the presence of polyelectrolytes. Colloids Surf. A Physicochem. Eng. Aspects 129–130,
175–183.
John, N., Linke, M., and Denker, H W. (1993). Quantitation of human choriocarcinoma spheroid attachment
to uterine epithelial cell monolayers. In Vitro Cell. Dev. Biol. 29A, 461–468.
Johnsson, B., L¨ofas, S., and Lindquist, G. (1991). Immobilization of proteins to a carboxymethyldextran-
modified gold surface for biospecific interaction analysis in surface plasmon resonance sensors. Anal.
Biochem. 198, 268–277.
5. Cell Adhesion Measured by Force Spectroscopy 113
Kamboj, R. K., Wong, L. M., Lam, T. Y., and Siu, C H. (1988). Mapping of a cell-binding domain in the cell
adhesion molecule gp80 of Dictyostelium discoideum. J. Cell Biol. 107, 1835–1843.
Kreis, T., and Vale, R. (eds.) (1999). “Guidebook to the Extracellular Matrix, Anchor, and Adhesion Proteins.”
Oxford Univ. Press, London.
Kuo, S. C., Hammer, D. A., and Lauffenburger, D. A. (1997). Simulation of detachment of specifically bound
particles from surfaces by shear flow. Biophys. J. 73, 517–531.
Kuramoto, H., Tamura, S., and Notake, Y. (1972). Establishment of a cell line of human endometrial adeno-
carcinoma in vitro. Am. J. Obstet. Gynecol. 114, 1012–1019.
Malchow, D., N¨agele, B., Schwarz, H., and Gerisch, G. (1972). Membrane-bound cyclic AMP phosphodi-
esterase in chemotactically responding cells of Dictyostelium discoideum. Eur. J. Biochem. Eur. J. Biochem.
28, 136–142.
Marszalek, P. E., Pang, Y. P., Li, H., Yazal, Y. E., Oberhauser, A. F., and Fernandez, J. M. (1999). Atomic
levers control pyranose ring conformations. Proc. Natl. Acad. Sci. U.S.A. 96.
Merkel, R., Nassoy, P., Leung, A., Ritchie, K., and Evans, E. (1999). Energy landscapes of receptor-ligand
bonds explored with dynamic force spectroscopy. Nature 397, 50–53.
M¨uller, K. M., Arndt, K. M., and Pl¨uckthun, A. (1988). Model and simulation of multivalent binding to fixed
ligands. Anal. Biochem. 261, 149–158.
M¨uller, D. J., Baumeister, W., and Engel, A. (1999). Controlled unzipping of a bacterial surface layer with an
AFM, Nov 9:96 (23), p. 13170–13174. PNAS.
Murray, B. A., Yee, L. D., and Loomis, W. F. (1981). Immunological analysis of glycoprotein (contact
sites A) involved in intercellular adhesion of Dictyostelium discoideum. J. Supramol. Struct. Cell. Biochem.
17, 197–211.
Oberhauser, A. F., Marszalek, P. E., Erickson, H. P., and Fernandez, J. M. (1998). The molecular elasticity of
the extracellular matrix protein tenascin. Nature 393, 181–185.
Oesterhelt, F., Oesterhelt, D., Pfeiffer, M., Engel, A., Gaub, H. E., and M¨uller, D. J. (2000). Unfolding pathways
of individual Bacteriorhodopsins. Science 288, 143–146.
Patillo, R. A., Ruckert, A., Hussa, R., Bernstein, R., and Delfs, E. (1971). The JAR cell line—Contiuous human
multihormone production and controls. In Vitro 6, 398.
Ponte, E., Bracco, E., Faix, J., and Bozzaro, S. (1998). Detection of subtle phenotypes: The case of the cell
adhesion molecule csA in Dictyostelium. Proc. Natl. Acad. Sci. U.S.A. 95, 9360–9365.
Radmacher, M. (1997). Measuring the elastic properties of biological samples with the atomic force mi-
croscopy. IEEE Eng. Med. Biol. 16.
Radmacher, M., Fritz, M., Kacher, C. M., Cleveland, J. P., and Hansma, P. K. (1996). Measuring the visco-
elastic properties of human platelets with the atomic force microscope. Biophys. J. 70, 556–567.
Razatos, A., Ong, Y L., Sharma, M. M., and Georgiou, G. (1998). Molecular determinats of bacterial adhesion
monitored by AFM. PNAS 95, 11,059–11,064.
Rief, M., Clausen-Schaumann, H., and Gaub, H. E. (1999). Sequence dependent mechanics of single DNA-
molecules. Nature Struct. Biol. 6, 346–349.
Rief, M., Fernandez, J. M., and Gaub, H. E. (1998). Elastically coupled two-level systems as a model for
biopolymer extensibility. Phys. Rev. Lett. 81, 4764–4767.
Rief, M., Gautel, M., Oesterhelt, F., Fernandez, J. M., and Gaub, H. E. (1997). Reversible unfolding of
individual titin Ig-domains by AFM. Science 276, 1109–1112.
Rief, M., Oesterhelt, F., Heymann, B., and Gaub, H. E. (1997). Single molecule force spectroscopy on polysac-
charides by AFM. Science 275, 1295–1298.
Sagvolden, G., Giaver, I., Pettersen, E. O., and Feder, J. (1999). Cell adhesion force microscopy. Proc. Natl.
Acad. Sci. U.S.A. 96, 471–475.
Smith, B. L., Sch¨affer, T. E., Viani, M., Thompson, J. B., Frederick, N. A., Kindt, J., Belcher, A., Stucky,
G. D., Morse, D. E., and Hansma, P. K. (1999). Molecular mechanistic origin of the toughness of natural
adhesives, fibres and composites. Nature 399, 761–763.
Springer, T. A. (1990). Adhesion receptors of the immune system. Nature 346, 425–434.
Stadler, J., Keenan, T. G., Bauer, G., and Gerisch, G. (1989). The contact site A glycoprotein of Dictyostelium
discoideum carries a phospholipid anchor of a novel type. EMBO J. 8, 371–377.
114 Martin Benoit
Strunz, T., Oroszlan, K., Sch¨afer, R., and G¨untherodt, H J. (1999). Dynamic force spectroscopy of single
DNA molecules. Proc. Natl. Acad. Sci. U.S.A. 96, 11,277–11,282.
Suter, C. M., Errante, L. E., Belotserkovsky, V., and Forscher, P. (1998). The Ig superfamily cell adhesion
molecule, apCAM, mediates growth cone steering by substrate-cytoskeletal coupling. J. Cell Biol. 141,
227–240.
Thie, M., Fuchs, P., Butz, S., Sieckmann, F., Hosch¨utzky, H., Kemler, R., and Denker, H W. (1996). Adhe-
siveness of the apical surface of uterine epithelial cells: The role of junctional complex integrity. Eur. J. Cell
Biol. 70, 221–232.
Thie, M., Harrach-Ruprecht, B., Sauer, H., Fuchs, P., Albers, A., and Denker, H W. (1995). Cell adhesion to
the apical pole of epithelium: a function of cell polarity. Eur. J. Cell Biol. 66, 180–191.
Thie, M., Herter, P., Pommerenke, H., D¨urr, F., Sieckmann, F., Nebe, B., Rychly, J., and Denker, H W. (1997).
Adhesiveness of the free surface of a human endometrial monolayer as related to actin cytoskeleton. Mol.
Hum. Reprod. 3, 275–283.
Thie, M., R¨ospel, R., Dettmann, W., Benoit, M., Ludwig, M., Gaub, H. E., and Denker, H W. (1998). Inter-
actions between trophoblast and uterine epithelium: Monitoring of adhesive forces. Hum. Reprod. 13, 3211–
3219.
Tomschy, A., Fauser, C., Landwehr, R., and Engel, J. (1996). Homophilic adhesion of E-cadherin occurs by
a co-operative two-step interaction of N-terminal domains. EMBO J. 15, 3507–3514.
Vestweber, D., and Blanks, J. E. (1999). Mechanisms that regulate the function of the selectins and their
ligands. Physiological Rev. 79, 181–213.
Ward, M. D., Dembo, M., and Hammer, D. A. (1994). Kinetics of cell detachment: Peeling of discrete receptor
clusters. Biophys. J. 67, 2522–2534.
Ward, M. D., and Hammer, D. A. (1993). A theoretical analysis for the effect of focal contact formation on
cell-substrate attachment strength. Biophys. J. 64, 936–959.
Way, D. L., Grosso, D. S., Davis, J. R., Surwit, E. A., and Christian, C. D. (1983). Characterization of a new
human endometrial carcinoma (RL95-2) established in tissue culture. In Vitro 19, 147–158.
Willemsen, O. H., Snel, M. M. E., van der Werf, K. O., de Grooth, B. G., Greve, J., Hinterdorfer, P., Gruber,
H. J., Schindler, H., van Kooyk, Y., and Figdor, C. G. (1998). Simultaneous height and adhesion imaging
of antibody-antigen interactions by atomic force microscopy. Biophys. J. 75, 2220–2228.
Yauch, R. L., Felsenfeld, D. P., Kraeft, S K., Chen, L. B., Sheetz, M. P., and Hemler, M. E. (1997). Mutational
evidence for control of cell adhesion through integrin diffusion/clustering, independent of ligand binding.
J. Exp. Med. 186, 1347–1355.
Zahalak, G. I., McConnaughey, W. B., and Elson, E. L. (1990). Determination of cellular mechanical properties
by cell poking, with an application to leukocytes. J. Biomech. Eng. 112, 283–294.
CHAPTER 6
Molecular Recognition Studies
Using the Atomic Force Microscope
Peter Hinterdorfer
Institute for Biophysics
University of Linz
A-4040 Linz, Austria
I. Introduction
II. Experimental Approach
A. Surface Chemistry
B. Unbinding Force Measurements
III. Dynamic Force Spectroscopy
A. Principles
B. Applications to Cellular Proteins
IV. Recognition Imaging
A. Lateral Force Mapping
B. Dynamic Recognition Force Microscopy
References
I. Introduction
The potential of the atomic force microscope (AFM) (Binnig et al., 1986) to measure
ultralow forces at high lateral resolution has paved the way for molecular recognition
studies. The AFM offers particular advantages in biology: measurements can be carried
out in both aqueous and physiological environments, and the dynamics of biological
processes in vivo can be studied. Since structure–function relationships play a key role
in bioscience, their simultaneous detection is a promising approach to yielding novel
insights into the regulation of cellular and other biological mechanisms. Ligand binding
to receptors is one of the most important regulatory elements since it is often the initiating
step in reaction pathways and cascades.
METHODS IN CELL BIOLOGY, VOL. 68
Copyright 2002, Elsevier Science (USA). All rights reserved.
0091-679X/02 $35.00
115
116 Peter Hinterdorfer
Molecular recognition studies provide insight into both detecting specific ligand–
receptor interaction forces on the single molecule level and observing molecular recog-
nition of a single ligand–receptor pair. Applications include biotin–avidin (Lee, Kidwell
et al., 1994; Florin et al., 1994; Wong et al., 1998), antibody–antigen (Hinterdorfer et al.,
1996, 1998; Dammer et al., 1996; Allen et al., 1997; Willemsen et al., 1998; Ros et al.,
1998), sense–antisense DNA (Lee, Chrisey et al., 1994; Boland and Ratner, 1995; Strunz
et al., 1999), nitrilotriacetate–histidine 6 (NTA–His
6
) (Conti et al., 2000; Kienberger,
Kada et al., 2000; Schmitt et al., 2000), and cellular proteins, either isolated (Dammer
et al., 1996; Fritz et al., 1998; Baumgartner, Hinterdorfer, Ness et al., 2000) or in cell
membranes (Lehenkari and Horton, 1999; Chen and Moy, 2000; Wielert-Badt et al.,
2000). The general strategy is to bind ligands to AFM tips and receptors to probe sur-
faces (or vice versa), respectively. In a force–distance cycle, the tip is first approached to
the surface whereupon receptor–ligand complexes are formed, due to the specific ligand–
receptor recognition. During subsequent tip–surface retraction a temporarily increasing
force is applied to the ligand–receptor connection until the interaction bond breaks at a
critical force (unbinding force).
Such experiments allow for estimation of affinity, rate constants, and structural data
of the binding pocket (Hinterdorfer et al., 1996, 1998; Baumgartner, Hinterdorfer, Ness
et al., 2000; Kienberger, Kada, Gruber et al., 2000), and comparing these values with
those obtained from ensemble-average techniques and binding energies (Moy et al., 1994;
Chilkoti et al., 1995) is of particular interest. Several years ago, theoretical findings deter-
mined that the unbinding force was dependent on the rate of increasing force (Grubm¨uller
et al., 1996; Evans and Ritchie, 1997; Izraelev et al., 1997) during force–distance cycles.
Recent experimental studies confirmed the theoretical findings and revealed a logarith-
mic dependence of the unbinding force on the loading rate (Merkel et al., 1999; Struntz
et al., 1999; Baumgartner, Hinterdorfer, Ness et al., 2000; Kienberger, Kada et al., 2000).
These force spectroscopy experiments provide insight into the molecular dynamics of the
receptor–ligand recognition process (Baumgartner, Hinterdorfer, Ness et al., 2000) and
even render mapping of the interaction potential possible (Markel et al., 1999). Similar
experimental strategies were used for studying the elastic properties of polymers by ap-
plying external forces (Rief, Oesterhelt et al., 1997; Marzsalek et al., 1998; Oesterhelt
et al., 1999; Kienberger, Patushenko et al., 2000) and investigating unfolding–refolding
kinetics of filamentous proteins in pull–hold–release cycles (Rief, Gautel et al., 1997;
Oberhauser et al., 1998).
Aside from the study of ligand–receptor recognition processes, the localization of
receptor binding sites by molecular recognition of a ligand is of particular interest.
Simultaneous information for topography and ligand–receptor interaction is obtained
by lateral force mapping (Ludwig et al., 1997; Willemsen et al., 1998). Recognition
imaging, developed by combing dynamic force microscopy (Han et al., 1996, 1997)
with force spectroscopy, allows for the determination of receptor sites with nanometer
positional accuracy (Raab et al.,1999). This presents new perspectives for nanometer-
scale epitope mapping of biomolecules and localizing receptor sites during biological or
cellular processes.
In this chapter, the principles of force spectroscopy and recognition imaging are de-
scribed. Several protocols for anchoring ligands to tips and receptors to probe surfaces are
6. Molecular Recognition Studies 117
given. Applications of these methodologies to cellular proteins, i.e., (i) the vascular endo-
thelian cadherin, a cell–cell adhesion protein, and (ii) the Na
+
/D-glucose cotransporter,
a nutrient transporting transporter protein, show the potential of molecular recognition
force spectroscopy/microscopy in cell biology.
II. Experimental Approach
A. Surface Chemistry
1. Preparation of AFM Tips
The detection of unconstrained ligand–receptor recognition requires a particular link-
age design (Hinterdorfer et al., 1996, 1998; Raab et al., 1999; Kienberger, Pastushenko
et al., 2000). Covalently coupling the ligand to the tip surface guarantees a sufficiently
tight attachment because covalent bonds are about 10 times stronger than typical ligand–
receptor bonds (Grandbois et al., 1999). Additionally, the ligand is to be provided with
maximal motional freedom around the tip, so that the recognition process is not influ-
enced by steric restrictions. Therefore, we developed a strategy for the covalent anchoring
of ligands to silicon (Si
3
N
4
or SiOH) tips via a flexible crosslinker that enables the li-
gand to move and orient freely about the tip and lacks unspecific tip–probe adhesion. It
also makes site-directed coupling for a defined orientation of the ligand relative to the
receptor possible.
As a crosslinking element, we used poly(ethylene glycol) (PEG), a water–soluble
nontoxic polymer with a wide range of applications in surface technology and clinical
research. PEG is known to prevent surface adsorption of proteins and lipid structures
and appeared therefore ideally suited to our purpose. The flexible crosslinker was syn-
thesized in our lab (Haselgr¨ubler et al., 1995) and consisted of a PEG chain of 24 units,
corresponding to about an 8-nm extended length. The extension of the crosslinker is
comparable to the size of antibodies, which were the most frequently used ligands in
our group, and therefore represents a compromise between a sufficient spacing of the
ligands from the tip surface and a high lateral and vertical resolution. The crosslinker is
heterobifunctional, for the coupling to both the tip surface and the ligands, respectively.
An N-hydroxysuccinimidyl (NHS) residue on the one end is reactive to amines on the tip,
and a 2-pyridyldithiopropionyl (PDP) residue on the other end can be covalently bound
to thiols. The ligand density on the tip is adjusted to a value (≈500/μm
2
) where only
one ligand on the tip is expected to have access to the receptors on the probe. Therefore,
single-molecule experiments can be carried out with the described tip sensor design.
The AFM tips are functionalized with ligands, using a thorough cleaning protocol and
a three-step binding mechanism. The configuration of the ligand-modified tip is depicted
in Fig. 1.
a. Cleaning
Prior to functionalization, the AFM tips (Park, Sunnyvale, CA; MacLevers, Molecular
Imaging, Phoenix, AZ) are cleaned in a thorough four-step procedure (Hinterdorfer et al.,
1996). The wafers are first defatted in chloroform for 10 min and dried with N
2
. They
are then incubated in piranha solution (H
2
SO
4
/H
2
O
2
, 90/10 (v/v)) for 30 min (except
118 Peter Hinterdorfer
Fig. 1 Linkage of ligands to AFM tips. Ligands are covalently coupled to AFM tips via a heterobi-
functional polyethylene glycol (PEG) derivative of 8 nm length. Silicon tips are first functionalized with
ethanolamine (NH
2
–C
2
H
4
OH·HCl). Then, the NHS end of the PEG linker is covalently bound to amines on
the tip surface before ligands are attached to the PDP end via a free cysteine. Reproduced with permission from
Hinterdorfer, P., Kienberger, F., Raab, A., Gruber, H. J., Baumgartner, W., Kada, G., Riener, C., Wielert-Badt,
S., Borken, C., and Schindler, H. (2000). Poly(ethylene glycol): An ideal spacer for molecular recognition
force microscopy/spectroscopy. Single Mol. 1, 99–103.
MacLevers) and subsequently rinsed with about 100 ml of deionized water before they
are dried with N
2
. For a final cleaning step and regeneration of the SiOH groups on the
tip surface, tips are optionally put in water plasma (Kiss and G¨olander, 1990) (Harrick
Sci. Corp., Ossining, NY) and immediately used afterwards.
b. Esterification
In the first functionalization step, amines are bound to tip surfaces according to an
esterification protocol with slight modifications (Hinterdorfer et al., 1996, 1998). Thirty
percent (mol/mol) 2-aminoethanol-Cl is melted in dry dimethyl sulfoxide at 100
◦
Cinthe
presence of 0.3-nm molecular sieve beads. After the solution is allowed to cool down to
room temperature, tips are added and incubated for 15 h before they are washed in bare
6. Molecular Recognition Studies 119
dimethyl sulfoxide and dried with N
2
. Such amine-modified tips are stable for weeks
when stored in a desiccator.
c. Crosslinker Binding
The crosslinker, NHS–PEG
24
–PDP, is conjugated to amines on AMF tip surfaces
via its NHS end. Amine-containing tips are incubated at a concentration of 1–3 mg/ml
NHS–NH–PEG
24
–PDP in CHCl
3
containing 0.5% (v/v) triethylamine for 1–3 h at room
temperature in an Ar
2+
-saturated atmosphere. Immediately after washing in ChCl
3
and
drying with Ar
2+
, the reaction protocol was followed by the ligand binding step.
d. Ligand Binding
Ligands are bound via free thiols (SH) to the PDP end of the PEG derivative. This type
of chemistry is highly advantageous since it is very reactive and renders site-directed
coupling possible. However, free thiols are hardly available on native ligands and must
therefore be generated.
For this we use three different strategies: (i) Amines of ligands, in particular lysins, are
derivatized with N-succinnimidyl-3-(S-acethylthio)propionate (SATP) by incubating the
ligands in a ∼10-fold molar access of SATP in buffer and by subsequent removal of free
SATP by gel exclusion chromatography (Haselgr¨ubler et al., 1995; Hinterdorfer et al.,
1996, 1998). Deprotection of the SH groups with NH
2
OH leads to reactive groups. Since
it is very difficult to react distinct amines with this method, the coupling to the crosslinker
is often not specifically site directed. (ii) Half-antibodies are produced by cleaving the
two disulfides in the central region of the heavy chain using 2-mercaptoethylamine HCl
(Sigma, Vienna, Austria) according to a standard procedure (Pierce, Rockford, IL). The
half-antibody is then coupled to the PDP end of the crosslinker via one of the two
neighboring cysteines (Raab et al., 1999). (iii) The most elegant method is to mutate a
cysteine into the primary sequence of proteins because it allows for a defined sequence-
specific coupling of the ligand to the crosslinker.
For all three coupling strategies described earlier, ligands carrying free thiols are
reacted to the PDP end of the crosslinker at a concentration of 1–10 μM for 1–3 h in
a buffer that represses oxidation (1 mM EDTA in phosphate-buffered saline). Ligand-
functionalized tips are stored in buffer in a cold room and retain their functionality over
several weeks.
A nice alternative for a most common noncovalent, site-directed high-affinity-binding
anchor with large bond strength on the tether has been recently introduced. The binding
strength of the NTA–His
6
system, routinely used on chromatographic and biosensor
matrices for the binding of recombinant proteins to which a His
6
tag is appended to
the primary sequence, was found to be significantly large than typical values of other
ligand–receptor systems (Conti et al., 2000; Kienberger, Kada et al., 2000). Therefore, a
PEG crosslinker containing an NTA residue, instead of the PDP group, is ideally suited
for coupling a recombinant ligand, carrying His
6
in its sequence, to the AMF tip. This
general, side-directed, and oriented coupling strategy also allows rigid and fast control
of the specificity of ligand–receptor recognition by using Ni
2+
as a molecular switch of
the NTA–His
6
bond.
120 Peter Hinterdorfer
e. Ligand Density and Functionality
Silicon (Si
3
N
4
or SiOH, respectively) substrates (size ≈1cm
2
) are treated in paral-
lel with the AFM tips for the determination of the macroscopic ligand density on the
surfaces. Three different methods were employed to investigate the number density of
the ligands. (i) Antibodies were directly fluorescence labeled prior to their conjugation to
surfaces. The substrates were inserted in a wide-field epifluorescence microscope and the
fluorescence intensity was measured with sensitive high-resolution fluorescence imag-
ing using a nitrogen-cooled CCD camera. The ligand surface densities were calculated
after accurate single fluorophore calibration (Hinterdorfer et al., 1996; Schmidt et al.,
1996). (ii) Alternatively, fluorescence-labeled secondary antibodies were ligated to the
F
c
portion of surface-bound primary antibodies and the F
c
density was determined as
described in (i). (iii) The ligand site density was determined by an enzyme immunoassay
(EIA) similar to that used by Hinterdorfer et al. (1998). Horseradish peroxidase (HRP)
antibodies directed to the ligands were bound to the surface, and the enzyme activity
was measured in a spectrophotometer. Enzyme densities were calculated after calibration
with anti-rabbit–horseradish peroxidase antibody in solution.
The latter two methods provide the advantage in testing the functionality of the ligands
on the surface, while the first determines only the total number density. Under our
standard conditions, values between 200 and 500/μm
2
are usually obtained with all three
protocols. For a typical AFM tip radius of 20 to 50 nm, this value corresponds to about one
ligand per effective tip area, which appears to be suited for single-molecule experiments.
2. Probe Surfaces
For the recognition by ligands of the AFM tip, receptors are tightly attached to probe
surfaces. Loose receptor fixation could lead to a pull-off of the receptor from the surface
by the ligand on the tip, which would consequently block ligand–receptor recognition.
The different surface-binding strategies used must be adjusted to the respective properties
of the biological samples.
a. Isolated Components
Ideally, water-soluble receptors like either globular antigenic proteins (Hinterdorfer
et al., 1996) or extracellular protein chimeras (Baumgartner, Hinterdorfer, Ness et al.,
2000) are covalentlyanchored. Whensilicon ormica isused asa probe surface, exactly the
same surface chemistry is employed for the AFM tips (cf. Section I,A,1). Therefore, the
receptor is also provided with motional freedom, which guarantees unconstrained ligand–
receptor recognition. The purification step is omitted for mica; instead it is freshly cleaved
prior to use. In addition, the number of reactive SiOH groups of the chemically relatively
inert mica is optionally increased by water plasma treatment (Kiss and G¨olander, 1990)
(Harrick Sci. Corp., Ossining, NY).
Some receptor proteins strongly adhere to mica (Raab et al., 1999) via either hydro-
phobic or electrostatic interaction, in which case it is safe to purely adsorb the receptors
from the solution, since the unspecific attachment to the surface is sufficiently strong for
recognition force experiments. Electrostatic interaction via Ca
2+
bridges was also used
to adsorb ion channels in a defined orientation to mica (Kada et al., 2000).
6. Molecular Recognition Studies 121
Another possibility of binding biomolecules to surfaces is through sulfur–gold chem-
istry (Dammer et al., 1996; Ros et al., 1998). This strategy has also been used for binding
ligands to gold-coated tips. Gold wafers with atomically flat surfaces are perfect probes
for AFM because they allow direct anchoring of isolated receptors via free thiols. Re-
ceptors on hydrophic chains can be incorporated into self-assembled monolayers (SAM)
that form spontaneously on gold and, additionally, can be covalently bound via an SH
group on the chain end (Kienberger, Kada et al., 2000). In this way, well-defined surfaces
with accurate adjustable lateral densities of reactive sites can be prepared.
b. Membranes and Cells
Various protocols for tight cell anchoring are available. The easiest method for tight
cell anchoring is to (i) either grow the cells directly on glass or other surfaces in their cell
culture medium (Le Grimellec et al., 1998) or (ii) simply adsorb the cells via adhesive
coating like Cell-Tak (Schilcher et al., 1997), gelatin, and poly-lysin. Other hydrophic
surfaces like gold or carbon are suitable matrices as well (Wielert-Badt et al., 2000).
Covalent binding of cells to surfaces can be accomplished by using PEG crosslinkers
similar to those described for tip chemistry, since they react with free thiols on the
cell surface (Schilcher et al., 1997). Alternatively, PEG crosslinkers carrying a fatty
acid penetrate into the interior of the cell membrane which guarantees a sufficiently
strong fixation without interference with membrane proteins (Schilcher et al., 1997).
Using glass or mica surfaces, model membranes can be prepared either by vesicle
fusion (Kalb et al., 1992) or by the Langmuir–Blodgett technique (Kalb et al., 1992); both
result in supported lipid bilayers. With reconstitution techniques, membrane
proteins can be embedded into such artificial membranes (Hinterdorfer et al., 1994).
B. Unbinding Force Measurements
1. Force–Distance Cycle
Single-molecule ligand–receptor recognition events are measured in force–distance
cycles (Fig. 2a). At a fixed lateral position, a cantilever carrying a ligand is moved
toward a probe surface to which receptors are attached and subsequently retracted. The
cantilever deflection x is measured independent of the tip–surface separation z. The
force F acting on the cantilever directly relates to the cantilever deflection x according
to F = k x, where k is the cantilever spring constant.
During the tip–surface approach (trace, dashed line) the cantilever deflection remains
at zero far away from the surface because there is no detectable tip–surface interaction.
At a sufficiently close tip–surface separation, the antibody on the tip has a chance to
bind to a receptor on the surface. Upon tip–surface contact (z = 0 nm) a repulsive
force develops that increases the harder the tip is pushed into the surface. Subsequent
tip–surface retraction (retrace, solid line) leads to relaxation of the repulsive force.
When ligand–receptor binding has occurred, an attractive force develops (unbind-
ing event) in the retrace (z = 0–21 nm) and increases with increasing tip–surface
separation. Its shape, determined by the elastic properties of the flexible PEG crosslinker
(Kienberger, Pastushenko et al., 2000; Hinterdorfer et al., 2000), shows a nonlinear,
parabolic-like characteristic which reflects the increase of the spring constant of the
122 Peter Hinterdorfer
Fig. 2 Single-molecule recognition event. (a) Raw data from a force–distance cycle with a 100-nm
z amplitude at 0.9 Hz measured in PBS. The attractive force signal developing in the retrace (0 nm)
reflects single-molecule recognition of a receptor on a surface by a ligand on the tip. (b) Force–distance
cycle lacking a molecular recognition event. Ligands in solution block receptor binding sites on the surface.
Reproduced with permission from Hinterdorfer, P., Kienberger, F., Raab, A., Gruber, H. J., Baumgartner, W.,
Kada, G., Riener, C., Wielert-Badt, S., Borken, C., and Schindler, H. (2000). Poly(ethylene glycol): An ideal
spacer for molecular recognition force microscopy/spectroscopy. Single Mol. 1, 99–103.
crosslinker during extension. Therefore, specific ligand–receptor recognition is easily
distinguishable from the linearly shaped, eventually occurring nonspecific tip–surface
adhesion signals. The physical connection between tip and surface sustains the in-
creasing force until the ligand–receptor complex dissociates at a certain critical force
(unbinding force), and the cantilever finally jumps back to the resting position
(at z = 21 nm). The quantitative force measure of the unbinding force of a single
ligand–receptor pair is directly given by the force at the moment of unbinding (z =
21 nm).
The specificity of ligand–receptor binding is demonstrated in block experiments
(Fig. 2b). Free ligands are injected into a solution so as to block receptor sites on the
6. Molecular Recognition Studies 123
surfaces. The ligand–receptor recognition signal completely disappears and retrace looks
like trace. Apparently, the receptor sites on the surface are blocked by the ligand of the
solution, and thus prevent recognition by the ligand on the tip.
2. Unbinding Force Distribution
Hundreds of force–distance cycles are usually recorded to quantify the unbinding
force. No deterioration of ligand binding is found, even after storage in buffer for weeks,
indicating that the design of the AFM tip sensor is highly stable. Force–distance cycles
are stored in digitized form and normalized to a slope of −k in the contact region,
where k is the spring constant of the cantilever. Unbinding events are detected using a
transition detection algorithm (Baumgartner, Hinterdorfer, and Schindler, 2000) similar
to a method for event detection in patch-clamp data. Since full cantilever relaxation is
required for reliable height detection, only the last event yielding the unbinding force
was used for further analysis.
Distributions of unbinding forces (Fig. 3) are obtained by constructing empirical
probability density functions from unbinding force measurements (Hinterdorfer et al.,
1996; Baumgartner, Hinterdorfer, and Schindler, 2000b). Single Gaussian functions of
unitary area are calculated from the mean and variances of every value of the unbinding
force. The Gaussian functions are added up and finally normalized, yielding the empirical
probability density function. The advantage of this representation over simple histograms
is that the data are weighted by their accuracy, thus yielding a better resolution. Values of
unbinding forces give a Gaussian-like distribution (Fig. 3); for example, the maximum is
f ± σ
u
= 150 ± 38 pN (mean ± SD). The uncertainty in determining f
u
values, given
Fig. 3 Distribution of unbinding forces. An empirical probability density function (pdf, solid line) was
constructed from about 150 values of unbinding forces (for details see Experimental Approach) obtained in
force–distance cycles. Data were fitted with a Gaussian function (dotted line). Reproduced with permission
from Raab, A., Han, W., Badt, D., Smith-Gill, S. J., Lindsay, S. M., Schindler, H., and Hinterdorfer, P. (1999).
Antibody recognition imaging by force microscopy. Nature Biotechnol. 17, 902–905.
124 Peter Hinterdorfer
by the thermal noise of the cantilever, was σ
0
∼ 10 pN for the cantilever used. Therefore,
unbinding forces were detectable at a signal-to-noise ratio of f/σ
0
= 15.
III. Dynamic Force Spectroscopy
A. Principles
1. Bond Lifetime
Ligand–receptor binding is generally a reversible reaction. The average lifetime of a
ligand–receptor bond, τ
0
, is given by the kinetic offrate k
off
, according to τ
0
= k
off
−1
.A
force acting on a binding complex essentially reduces its lifetime. At the millisecond time
scale of AFM experiments, thermal impulses govern the unbinding process. Inthe thermal
activation model, the lifetime τ ( f ) of a bond loaded with a force f is written as τ ( f ) =
τ
osc
∗ exp((E
b
−l ∗ f )/k
B
∗ T) (Bell, 1978), where τ
osc
is the inverse of the natural
oscillation frequency, E
b
is the energy barrier for dissociation, and l is the effective length
of the bond. Consequently, the lifetime τ( f ) under force f compares to the lifetime at
zero force, τ
0
, according to τ ( f ) = τ
0
∗ exp(−l
r
∗ f / k
B
∗ T) (Hinterdorfer et al., 1996).
From unbinding force distributions (cf. Fig. 3), an effective lifetime τ ( f ) of the bond
under an applied force f can be estimated by the time the cantilever spends in the force
window spanned by the standard deviation σ
U
of the f
u
distribution (Hinterdorfer
et al., 1996). The time the force increases from f − σ
U
to f + σ
U
is then given by
τ ( f ) ≈ 2σ
U
/df/dt (Hinterdorfer et al., 1996). In a typical example of a ligand–receptor
interaction described in Kienberger, Kada et al. (2000), the lifetime τ ( f ) decreased with
increasing pulling force f from 17 ms at 150 pN to 2.5 ms at 194 pN. The data were fitted
with the Boltzmann ansatz described previously, yielding the exponential lifetime–force
relation for the reduction of the lifetime τ( f ) by the applied force f. Data fit also yielded
the lifetime at zero force, τ
0
= 15 s, which corresponds to a kinetic offrate of k
off
=
6.7 10
−2
s
−1
(Kienberger, Kada et al., 2000).
2. Unbinding Force versus Loading Rate
Theoretical studies determined that the unbinding force of specific and reversible
ligand–receptor bonds is dependent on the rate of the increasing force (Grubm¨uller
et al., 1996, Evans and Ritchie, 1997, Izraelev et al., 1997) during force–distance cycles.
In experiments, unbinding forces were found not to assume a unitary value but were
rather dependent on both the pulling velocity and the cantilever spring constant (Lee,
Kidwell et al., 1994). The theoretical findings were confirmed by experimental stud-
ies and revealed a logarithmic dependence of the unbinding force on the loading rate
(Merkel et al., 1999; Struntz et al., 1999; Baumgartner, Hinterdorfer, Ness et al., 2000;
Kienberger, Kada et al., 2000), which is consistent with the exponential lifetime–force
relation described earlier. A force acting on a binding complex reduces the lifetime of
the bond due to its input of thermal energy. The input of the mechanical energy during
pulling enhances the probability of ligand bond dissociation. During a force–distance
6. Molecular Recognition Studies 125
cycle, the force increases at a nonlinear rate determined by the force–distance profile of
the tether, by which the ligand is coupled to the tip. Finally, the complex dissociates at
force f. The main contribution of the thermal activation comes from the part of the force
curve which is close to unbinding. Therefore, the f values are dependent on the rate of
force increase r; r = df/dt = vertical scan velocity times spring constant, at the end of
the recognition signal in the retrace.
In unbinding force distributions, both force f and width σ
U
clearly increase with
increasing loading rate (Kienberger, Kada et al., 2000). Apparently, at slower loading
rates the systems adjusts closer to equilibrium which leads to smaller values of both the
force f and its variation σ
U
. On a half-logarithmic scale, the unbinding force f rises linear
with the loading rate, which is characteristic for a single energy barrier in the thermally
activated regime (Merkel et al., 1999).
3. Kinetic Rates, Energies, Binding Pocket
Single-molecule recognition force microscopy studies allow for estimation of ki-
netic rates (Hinterdorfer et al., 1996, 1998, Baumgartner, Hinterdorfer, Ness et al.,
2000; Kienberger, Kada, Gruber et al., 2000), energies (Merkel et al., 1999), and struc-
tural parameters of the binding pocket (Hinterdorfer et al., 1996, 1998; Baumgartner,
Hinterdorfer, Ness et al., 2000; Kienberger, Kada, Gruber et al., 2000). Quantification
of the onrate constant k
on
for the association of the ligand on the tip to a receptor on
the surface requires determination of the interaction time t
0.5
needed for half-maximal
probability of binding. With the knowledge of the effective ligand concentration c
eff
on
the tip available for receptor interaction, k
on
is given by k
on
= t
0.5
−1
c
eff
−1
. The interac-
tion time t
0.5
for half-maximal binding can be experimentally determined by measur-
ing the dependence of the binding activity on the ligand–receptor encounter duration
(Baumgartner, Hinterdorfer, Ness et al., 2000; Baumgartner, Gruber et al., 2000). The
effective concentration c
eff
is described by the effective volume V
eff
, and the tip-tethered
ligand diffuses about the tip, which yields c
eff
= N
A
−1
V
eff
−1
, where N
A
is the Avogadro
number. Therefore, V
eff
is essentially a half-sphere with a radius of the effective tether
length.
The additional estimation of the offrate constant k
off
as described previously leads to
values for the equilibrium dissociation constant K
D
, according to K
D
= k
off
/k
on
. The
same data fit used to obtain k
off
also reveals estimates for the energy barrier for dissoci-
ation, E
b
, and the effective length of the ligand–receptor bond, l (cf. Section III,A,1).
B. Applications to Cellular Proteins
1. Vascular Endothelial (VE) Cadherin
a. Introduction
Vascular endothelial cells form a continuous cellular monolayer that covers the inner
surface of blood vessels. This monolayer constitutesthe majorbarrier ofthe bodythat sep-
arates the blood compartment from the extracellular space of tissues. Cadherin-mediated
adhesion between endothelial cellular layers (i) confers mechanical stability against