Atomic Force Microscopy in Cell Biology Episode 2 Part 5 pptx
Bạn đang xem bản rút gọn của tài liệu. Xem và tải ngay bản đầy đủ của tài liệu tại đây (997.5 KB, 20 trang )
266 M¨uller and Engel
Fig. 5 Imaging a polypeptide loop grafted onto bacteriorhodopsin. (A) Secondary structural model of
bacteriorhodopsin from Halobacterium salinarum. (B) The polypeptide loop connecting transmembrane
α-helices E and F (loop EF) of the bacteriorhodopsin molecule was replaced by loop EF from bovine rhodopsin
to produce the mutant IIIN (indicated by the filled circles, the numbering in the boxes give the residue in IIIN
first and the residue in the rhodopsin loop second). V8 protease cleaves this loop after the glutamates indicated
by the arrows (see Fig. 6). (C) Topograph of the mutant IIIN containing the rhodopsin EF loop. (D) Threefold
symmetrized correlation average of mutant IIIN trimer. (E) Standard deviation map of the average. (F) Three-
fold symmetrized correlation average of the bacteriorhodopsin trimer imaged elsewhere (M¨uller, Sass et al.,
1999). (G) Standard deviation map of the bacteriorhodopsin trimer. The outlined BR monomer represents
a section close to the cytoplasmic surface of the lipid membrane, and the positions of the transmembrane
α-helices A to F were obtained after merging six atomic models of BR (Heymann et al., 1999). Vertical
brightness range of contact mode topographs corresponds to 1.8 nm. Minima and maxima of the SD maps
were 0.32 and 0.43 nm for (E) and 0.07 and 0.19 nm for (G) respectively.
13. Atomic Force Microscopy and Spectroscopy of Membrane Proteins 267
rhodopsin (Rho EF) also interacts with rhodopsin kinase, which phosphorylates light-
activated rhodopsin, and with arrestin, which displaces transducin from light-activated
phosphorylated rhodopsin. To directly observe the rhodopsin loop, purple membrane
containing the mutant bacteriorhodopsin (called IIIN) was imaged by AFM under phys-
iological conditions to a resolution of 0.7 nm (Fig. 5C). It was found that the modifi-
cation of loop EF changed neither the crystallographic lattice nor the extracellular surface
(Heymann et al.,2000).Thiswasnotunexpected, becausefragmentsofbacteriorhodopsin
separated in the EF loop can be reconstituted with the bacteriorhodopsin chromophore
(Kataoka et al., 1992; Liao et al., 1984; Sigrist et al., 1988). Thus, the bacteriorhodopsin
framework was not affected by the loop replacement which provided a stable founda-
tion for studying the Rho EF loop. The major difference in the topographs between the
cytoplasmic surfaces of the mutant and bacteriorhodopsin purple membrane is the much
larger EF loop projecting toward the C-terminus (Figs. 5D and 5F).
C. Identification by Removal of a Polypeptide Loop
From Fig. 5 it is clear that structural changes of membrane proteins induced by the
replacement of individual polypeptide loops can be directly observed by AFM under
physiological conditions. Alternatively, individual loops can be removed to identify
structural features of membrane protein surfaces.
Digestion of the rhodopsin loop EF from mutated IIIN bacteriorhodopsin (Fig. 5B)
with V8-protease did not affect the purple membrane crystallinity (Fig. 6A). The AFM
topograph showed a significant reduction in the major protrusion compared to the undi-
gested surface (Fig. 6B) and the ends of helices E and F became clearly visible. This
structural change was consistent with mass spectrometry indicating that a 10-residue
fragment of loop Rho EF had been removed (Heymann et al., 2000). Interestingly, AFM
topographs of purple membrane did not show any indication of the largest polypeptide
residue located at the cytoplasmic surface, the C-terminus (24 aa), and the simplest
interpretation is that this is too unstructured to allow imaging.
D. Identification by Removal of Polypeptide Ends
This alternative method to identify the surfaces of membrane proteins is illustrated by
the selective cleavage of terminal polypeptide sequences of aquaporin Z (AqpZ) from
E. coli (Scheuring, Ringler et al., 1999) and of major intrinsic protein (MIP) from sheep
lenses (Fotiadis et al., 2000).
Figure 7A shows the AFM topograph of recombinant AqpZ tetramers reconstituted
into a bilayer and assembled into a two-dimensional (2D) crystal. The AqpZ had an
N-terminal fragment of 26 amino acids located on the cytoplasmic surface. After over-
night treatment with trypsin, the N-terminal fragment had been removed from the protein
at the trypsin cleavage site Arg26. While the uncleaved sample allowed only one AqpZ
surface to be imaged, the digested sampleclearlyshowed substructuresofthecytoplasmic
(circle) and extracellular (square) AqpZ surface (Fig. 7B).
Topology prediction and antibody labeling of MIP places the approximately 5-kDa
C-terminal region on the cytoplasmic surface of the lens fiber cell membrane. The native
268 M¨uller and Engel
Fig. 6 Imaging bacteriorhodopsin after removal of the EF loop. (A) Topograph of the bacteriorhodopsin
surface after cleavage of the rhodopsin EF loop with V8 protease. For cleavage sites of the V8 protease,
see Fig. 5B. The topograph is displayed as a relief tilted by 5
◦
. (B) Threefold symmetrized average of the
bacteriorhodopsin trimer imaged in (A). (C) Standard deviation map of the average. Vertical brightness range
of contact mode topographs corresponds to 1 nm. Minima and maxima of the SD map was 0.1 and 0.17 nm.
cytoplasmic surface of MIP tetramers, reconstituted into a bilayer and assembled into a
2D crystal, exhibited maximum globular protrusions of 0.8 ± 0.1 nm (Fig. 7C). After
removal of the C-terminal tail with carboxypeptidase Y the cytoplasmic surface changed
its appearance (Fig. 7D). The cytoplasmic surface appeared coarser, and the averaged
structure revealed the partial loss of four prominent protrusions leaving a central cavity
within the MIP tetramer. This structural change is emphasized by the difference map
(Fig. 7F) calculated between the unit cell of the digested (Fig. 7D) and of the native
(Fig. 7E) cytoplasmic MIP surface. It is important to note that neither the extracellular
surface of AqpZ nor that of MIP appeared to be structurally affected by the enzymatic
digestion of the cytoplasmic surface.
13. Atomic Force Microscopy and Spectroscopy of Membrane Proteins 269
Fig. 7 Identification of protein structures by removal of polypeptide ends. (A) Identifying the cytoplasmic
surface of aquaporinZ (AqpZ). Topograph of AqpZ tetramers assembled into a 2D crystal. In this crystal form,
each tetramer is neighbored by four tetramers oriented in the opposite direction with respect to the membrane
plane. B, The same crystal imaged after trypsin digestion. Since trypsin removes most of the 26-amino-acid
long C-terminal region, the surface structure of the cytoplasmic surface changed drastically. The extracellular
surface of the AqpZ tetramers was unchanged by this treatment (circles). Vertical brightness range of contact
mode topographs corresponds to 3 nm. Topographs are displayed as reliefs tilted by 5
◦
(images courtesy
of Simon Scheuring, University of Basel). (C) Imaging the removal of the C-terminal region of the major
intrinsic protein (MIP). Averaged topograph of the cytoplasmic MIP surface imaged in buffer solution. The
MIP tetramers from sheep eye lenses were reconstituted into a lipid bilayer where they assembled into a 2D
crystal (Fotiadis et al., 2000). The same unit cell (white square) contained one MIP tetramer and had a side
length of 6.4 nm. (D) Unit cell of the cytoplasmic MIP surface after removal of the C-terminal region. (E) Unit
cell of the native cytoplasmic MIP surface. (F) Difference map calculated between topographs of digested
(D) and of native MIP revealing the location of the C-terminal regions of the cytoplasmic surface; major
protrusion. Vertical brightness range of contact mode topographs corresponds to 1 nm (images courtesy of
Dimitrios Fotiadis, University of Basel).
From the previous AFM measurements it follows that the conformation of the AqpZ
N-terminal fragment (26 amino acids) was too flexible to be imaged with subnano-
meter resolution (blurred protrusion) but was structurally sufficiently stable to distort
the scanning stylus, thereby preventing the visualization of other substructures on the
cytoplasmic surface. The C-terminal fragment of MIP existed in a structurally more
stable conformation and was imaged by the AFM stylus. In contrast, the C-terminal
270 M¨uller and Engel
region of bacteriorhodopsin, consisting of 25 amino acids, is not observed by AFM
and does not influence the visualization of surrounding substructures by AFM (compare
to Fig. 6). The results illustrate that the polypeptide ends of distinct proteins exist in
conformations of different stability; the conformation of the C-terminal region of MIP
is stable enough to be reproducibly imaged at subnanometer resolution; the N-terminal
region of AqpZ is structurally less stable than the C-terminal end of MIP but more stable
than the disordered C-terminal domain of bacteriorhodopsin (Belrhali et al., 1999; Essen
et al., 1998; Grigorieff et al., 1996; Heymann et al., 1999; Luecke et al., 1999b; Mitsuoka
et al., 1999) which is not detected by AFM (M¨uller, Sass et al., 1999). Accordingly, a
structural change caused by the cleavage of a polypeptide can only be observed by the
AFM if it could be reproducibly detected before of its removal.
IV. Observing the Oligomerization of Membrane Proteins
α-Hemolysin is a water-soluble protein that undergoes several conformational changes
from the time it is released from Staphylococcus until it interacts with a plasma mem-
brane. Initially hemolysin is a monomer, which undergoes oligomerization into a homo-
oligomeric ring finally inserting into the lipid bilayer forming a pore. Interestingly,
this pore which facilitates water permeation across the membrane can be genetically en-
gineered to sense a range of different organic molecules (Gu et al., 1999). For some years
it has been discussed whether the hemolysin oligomer exists in a hexameric or in a hepta-
meric stoichiometry since different techniques have shown different oligomeric states
of the complex (Gouaux et al., 1994; Song et al., 1996). Avoiding problems which may
arise determining the oligomeric stoichiometry of proteins imaged by diffracting tech-
niques, the high signal-to-noise ratio of the AFM allows subunits of protein complexes
to be imaged directly and their oligomeric stoichiometry to be determined.
Staphylococcal α-hemolysin inserted into phospholipid bilayers is shown in Fig.8.The
AFM topograph shows unambiguously the hexameric state of the oligomeric complex
which assembled into a two-dimensional array (Czajkowsky et al., 1998). Interestingly,
additional data have been recently published on α-hemolysin mutants locked in their open
state (Malghani et al., 1999). In contrast to the previously described data, the mutants
appear to exist in a heptameric stoichiometry. As already pointed out (Czajkowsky et al.,
1998), it may be possible that α-hemolysin may form stable oligomers which differ
in their stoichiometry. However, it remains a challenge to determine those factors that
influence the oligomeric state of biochemically indistinguishable α-hemolysins.
ATP synthases are large protein complexes that convert the energy of a transmembrane
proton (or Na
+
) gradient into the biological energy source ATP. Its integral membrane
complex F
o
(∼170 kDa) couples the transmembrane flow of protons to the rotation of a
molecular stalk (Kato-Yamada et al., 1998; Noji et al., 1997; Sabbert et al., 1996). The
rotational force expels the spontaneously formed ATP from the three catalytic sites of the
water-soluble F
1
complex (∼400 kDa). While the catalytic subcomplex α
3
β
3
γ as well
the isolated subunits δ and ε of F
1
have been solved to atomic resolution (Abrahams et al.,
13. Atomic Force Microscopy and Spectroscopy of Membrane Proteins 271
Fig. 8 Contact mode AFM topograph of α-hemolysin oligomers. The α-hemolysin inserted into the phos-
pholipid bilayer in 10 mM sodium phosphate (pH 7.2) at room temperature and assembled into a 2D lattice.
Raw image displayed as relief tilted by 5
◦
. The scale bar represents 7.5 nm. Topograph displayed as relief
tilted by 5
◦
(image courtesy of Daniel Czajkowsky, University of Virginia).
1994; Bianchet et al., 1998; Wilkens et al., 1995; Wilkens et al., 1997), the structure of the
F
o
complex still awaits elucidation. To gain insight into the mechanochemical coupling
synthesizing ATP, the arrangement of the transmembrane F
o
complex assembled from
subunits I
1
,II
1
, III
x
, and IV
1
in chloroplast ATP synthase (CF
o
F
1
) or from subunits a
1
,
b
2
,c
x
in bacterial and mitochondrial ATP synthase (EF
o
F
1
) is a matter of investigation.
Several subunits, III
x
and (c
x
), form the “proton turbine” of the ATP synthase. The
mechanism determining the exact number of subunits, III
x
, however, is a topic of debate
and remains to be answered.
Atomic force microscopy of the III
x
oligomer of the most abundant ATP synthase from
chloroplast revealed the surface at a sufficient resolution to allow the number of III sub-
units to be counted. Thus, topographs of the reconstituted cylindrical complex assembled
from subunit III of the chloroplast F
o
F
1
-ATP synthase provided compelling evidence that
this proton-driven turbine comprises 14 subunits (Fig. 9) (Seelert et al., 2000). This find-
ing is in contrast to the stoichiometry of the E. coli F
o
complex which is postulated to be
a dodecamer of subunit c, mainly based on crosslinking experiments (Jones et al., 1998),
genetic engineering (Jones and Fillingame, 1998), and model building (Dmitriev et al.,
1999; Groth and Walker, 1997; Rastogi and Girvin, 1999). Interestingly, X-ray analyses
of yeast F
o
F
1
-ATP synthase crystals yielded a decameric complex (Stock et al., 1999),
272 M¨uller and Engel
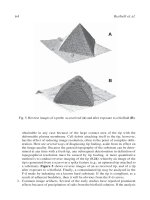
Fig. 9 Proton-driven rotor of the chloroplast ATP synthase reconstituted into a membrane bilayer. As shown
by this unprocessed topograph, this cylindrical oligomer comprises 14 subunits (Seelert et al., 2000). The dense
packing of oligomers required an alternating orientation vertical to the membrane plane. Thus, the distinct
wide and narrow rings represent the two surfaces of the cylindrical complex. Imaging buffer: 25 mM MgCl
2
,
10 mM Tris–HCl, pH 7.8. Vertical brightness range of contact mode topograph corresponds to 2 nm. The raw
image is displayed as a relief tilted by 5
◦
.
indicating that polymorphic stoichiometries of F
o
complexes may have a biological
origin which is not yet understood.
V. Unraveling the Conformational Variability
of Membrane Proteins
A. Force-Induced Conformational Changes
The cytoplasmic bacteriorhodopsin surface, imaged with a force of 100 pN applied to
the AFM stylus, revealed trimeric structures arranged in a trigonal lattice of 6.2 ± 0.2nm
side length (Fig. 10A, top; (M¨uller, Sass et al., 1999). Each subunit in the trimer features
a particularly pronounced protrusion extending 0.83 ± 0.19 nm above the lipid surface.
This protrusion is associated with the loop connecting α-helices E and F (Fig. 10B;
(M¨uller, Buldt et al., 1995)). Increasing the applied force to about 200 pN during imaging
changed the AFM topographs significantly. The prominent EF loops were bent away and
the shorter loops of the bacteriorhodopsin monomers were visualized (Figs. 10A, bottom;
and 10D). This conformational change was fully reversible (M¨uller, Buldt et al., 1995),
Fig. 10 Force-induced conformational change of the cytoplasmic purple membrane surface. (A) At the top of the topograph the force applied to
the AFM stylus was 100 pN. While scanning the surface line by line, the force was increased until it reached 150 pN at the bottom of the image. This
force-induced conformational change of bacteriorhodopsin was fully reversible (M¨uller, B¨uldt et al., 1995). Correlation averages of the cytoplasmic
surface recorded at 100 pN (B) and at 200 pN (D). The correlation averages are displayed in perspective view (top, shaded in yellow brown) and in
top view (bottom, in blue) with a vertical brightness range of 1 nm and exhibited 9.2% (B) and 14.1% (D) RMS deviations from threefold symmetry.
Structural flexibilities were accessed by SD maps (C and E corresponding to B and D, respectively) which had a range from 0.08 (lipid) to 0.19 nm
(EF loop region). Surface regions exhibiting a SD above 0.12 nm are superimposed in red-to-white shades in top of figure (B and D). The contact
mode topograph was recorded in buffer solution (100 mM KCl, 10 mM Tris–HCl, pH 7.8). The outlined bacteriorhodopsin trimer representing sections
close to the cytoplasmic surface of the lipid membrane was obtained after merging six atomic models of bacteriorhodopsin (Heymann et al., 1999).
Topographs (A), (B), and (E) are displayed as relief tilted by 5
◦
.
274 M¨uller and Engel
suggesting that loop EF is a rather flexible element of the bacteriorhodopsin molecule. At
this force of 200 pN, the maximum height difference between the protein and the lipid
membrane was 0.64 ± 0.12 nm. Four distinct protrusions were recognized in almost
every monomer, and a further distinct protrusion was present at the center of the trimers.
The calculated diffraction pattern of this topograph documents an isotropic resolution
out to 0.45 nm (not shown).
While the standard deviation of the height measurements was around 0.1 nm for
most morphological features of the topography, the EF loop exhibited an enhanced
SD of 0.19 nm (Fig. 10C), consistent with the high-temperature factor observed by
electron microscopy (Grigorieff et al., 1996) and the structural variation among the
atomic bacteriorhodopsin models (Heymann et al., 1999). When the major protrusion
representing loop EF had been pushed away by applying a force of 200 pN to the
stylus, the cytoplasmic surface of the bacteriorhodopsin molecule appeared different
and exhibited details of the shorter loops connecting helices AB and CD (Fig. 10D).
The protrusion between helices F and G together with the minor elevation between
helices E and F likely represents what remained structured from loop EF and the protrud-
ing parts of helices E and F that are compressed by the AFM stylus (Fig. 10D). However,
it cannot be excluded that the protrusion between helices F and G included a small part
of the C-terminal domain. This uncertainty arises because the AFM height signal in this
area exhibited a significant standard deviation (Fig. 10E; red shaded in Fig. 10D). The
other protrusions in the AFM topograph may be assigned by comparison with the atomic
models derived from the bacteriorhodopsin trimer (see following section). In these mod-
els, helix B protrudes out of the bilayer, and helix A ends below the bilayer surface.
Therefore, the protrusion close to helix B is likely to represent the short loop connecting
helices A and B (Fig. 10D). In addition, the discrete protrusion between helices C and D
corresponds to their connecting loop. A further protrusion of 0.2 nm height was present
at the threefold axis of the bacteriorhodopsin trimer and probably arises from structured
lipid molecules (Grigorieff et al., 1996).
To further analyze the conformations of the cytoplasmic surface, the unit cells of
topographs recorded at applied forces of 100 and 200 pN were extracted, aligned with
respect to a reference, and classified by principal component analysis (Frank et al., 1987;
van Heel, 1984). The threefold symmetrized averages of the major classes shown in
Figs. 11A to 11E reveal the movement of the flexible structures. The classes A, B, and
C, D were closely related to the force gradient. Increasing the force to 120 pN resulted in
a slight deformation of the EF loop and enhanced the details of the surrounding protein
structure (Fig. 11A; compare to Fig. 10B). Increasing the force to approximately 150 pN
further pushed the EF loop away (Fig. 11B), whereas at about 180 pN the conformational
change of the loop was complete (Figs. 11C to 11E). A central protrusion was apparent
in some bacteriorhodopsin trimers when imaged at 180 pN (Figs. 11C and 11E). Most
probably, this protrusion represented lipid headgroups which were absent or disordered
in some bacteriorhodopsin trimers. Increasing the applied force to 300 pN resulted in
deformation of the peripheral protrusions of the trimer. The structural information of
these areas was lost (M¨uller et al., 1998), and when imaged at applied forces above
300 pN the bacteriorhodopsin trimers were irreversibly deformed (data not shown).
13. Atomic Force Microscopy and Spectroscopy of Membrane Proteins 275
Fig. 11 Structural variability of the cytoplasmic bacteriorhodopsin surface. The threefold symmetrized aver-
ages were calculated from unit cells classified by multivariate statistical analysis using the algorithm kindly
provided by J P. Bretaudiere (Bretaudiere and Frank, 1986). (A) PM imaged at slightly enhanced forces of
120 pN (compare to Fig. 11B). (B) Same membrane imaged at an applied force of approximately 150 pN. In
(C), (D), and (E) three conformations of the membrane are imaged at approximately 180 pN. The last three
averages differ in their central protrusion and in that of the EF loop (compare to Fig. 10). The correlation
averages are displayed in perspective view with a vertical brightness range of 1 nm. Topographs are displayed
as relief tilted by 5
◦
.
VI. Comparing AFM Topographs to Atomic Models
A. Comparing Topographs of OmpF Porin to the Atomic Model
OmpF porin is present as stable trimeric structures in the outer membrane of E. coli.
Each 340-amino acid (aa) OmpF monomer is folded into 16 antiparallel β-strands to
form a large hollow β-barrel structure which perforates the membrane. The transmem-
brane pore facilitates the passages of hydrophilic solutes up to an exclusion size of
≈600 kDa (Nikaido and Saier, 1992). It is suggested that the charges of the porin chan-
nel primarily modulate the pore selectivity (Klebba and Newton, 1998; Schirmer, 1998),
and recent calculations have shown that the OmpF pore may establish an electrical po-
tential which increases with decreasing electrolyte concentration (Schirmer and Phale,
1999). As observed in the AFM topograph of the periplasmic surface (Fig. 12A), each
trimer (outlined circle) is compromised of tripartite protrusions and three transmem-
brane channels that are separated by 1.2-nm-thick walls. The transmembrane channel
has a characteristic elliptical cross section of a = 3.4nmandb = 2.0 nm. The arrows
point out individual polypeptide loops of a few aa size each connecting two antiparallel
ß-strands lining the transmembrane pore. Most features recorded in this AFM topograph
were correlated directly to the atomic model of the OmpF (Cowan et al., 1992) sur-
face rendered at 0.3 nm resolution (Fig. 12B). Correlation averaging of the porin trimer
enhanced common structural details among individual trimers (Fig. 12C) but blurred vari-
able areas of the subdomains (compare to porin trimers shown in raw data, Fig. 12A).
However, the characteristic shape of the transmembrane channel was more pronounced
showing an elliptical cross section of a = 3.4nmandb = 2.0 nm. Structural areas of
the periplasmic OmpF trimer surface exhibiting an enhanced variability are recovered
by the standard deviation map of the average (Fig. 12D). Enhanced values of the SD
map can directly correlate to surface structures which are expected to have enhanced
flexibility (Fig. 12B).
276 M¨uller and Engel
Fig. 12 AFM topograph and atomic model of OmpF porin. (A) The unprocessed topograph exhibits features
that are recognized in the atomic model of the periplasmic OmpF porin surface, rendered at 0.3 nm resolu-
tion (B). The circle outlines one porin trimer. Short β-turns comprising only a few amino acids are sometimes
distinct (arrows). (C) Correlation average of the rectangular unit cell of porin. (D) SD map of the correlation
average. All data are displayed in perspective view with a vertical brightness range of 1 nm (A, B, and C).
Vertical brightness range of contact mode topographs corresponds to 1 nm. Structural flexibilities accessed by
the SD map ranged from 0.06 to 0.12 nm. Images are displayed as reliefs tilted by 5
◦
.
B. Structure and Flexibility of the Bacteriorhodopsin Surface
Information about the surfaces of bacteriorhodopsin have been derived from elec-
tron crystallography (Grigorieff et al., 1996; Mitsuoka et al., 1999) and AFM (Figs. 10
and 11) and X-ray diffraction (Belrhali et al., 1999; Essen et al., 1998; Luecke et al.,
1998; Sato et al., 1999) at high resolution. This provided an excellent opportunity to
assess the quality of the AFM topographs recorded from purple membrane and to un-
derstand the implications of combining AFM data with the other structure determination
methods. Six bacteriorhodopsin atomic models werecombinedand compared to the AFM
Fig. 13 Quantitative analyses of the native cytoplasmic bacteriorhodopsin surface. (A) Correlation average of the AFM topograph recorded at an
applied force of 100 pN (M¨uller, Sass et al., 1999). Regions with enhanced flexibility are derived from SD maps and superimposed in red to white
shades. The vertical brightness range of topograph corresponds to 1 nm. The raw image is displayed as a relief tilted by 5
◦
. (B) Mapping the structural
variance of bacteriorhodopsin on the atomic model and the AFM envelope. The atomic model is an average of six models derived from electron and
X-ray crystallography, with the coordinate variance mapped from blue (low variance) to red (high variance). The surfaces are derived from the AFM
height images, with the SD mapped onto each surface from blue (low SD) to red (high SD). The minimum separation between the surfaces is ∼4 nm.
Calculations are as given in Heymann et al., 1999. (C) Cytoplasmic surface with each bacteriorhodopsin monomer displaying a different surface property.
The surface loops are shown as backbone tracings colored according to the backbone coordinate root-mean-square deviation (SD) calculated after merging
five different atomic models of bacteriorhodopsin (Heymann et al., 1999). The gray scale image shows the height map determined by AFM (Fig. 2); the
prominent protrusion is the EF loop. The colored monomers represent the coordinate variation (SD) between the atomic models and the SD of the height
measured by AFM, respectively. Height and SD maps determined by AFM correlate amazingly well to corresponding data from X-ray and electron
crystallography. (See Color Plate.)
278 M¨uller and Engel
data to determine the value and reliability of each source of information (Heymann
et al., 1999).
Figure 13B shows one atomic model suspended within an envelope of the purple
membrane reconstructed from the AFM data (Fig. 13A). The ribbon diagram is color
coded according to the coordinate variance between the different atomic models, while
the surfaces are mapped with the standard deviation of the AFM topographs. There is an
excellent correspondence between the surface loops of the bacteriorhodopsin model and
the AFM envelope. SD maps of the height measured by AFM corresponds well with both
the relative distribution of B-factors of the atomic models and the coordinate variance
between the models (Fig. 13C). This agrees with the notion that the major difference
between the various structural studies lies in the surfaces.
In both the electron crystallography and the AFM experiments, a 2D crystal of bacte-
riorhodopsin close to its native state was imaged, allowing surface loops the maximum
possible conformational freedom. In X-ray crystallography, the surface loops were re-
solved, but they were often involved in 3D crystal contacts and consequently their posi-
tions may not represent their true conformational state and variation in vivo. Specifically,
the EF loop appears to adopt different conformations in the 2D assembly of bacteri-
orhodopsin molecules of purple membrane, while it has less conformational freedom in
the 3D crystals. This agrees with electron paramagnetic resonance (EPR) spectroscopy
of spin-labeled cysteine mutants which show a high mobility of the amino acid residues
in the EF loop (Pfeiffer et al., 1999). In contrast to electron and X-ray crystallographic
methods, the AFM was used to image surface structures of bacteriorhodopsin in buffer
solution and at room temperature, i.e., under conditions resembling its physiological
environment. The SD maps of bacteriorhodopsin had a higher peak for the longer and
less structured loop EF than for the BC loop which forms a short β-sheet.
The N- and C-termini of bacteriorhodopsin were not resolved in any of the structural
studies. This suggests high flexibility, and the atomic models and AFM data indicate that
the N-terminus and most of the C-terminus are completely unstructured and averaged
out (see Chapter 3).
VII. Conformational Changes of Native Membrane Proteins
A. Surface Structures Can Change upon Interaction with Adjacent Molecules
Recrystallization of bacteriorhodopsin in the presence of n-dodecyl trimethylammo-
nium chloride (DTAC) yielded well-ordered 2D crystals (Michel et al., 1980). Topo-
graphs of these orthorhombic crystals showed bacteriorhodopsin dimers assembled into
a rectangular lattice with a p22
1
2
1
symmetry and unit cell dimensions of a = 5.8nm
and b = 7.4 nm (Fig. 14A) (Michel et al., 1980). Accordingly, the bacteriorhodopsin
dimers alternately had their cytoplasmic surface or their extracellular surface facing the
stylus. The maximum height difference between the protrusions and the bilayer was
0.81 ± 0.09 nm. Surprisingly, it was not possible to induce conformational changes of
the EF loops in this bacteriorhodopsin crystal form. Increasing the applied force of the
13. Atomic Force Microscopy and Spectroscopy of Membrane Proteins 279
Fig. 14 Native bacteriorhodopsin assembled into an orthorhombic lattice. (A) In this crystal form (p22
1
2
1
)
the rows of bacteriorhodopsin dimers alternate to expose either their cytoplasmic or their extracellular surfaces
to the aqueous solution. The correlation averages are displayed (B) in perspective view (left, shaded in yellow
brown) and (C) in top view (right, in blue) with a vertical brightness range of 1 nm. (D) SD map of (C)
having a vertical brightness range from 0.06 to 0.17 nm. Surface regions exhibiting a SD above 0.12 nm
are superimposed in red to white shades in (B). The outlined regions are presented for comparison with the
extracellular (yellow outline) and cytoplasmic (white outline) slides of bacteriorhodopsin as shown in Figs. 2
and 3. The contact mode topograph was recorded in buffer solution (100 mM KCl, 10 mM Tris–HCl, pH 7.8)
at a loading force of 100 pN. Topographs A and B are displayed as reliefs tilted by 5
◦
.
stylus resulted in the deformation of the whole protein surface rather than in the bending
of a single loop, and it reduced the lateral resolution.
The arrangement of the protrusions on the cytoplasmic face of bacteriorhodopsin
was very distinct when AFM topographs of the orthorhombic in vitro assemblies were
analyzed (Figs. 14B and 14C). The protrusion of the AB loop was shifted by 0.3 nm
compared to the trigonal unit cell (Fig. 10), now being located between the position of
helices A and B (Fig. 14C). The short loop connecting helices C and D was observed as a
discrete protrusion in the orthorhombic lattice, close to its position in the trigonal lattice.
Remarkably, the EF loop was observed as a bean-shaped structure independent of the
applied force (Fig. 14C). The triangular protrusion located between helices B and G may
result from the C-terminus. None of these structures exhibited significant variability, in-
dicating structural stabilization by the different packing arrangement in the orthorhombic
compared to the trigonal lattice. An additional protrusion (Fig. 14C) was observed at
the periphery of each bacteriorhodopsin monomer packed in the orthorhombic lattice,
probably representing bound lipid molecules (Grigorieff et al., 1996).
The observed structural changes suggest that the interactions of the cytoplasmic
polypeptide loops depend on how the bacteriorhodopsin molecules associate. In the
bacteriorhodopsin trimer, there is a crevice between helices A and B and helices E and
280 M¨uller and Engel
D of neighboring monomers (Fig. 14C; outlined). Lipid molecules in this crevice are
stable (Grigorieff et al., 1996) and stabilize the bacteriorhodopsin trimer by specific
interactions with their lipid and headgroup moieties (Essen et al., 1998). This crevice
is not present in the orthorhombic bacteriorhodopsin assembly, and hence the different
molecular interactions probably allow the displacement of the loop connecting helices
A and B (Fig. 14C; white contours). Differences in helix E have also been observed in
X-ray structures from different crystal forms. While the end of helix E was not resolved
in the crystals grown in the cubic lipid phase (Edman et al., 1999; Luecke, et al., 1998;
Luecke et al., 1999a; Pebay-Peyroula et al., 1997), helix E was stable and fully resolved
in the structure by Essen et al. (1998), where crystal contacts along helices F and G
occurred. Accordingly, it was concluded that in the orthorhombic bacteriorhodopsin
crystals the interactions between helices F and G of two adjacent bacteriorhodopsin
molecules affected both the structural appearance and the rigidity of both the EF loop
and the C-terminal region. In addition, the protrusion of loop AB was shifted toward
helix A, away from the intermolecular space, in the orthorhombic lattice.
Similarly, a change of the protrusions of the extracellular surface was observed on
comparing AFM topographs of both native purple membrane and orthorhombic bac-
teriorhodopsin crystal. A detailed discussion of these structural changes is published
elsewhere (Heymann et al., 1999; M¨uller et al., 2000; M¨uller, Sass et al., 1999).
B. Functional Related Conformational Changes of the HPI layer
The multiple functions of the hexagonally packed intermediate (HPI) layer from
Deinoccocus radiodurans are still a matter of debate (Fig. 15). As a typical member
of the outermost surface (S) layers of bacteria (Sleytr, 1997; Sleytr et al., 1993) evi-
dence exists that the HPI layer stabilizes the cell shape and functions as a protective
barrier against hostile factors from the environment, which nutrients, solutes, and waste
products have to cross (Baumeister et al., 1988). The HPI layer, like many other S-layer
proteins, appears to be exceptionally resistant to protease treatment in a nondenaturated
state. Furthermore, it is discussed whether the HPI layers of two neighboring bacteria
form connexons to enable cell–cell communication (Baumeister and Hegerl, 1986). As
revealed from electron microscopy and crystallography studies (Baumeister et al., 1986;
Engel et al., 1982; Rachel et al., 1986) the HPI layer consists of a single type of pro-
tomer, six of which form a pore. The stable framework of the HPI layer is created by
protomer–protomer contacts between neighboring pores.
AFM topographs of the HPI layer reveals the structural difference between the outer
(Fig. 16) and the inner surface (Fig. 17). Both surface structures show six protomers
forming hexameric rings surrounding a central pore and arranged in a hexagonal lattice
(a = b = 18 nm). Each protomer of a pore is connected to a protomer from the adjacent
pore. These intermolecular links are thought to be the basis for the unusual stability
of the HPI layer. While these distinct arms emanating from the hexamers exhibit a
clockwise rotation at the outer surface, they exhibit an anticlockwise rotation at the
inner surface. The outer surface of the HPI layer consists of donut-shaped hexamers,
13. Atomic Force Microscopy and Spectroscopy of Membrane Proteins 281
Fig. 15 Suggested functions of the hexagonally packed intermediate (HPI) layer from D. radiodurans. Al-
though most of the functions of surface (S) layers, a family to which the HPI layer belongs, remain enigmatic
they must be regarded as multifunctional. As well as providing the cells with a molecular sieve controlling
the passage of molecules into and out of the cell by filtrating large molecules, S layers may mediate cell–cell
contacts and communication, interact with other macromolecules such as phage receptors, or mediate adhesion
to other surfaces. Schematic drawing adapted according to Baumeister and Hegerl (Baumeister and Hegerl,
1986).
featuring six V-shaped protrusions (Fig. 16), seen more clearly in the correlation average
(Fig. 3F).
Most interestingly, it appears that individual pores of the inner HPI-layer surface can
exist in either an unplugged (circles) or a plugged (squares) conformation (Fig. 17; top
left). As demonstrated by time-lapse AFM topographs (Fig. 17; top right), the pores can
reversibly change their conformation (M¨uller, Baumeister et al., 1996). After transla-
tional and angular alignment of single pores form the HPI layer, a multivariate analysis
of 330 pores from 10 different topographs was performed. The averages of the two major
classes, both showing six subunits of the core and their emanating arms, exhibit either
an “open” or a “closed” pore. Figure 17(bottom) displays a montage of the calculated
and sixfold symmetrized topographies of both conformations. Protrusions located at the
core were arranged on an equilateral hexagon of side length 4.0 ± 0.2 nm. The height
difference to the emanating protrusions was 2.5 ± 0.2 nm, while the maximum height
of the protrusions was 2.9 ± 0.3 nm. The depression in the open conformation of the
core was 1.8 ± 0.5 nm, and the depression over the protrusion of the closed confor-
mation was 1.0 ± 0.5nm(M¨uller, Baumeister et al., 1996). This suggests that the HPI
layer serves as a molecular sieve with an open and a closed state (Fig. 17; bottom).
282 M¨uller and Engel
Fig. 16 Outer surface of the HPI layer. AFM topographs recorded in buffer solution (pH 7.8, 10 mM
Tris–HCl). See Fig. 3 for the correlation average. Vertical brightness range of the contact mode topograph
corresponds to 4 nm. Raw data are displayed as a relief tilted by 5
◦
.
The lack of functional and structural data, however, prevents this hypothesis from being
confirmed.
C. Functional Related Conformational Changes of OmpF Porin
The outer membranes of Gram-negative bacteria protect the cells from hostile factors
such as proteolytic enzymes, bile salts, antibiotics, toxins, and low pH. Uptake of small
nutrients and release of metabolites are facilitated by passive pores, the porins. E. coli
outer membranes contain approximately 10
5
porins per cell that allow passage of small
solutes, <600 Da (Nikaido and Vaara, 1985). In addition to nutrients, antibiotics that need
to cross the outer membrane for binding to their targets diffuse through these aqueous
pores (Nikaido, 1989). Conductance measurements have shown that the porin OmpF
trimer exists in either open or closed states, depending on the transmembrane potential
(Lakey, 1987; Schindler and Rosenbusch, 1978). The critical voltages (V
c
≈ 90 mV for
OmpF porin), above which channels close, is affected by the pH (Todt et al., 1992),
membrane-derived oligosaccharides (Delcour et al., 1992), polysaccharides (Schindler
and Rosenbusch, 1981), polycations (dela Vega and Delcour, 1995), and pressure (Le
Dain et al., 1996). Although the structures of several porins have been solved (Cowan
13. Atomic Force Microscopy and Spectroscopy of Membrane Proteins 283
Fig. 17 Conformational change of individual pores of the HPI-layer. Top left: inner surface of the HPI
layer as imaged by contact mode AFM in buffer solution. Protomers of the hexameric pores are clearly visible.
Individual pores can exist in an open (circles) and a plugged (square) conformation. Top right: imaging of the
same surface after 5 min demonstrates that some of the pores have changed their conformation. This confor-
mational change is fully reversible and can be observed over hours. Bottom: surface relief of both the averaged
open and closed conformations. The correlation averages of both the open and the closed conformations were
sixfold symmetrized and then assembled in the montage. The distinct arms emanating from the cores of the
hexamers exhibit an anticlockwise rotation. The distance between adjacent pores is 18 nm. The full grey level
range of all contact mode topographs corresponds to 3 nm vertical distance. Average is displayed as a relief
tilted by 5
◦
.
284 M¨uller and Engel
et al., 1992; Schirmer, 1998; Weiss et al., 1991), the nature of channel closure is poorly
understood. The transmembrane pore of OmpF is formed by 16 antiparallel β-strands
that are connected by short loops on the periplasmic surface and long extracellular loops.
One of the latter folds into the barrel, thus constricting the eyelet of the channel. This
loop was proposed to move upon membrane potential changes (Schulz, 1993), thereby
closing the channel. However, recent results exclude this movement of the constriction
loop (Phale et al., 1997). Therefore, other effects must explain the closure of porin
channels (Klebba and Newton, 1998).
The structurally and functionally well-characterized bacterial porin OmpF is an ex-
cellent structure to assess in depth the ability of the AFM to monitor conformational
Fig. 18 Conformational changes of porin OmpF. (A) Extracellular surface of OmpF. The comparison
between the atomic model rendered at 0.3 nm resolution (left). An AFM topograph (right) illustrates that the
loops which protrude 1.3 nm from the bilayer are flexible. The asterisks mark the twofold symmetry axis of the
rectangular unit cells housing two porin trimers. (B) pH-dependent conformational change of the extracellular
surface. At pH ≤ 3 the flexible loops reversibly collapse toward the center of the trimer, thereby reducing their
height by 0.6 nm. (C) Conformational change of porin induced by an electrolyte gradient. The monovalent
electrolyte gradient across the membrane was >300 mM. Similar to the pH-dependent conformational change,
the extracellular domains reversibly collapsed onto the porin surface. Contact mode topographs exhibit a
vertical range of 1.5 nm (A) and 1.2 nm (C and D) and are displayed as reliefs tilted by 5
◦
.
13. Atomic Force Microscopy and Spectroscopy of Membrane Proteins 285
changes. The short polypeptide loops at the periplasmic surface (Fig. 12) and the long
loops at the extracellular surface (Fig. 18A) are observed on individual porin trimers
in the AFM topographs (Fig. 18A; right). The variable extracellular loops protrude by
1.3 nm above the bilayer at neutral pH. Three conditions have been demonstrated to in-
duce the collapse of this flexible domain toward the trimer center to form a structure with
a height of only 0.6 nm (M¨uller and Engel, 1999): (i) application of an electric potential
>200 mV across the membrane, (ii) generation of a K
+
gradient >0.3 M (Fig. 18B),
and (iii) acidic pH (≤3) (Fig. 18C). The last condition suggests a protective function:
E. coli cells passing through the acidic milieu of a stomach may survive longer by
closing the outer membrane pores. The first condition, however, is compatible with
results from black lipid membrane and patch-clamping experiments which demon-
strated that porin acts as a voltage-gated channel (Delcour, 1997; Klebba and Newton,
1998).
VIII. Observing the Assembly of Membrane Proteins
The Schiff base of bacteriorhodopsin reacts with reagents such as hydroxylamine on
illumination with light (Oesterhelt et al., 1974). This chemical reaction results in the
breakage of the Schiff base bond between the bacteriorhodopsin and the retinal yielding
the apoprotein bacterioopsin and retinaloxime. Consequently, the absorption maximum
of purple membrane at 568 nm diminishes, and the absorption maximum of retinaloxime
at about 366 nm is observed (Oesterhelt et al., 1974). These spectral changes depend
upon the illumination time and reflect the photobleaching process of purple membrane
(Fig. 19A). The loss of the Schiff base bond leads to structural changes in the apoprotein
(Bauer et al., 1976; Becher and Cassim, 1977). As observed using AFM, the process
of photobleaching was associated with the disassembly of the purple membrane crystal
into smaller crystals (Fig. 19B). The bleached purple membrane had entirely lost most
of its crystalline nature (Fig. 19C). High-resolution topographs showed the progressive
separation of bacteriorhodopsin trimers, first along distinct lattice lines and later all over
the membrane. Furthermore, the topographs showed that the bacterioopsin molecules
remained in their trimeric assembly during the entire photobleaching process. Regener-
ation of the photobleached membranes into fully active purple membrane resulted in the
renewed association of the bacteriorhodopsin trimers into a trigonal crystal (Fig. 19D).
The regenerated membranes exhibited similar diameter, thickness, and crystallinity to
native purple membrane (M¨oller et al., 2000).
From these results, it can be concluded that the transformation of bacteriorhodopsin
into bacterioopsin changes the interactions between the trimers. Such interactions might
result from changes in the tertiary structure of the protein. Since the bacteriorhodopsin
trimer remains stable during the entire course of photobleaching, it might be concluded
that major structural changes occur at the rim of the trimer were it interacts with adjacent
lipids. These interfaces are lined by the transmembrane α-helices E and F and by helix G
of bacteriorhodopsin to which the retinal is bound. Cleavage of the Schiff base is followed
by both a reversible change of these interfaces and a disassembly of the two-dimensional
purple membrane crystal.