Wrox Professional Crystal Reports for Visual Studio NET Second Edition phần 3 ppsx
Bạn đang xem bản rút gọn của tài liệu. Xem và tải ngay bản đầy đủ của tài liệu tại đây (2.1 MB, 38 trang )
02 557300 Ch02.qxd 3/24/04 9:24 AM Page 54
Chapter 2
Special Field Name Description
Record Number An internal, sequential record number assigned to all records
returned to the report
Page Number Page number
Group Number An internal, sequential number assigned to all groups
Total Page Count The total page count
Report Title The report title, as saved in the report file’s Summary
Information
Report Comments The comments entered in the Summary Information
Record Selection Formula The Record Selection Formula used by the report
Group Selection Formula The group selection formula used by the report
File Path and Name The full path and filename of the report file
File Author The author of the report from the report file’s Summary
Information
File Creation Date The date the report file was created
Page N of M Where N is the current page and M is the total page count
Summary Fields
Earlier in the chapter, we looked at creating a report using the Standard Expert. One of the tabs in the
expert was for Total, where a summary field could be inserted into your report. Summary fields are
usually associated with groups or a grand total in your report and can be inserted into your report by
right-clicking anywhere within the Report Designer and selecting Insert → Summary from the menu
that appears. This opens the dialog shown in Figure 2-27.
At this point, you may also notice that the right-click menu includes an option for Subtotal; subtotals
and summary fields are similar, but a subtotal refers specifically to a sum, whereas a summary field
could be a sum, an average, or a standard deviation.
Formula Fields
Crystal Reports .NET features a rich formula language that has evolved over the years as a powerful
way to add complex calculations to reports. Formula fields appear in curly braces and are prefixed by
the
@ symbol; a formula used within another formula would look like this:
{@SalesTax} + {@InvoiceTotal}
Formula fields are created using the integrated Formula Editor. To see the editor, right-click Formula
Fields in the Field Explorer, select New, enter a name, and then click OK to open the dialog shown in
Figure 2-28.
54
02 557300 Ch02.qxd 3/24/04 9:24 AM Page 55
Getting Started with Crystal Reports .NET
Figure 2-27
Figure 2-28
55
02 557300 Ch02.qxd 3/24/04 9:24 AM Page 56
Chapter 2
When working with formula fields, you have a choice of two different types of syntax: Crystal Syntax or
Basic Syntax. If you have worked with Crystal Reports before, you will probably be familiar with Crystal
Syntax. It was the original formula language available with Crystal Reports and is still used for Record
Selection Formulas and conditional formatting.
Basic Syntax was introduced to eliminate the need to learn a second formula syntax. The syntax, func-
tions, and control structures are similar to Visual Basic, which many developers are familiar with, and it
is easy for developers to create formulas using a language that is familiar to them.
Which language you use depends on what facet of Crystal Reports you are working with. As I mentioned
earlier, the record and group selection formulas within Crystal Reports are written using Crystal Syntax
exclusively, so you are going to have to learn a little bit anyway. For formulas that will appear on your
report, you have a choice of using either Crystal or Basic Syntax. (You can’t mix the two in one formula,
but you can mix the two different types of formulas in one report.) A drop-down list in the Formula
Editor controls the syntax, and you can switch between the two if required.
Formulas are covered in length in Chapter 8, “Formulas and Logic,” but keep in mind you may see
the Formula Editor appear in other places throughout this book; it is also used to create Record Selection
Formulas and perform conditional formatting, among other things.
Parameter Fields
Parameter fields within Crystal Reports .NET are used to prompt the user to enter information when the
report is run. Parameters can be used in a number of different ways, from simple data entry (like enter-
ing the name of a user to be displayed on the report) to record selection (to filter the content of a report).
Parameter fields are designated using curly braces and are prefixed by a question mark, so a parameter
field in use in a formula might look something like this:
If {?EnterCountry} = “USA” then “North America”
To insert a parameter field into your report, right-click the Parameter Fields section of the Field Explorer
and select New, which will open the dialog shown in Figure 2-29.
Figure 2-29
56
02 557300 Ch02.qxd 3/24/04 9:24 AM Page 57
Getting Started with Crystal Reports .NET
For simple parameters, you will need to give your parameter a name — the question mark prefix will be
added for you — and specify some prompting text and a field type for your parameter. By default,
parameter fields are set to be strings, but there are actually several different types available including:
❑ Boolean
❑ Currency
❑ Date
❑ Date Time
❑ Number
❑ String
❑ Time
You will also need to determine what type of values you want to be entered, such as a discrete value or a
range of values, among others things.
Once you have created your formula field and inserted it into your report, Crystal Reports .NET will dis-
play a default dialog prompting the details just entered (shown in Figure 2-30) whenever your report is
previewed. Most developers find this is a bit too generic for their own use and prefer to create their own
interface with their own forms, including drop-down boxes, and so on. However, if you are not too
concerned about how the prompt appears, this is all you need.
Figure 2-30
57
02 557300 Ch02.qxd 3/24/04 9:24 AM Page 58
Chapter 2
The parameter field can now be used just like any other field in your report: You can place it on your
report and use it in formulas. To use a parameter field with record selection, you will first need to create
a parameter field to accept the input and then to set the record selection to be equal to this parameter
field. For example, if you were going to prompt the user for an invoice number to reprint an invoice, you
would probably want to create a parameter field called
EnterInvoiceId and set the type to be numeric.
From that point, you would need to alter the record selection to use this parameter field. In this instance,
the Record Selection Formula might look something like this:
{Orders.InvoiceId} = {?EnterInvoiceId}
When the report is refreshed, the user will be prompted to enter an invoice ID, which in turn will be
passed to the SQL statement and used to retrieve the records for the report.
An import concept to remember is that the Record Selection Formula must always return a Boolean
value. If the value returned is
True, the record will be returned to the report. If the value is False, it
will just move on to the next record.
SQL Expression Fields
In order to make the most of your database server, Crystal Reports .NET allows you to use SQL
Expression instead of (or in addition to) Crystal Formulas. Using an SQL Expression field ensures that
your calculation will be performed on the database server itself and gives you access to all of the
database functions of SQL.
To create a SQL Expression, right-click SQL Expression Fields in Field Explorer, select New, enter a
name, and select OK.
Once you have created an SQL expression field using the SQL Expression Editor, you can drag the field
from the Field Explorer onto your report, and it will behave just like any other database field.
Unbound Fields
Another definite enhancement to Crystal Reports .NET is the ability to use unbound fields — that is,
fields that are not tied to a specific data source. Using unbound fields, you can create a generic report
and then programmatically set the content of the fields at run time. This is similar to how Crystal
Reports used TTX text files in the past to hold the field structure for a data source, but Crystal Reports
.NET points these fields to a
dataset.
There are seven different types of unbound fields that you can add to your report:
❑ Boolean
❑ Currency
❑ Date
❑ Date Time
❑ Number
❑ String
❑ Time
58
02 557300 Ch02.qxd 3/24/04 9:24 AM Page 59
Getting Started with Crystal Reports .NET
When you drag an unbound field onto your report design, it behaves like a placeholder. When we talk
about integration for Windows and Web Applications in Chapter 4, “Report Integration for Windows-
Based Applications,” and Chapter 5, “Report Integration for Web-Based Applications,” you will learn
how to bind data from your project with this field and display the same data in your report. For now,
you need to know that until run time, these fields will look and act like formula fields (right down to an
@ prefix on each), but they are actually unbound fields that will be used later.
Summary
In this chapter, we have looked at a simple report methodology and the process behind designing
reports and then moved on to actually creating a report using one of the experts that ships with the
product. We also had a brief look at some report design concepts and the Report Designer itself before
moving to some more advanced report design topics and finally finishing up with a short overview on
optimization.
This chapter covered:
❑ Planning your report design
❑ Creating a report using an expert
❑ Working with the report design environment
❑ Report design basics
With a little bit of basic report design under our belts, we are ready to move to the next chapter, where
we will dig deeper into the report designer and learn some of the techniques you can use to create
presentation-quality reports.
59
02 557300 Ch02.qxd 3/24/04 9:24 AM Page 60
03 557300 Ch03.qxd 3/24/04 9:40 AM Page 61
Designing Reports
In the last chapter we started looking at report design by creating a report, using one of the experts
to walk through the report design process. Although that was probably enough information to get
you started designing your own reports, the material really didn’t go into some of the more
advanced report design features.
In this chapter, we will be looking at the some of these advanced features, which include:
❑ Working with databases
❑ Working with groups
❑ Working with summaries
❑ Creating running tools
❑ Using cross-tabs
❑ Working with charts
❑ Understanding subreports
❑ Creating and using parameter fields
The Sample Files
In the C:\Crystal.NET2003\Chapter03\ folder, you will find the sample report and application
we build in this chapter:
❑
CustomerOrders — a report that we will create from scratch using the Report Designer
❑
ViewerDemo — a small application that you can use to preview the reports in this chapter
03 557300 Ch03.qxd 3/24/04 9:40 AM Page 62
Chapter 3
Creating a New Report
Earlier we looked at how to create a report using the report experts. Although they provide an easy way
to get started, you will sometimes want to create your own reports from scratch. To create a new report
from scratch, open or create a new project, select Project → Add New Item, and select Crystal Report
from the list of available templates. Enter “regionalsales.rpt” in the name field and click Open to insert
the new report into your application. Just like with the report we created from the expert, a separate tab
will appear for the report, and the Crystal Report Gallery will open, as shown in Figure 3-1.
Figure 3-1
Select the option to create your report “As a Blank Report” and click OK to open the integrated Report
Designer and start building your report, piece by piece.
Working with Databases and Tables
Now that you have created your report, you need to specify where the data for this report is located. To
add a database or table to your report, right-click your report and select Database → Add/Remove
Database to open the Database Expert shown in Figure 3-2.
There are a number of different types of data sources available, and though these were covered in
Chapter 2, “Getting Started with Crystal Reports .NET,” they have been included again in the following
table for your reference:
62
03 557300 Ch03.qxd 3/24/04 9:40 AM Page 63
Designing Reports
Figure 3-2
Data Source Description
Project Data Crystal Reports .NET can leverage the ADO .NET Framework and
report directly from datasets that appear in your application. For
more information on how Crystal Reports .NET can be used with
ADO .NET data, please see Chapter 7, “Working with .NET Data.”
OLE DB (ADO) This folder is for data sources that can be accessed through OLE DB,
including SQL Server, Oracle, and Microsoft Jet 3.51/4.00–accessible
data sources (Access, Excel, Paradox, Dbase, and so on).
ODBC (RDO) This folder is for data sources that can be accessed through an
ODBC-compliant driver (which is just about every other data
source). In addition to reporting from tables, views, stored proce-
dures, and so on, Crystal Reports .NET will also allow you to
enter an SQL command to serve as the basis for your report.
Database Files This folder includes a number of file-type database formats,
including Access, Excel, XML, and Crystal Field Definition files
(TTX), used with previous versions of Crystal Reports and
bound reporting.
More Data Sources These include reporting directly from XML files, Access/Excel
through DAO, and Crystal Field Definition Files (TTX).
63
03 557300 Ch03.qxd 3/24/04 9:40 AM Page 64
Chapter 3
Adding a Data Source to Your Report
Locate the type of datasource you would like to add to your report and expand the data source folder.
Depending on what type of datasource you select, an additional dialog may open. For example, if you
select ODBC (RDO), a second dialog will open and prompt you for an ODBC data source. Likewise, if
you select Access/Excel (DAO) under More Data Sources, a second dialog will open and allow you to
select a spreadsheet or database to report from.
In this instance, we are working with the ODBC data source labeled “Xtreme Sample Database 2003,” so
once you have selected this data source, your Database Expert should look something like Figure 3-3.
Figure 3-3
There are three additional nodes shown underneath your datasource: The Tables and Views nodes con-
tain a list of all of the tables and views in the data source you have selected, and the Add Command
option allows you to enter a SQL statement to serve as the basis for your report, which we will look at
a little later.
You can also report off of stored procedures, system tables, and other objects. To turn this option on,
right-click your report and select Designer → Default Settings. Under the Database tab, click the show
options for the types of objects (tables, views, stored procedures, and so on) you want to report from.
64
03 557300 Ch03.qxd 3/24/04 9:40 AM Page 65
Designing Reports
In this case we will be reporting off of tables within our sample data source, so expand the Tables node,
select the Customer table, and then use the right-arrow icon to add it to the list of selected tables.
Likewise, select the Orders table using the same process.
Because we have selected two tables, an additional Links tab will appear on the Database Expert (shown
in Figure 3-4). This tab will allow us to specify the relationship between these two tables.
Figure 3-4
Using the options shown in the Links tab, you can draw links or joins between the databases and tables
in your report to indicate the relationship between each. To specify a link between two fields, drag the
first field and drop it on top of the second.
If you make a mistake, you can remove a link by clicking the line to highlight it and then pressing the
Delete key or, to clear all links, clicking the Delete button on the right side of the expert. This option is
especially handy when Crystal Reports automatically attempts to use smart links in the tables you have
selected.
By default, Crystal Reports will join two SQL tables with an Inner Join. To change the default join type,
right-click directly on top of the line drawn between the two tables and select Link Options from the
right-click menu to open the dialog shown in Figure 3-5.
65
03 557300 Ch03.qxd 3/24/04 9:40 AM Page 66
Chapter 3
Figure 3-5
Using the Link Options dialog, select a join type for this link from the list. Your choices are:
❑ Inner Join
❑ Left Outer Join
❑ Right Outer Join
❑ Full Outer Join
You can also use this dialog to select a link type using one of the comparison operators (=, >, >=, <, <=,
and !=). When you are finished specifying the join type, click the OK button to return to the Links tab.
If you are working with a large number of tables, you may want to consider using the Auto-Arrange
option found on the right-hand side of the Links tab. Click the Auto-Arrange button, and Crystal
Reports will arrange the tables within this dialog to make viewing the layout and joins a bit easier.
By default Crystal Reports will auto-link the tables you have selected for your report, based on the field
name and key fields found in the tables. To use this option yourself, select either the By Name or By Key
options within the Links tab, and then click the Auto-Link button.
If you are unsure about how accurately this will link the tables in your report, don’t forget that you can
always remove individual links by highlighting the link to be deleted and then either pressing the Delete
key on your keyboard or clicking the Delete Link button. You also have the option of removing all links
66
03 557300 Ch03.qxd 3/24/04 9:40 AM Page 67
Designing Reports
by clicking the Clear Links button. If you have multiple links, you can use the Order Links button to
specify in what order these links will be evaluated.
With your database linking in place, click OK to return to your report design. You can now start adding
fields to your report. At the end of the last chapter, we had a look at the different types of fields you
could add to a report. For the sample report we are working on, we want to add some database fields,
as we will be using these fields later to demonstrate some advanced reporting features.
To do so, open the Field Explorer and drag the following fields onto your report’s detail section:
❑ Customer.Customer Name
❑ Customer.City
❑ Customer.Region
❑ Customer.Country
❑ Orders.Order Date
❑ Orders.Order Amount
Your report should now look something like Figure 3-6.
Figure 3-6
67
03 557300 Ch03.qxd 3/24/04 9:40 AM Page 68
Chapter 3
If you ever need to remove a table or database from your report, it is pretty simple: Select Database →
Add/Remove Database, highlight the table you want to delete, and use the left arrow to remove it from
the list of selected tables. If fields from the database you are trying to remove have been used in your
report, you will receive the warning message “There are fields in the report from this file. Continue?”
Click OK to continue and remove the file, or click Cancel to leave the database or table in your report.
When you are finished, you will be returned to your report design.
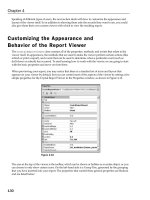
Setting the Data Source Location
Another handy feature is the ability to change the database location of your reports. You can design a
report on your test database, for example, and then later point it to a production database where your
data resides. To change the database location of your report, select Database → Set Location to open the
dialog shown in Figure 3-7.
Figure 3-7
Use the drop-down list to select the Current Data Source you would like to change, and then locate the
replacement data source in the list of data sources on the right. Click to highlight the replacement data
source, and then click the Replace button to make it happen.
If you have subreports that use the same data source and you want to switch them over at the same
time, leave the check box in the bottom left corner of the dialog checked.
If you are using multiple databases or tables in your report, a prompt will appear with the question
“Propagate database and server changes across tables with the same original information?” Clicking Yes
sets the location for all of the other databases or tables in your report; clicking No changes the location of
only the one particular database or table you have chosen.
When you are finished setting the location, click the Close button to return to your report design.
68
03 557300 Ch03.qxd 3/24/04 9:40 AM Page 69
Designing Reports
If the data structures differ between the old database or table and the new location you have selected, a
Map Fields dialog will appear, and you will have to map any unfound fields in your report to fields in
the new database structure.
Verifying Database Structures
As your database structures evolve and change, reports you have created from these structures may no
longer work because of different field names, types, and so on. To ensure that the changes made in the
database are reflected and accounted for in your existing reports, you will need to verify the database
that they were created from after any changes by selecting Database → Verify Database. If you have
databases or tables in your report that are not used, you may receive the message “Verify files in report
that are not used?” Click Yes to proceed.
At this point, Crystal Reports will run through the data structures in your report and verify that nothing
has changed. If all of the data structures are unchanged, you will receive the message “The database is
up to date.”
If anything has changed in the data structures, you will receive the message “The database file xxx has
changed. Proceeding to fix up the report.”
If Crystal Reports finds simple changes, such as a database field that has been extended or a decimal
place that has changed, it will simply update its version of the data structures and display the message
“The database is up to date.”
If Crystal Reports finds a major change (such as a missing field name or a changed field type), it will
open a field mapping dialog and allow you to map fields from the old data source that are not found in
the new data source. (This often happens when field names change.)
With a little database work out of the way, we can move on to adding some extra value to your reports
through grouping, which is what we will look at in the next section.
Working with Groups
We looked at groups briefly in Chapter 2, “Getting Started with Crystal Reports .NET,” as this was an
option in the expert that we used to create your first report. In Crystal Reports, grouping is used to place
similar records together. For example you may have a Products table in your database that lists all of the
products your company sells, including information like the product name, product type, product class,
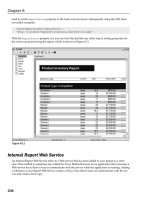
and so on. For example, if you were to insert a group based on the product class field, all of the records
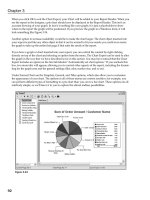
that had the same product class would be grouped together, like in the report shown in Figure 3-8.
Within a report, groups are used to organize your report data to make the report more readable and to
make it easier to find information quickly. In addition, groups also allow you to create summaries that
will give you the values such as the sum, average, maximum, and minimum within that group. In the
following sections we are going to look at how to insert and format groups, and then a little later we
will look at adding summaries and calculations based on these groups.
69
03 557300 Ch03.qxd 3/24/04 9:40 AM Page 70
Chapter 3
Figure 3-8
Inserting a New Group
To insert a new group into your report, right-click any blank area within your report and select Insert →
Group. This opens the dialog shown in Figure 3-9.
The first choice you will need to make is which field you want to group on. This can be a database
field, a formula field, or an SQL expression. Use the drop-down list provided to select a field. The fields
that have been inserted onto your report will appear at the top of the list, and the fields from the
database tables that have been added to your report will follow, regardless of whether these fields are
used in the report or not. Remember, you don’t need to actually show a field on your report to use it in
a group.
Once you have selected the field you want to use, you will need to select the order for your group; by
default, this is set to Ascending, which means your groups will be arranged from A–Z, 1–9, and so on. In
Chapter 2, “Getting Started with Crystal Reports .NET, “ we had a look at the different sorting orders
available for groups, but here they are again for reference.
Sort Order Description
Ascending For ordering the data from A–Z, 1–9, and so on.
Descending For ordering the data from Z–A, 9–1, and so on.
Original If your dataset is already sorted, this option will leave the data in its
original sort order.
Specified Used for creating your own custom groups and setting some criteria.
Any records that meet the criteria would belong to the specified group.
70
03 557300 Ch03.qxd 3/24/04 9:40 AM Page 71
Designing Reports
Figure 3-9
And finally, at the bottom of the dialog are some grouping options that are optional. We’ll look at these a
little later in this chapter.
If you had selected a date or date-time field for your group, you would also have an additional option to
set for how the groups would be broken down (by day, week, month, quarter, and so on).
For now, all you need to do to create a group is to select a field, pick a sort order, and click the OK button. If
you were to add a group to the report we have been working on by using the Customer.Customer Name
field, your group would be inserted onto your report, which would look something like Figure 3-10.
You’ll notice that there are two additional sections added to your report for the group header and group
footer, and a special field labeled “Group #1 Name” has been inserted in the group header.
This special field is called a Group Name field and is used to label the groups within your report. Remember
in our earlier example when we had a group on a Product Class field? The Group Name field is used to
display the name of each group, so from our earlier example it would display “Accessory” for the first
group and then “Bicycle” for the second. Although this is a special field, you can customize the name that
appears for each group, which we will also look at a little later in this chapter.
71
03 557300 Ch03.qxd 3/24/04 9:40 AM Page 72
Chapter 3
Figure 3-10
Changing Groups
To change the existing groups that appear on your report, right-click the group header or footer and
select Change Group from the right-click menu to open the Change Group Expert shown in Figure 3-11.
Figure 3-11
72
03 557300 Ch03.qxd 3/24/04 9:40 AM Page 73
Designing Reports
Select the group you want to change from the list and click Done, which opens a dialog similar to the
one used to create the group. You can also change the order that groups appear in your report by using
the up and down arrows on the right-hand side.
Deleting Groups
To delete a group from your report, locate the group header or footer, right-click directly on top of it and
select Delete Group. This will delete the group, including the group header and footer and, more impor-
tantly, all of the fields that are present in either of these sections. So if you want to preserve the format-
ting you may have applied to this section or the fields it contains, move these fields out of the section
before deleting. If you do delete the group by mistake, you can use Undo (Ctrl-Z) to undo the delete and
get the group back.
Formatting Groups
Once you have groups inserted into your report, the easiest way to format them is through the Group
Name field. This special field is placed on your report automatically whenever you create a group and
can be formatted just like any other field: You can change the font, size, and so on. If you have deleted
your Group Name field or want to put it in a different location, you can insert a new Group Name field
by locating the field in the Field Explorer under the Special Fields section, as shown in Figure 3-12.
Figure 3-12
73
03 557300 Ch03.qxd 3/24/04 9:40 AM Page 74
Chapter 3
You can also customize the group name field by right-clicking in the group header or footer and select-
ing Change Group from the right-click menu. Then select the group you want to work with and click
Options to open the dialog shown in Figure 3-13.
Figure 3-13
By default, Crystal Reports will automatically create the group name for you based on the field you are
grouping on, but you can override this option. In the bottom of the dialog, select the Customize Group
Name Field check box. For selecting a new group name, you have two options. If the group name that
you want to use is stored in a database table and has a direct relationship to your group field, you can
use the drop-down list to select an existing field.
An example of this would be a report that grouped on Product Type and was a reference number (for
example, 001, 002, or 003). If you had a lookup table that stored the reference number and the descrip-
tion of the product type (that is, 001 = “Mountain Bikes”, 002 = “Racing Bikes”), you could use this table
to display a proper name instead of the product type number.
If you don’t have a table that stores this information or if you want to do a more complex lookup for the
group name, you can select the option immediately below to “Use Formula as Group Name” and then
click the X+2 icon to open the formula editor and enter a formula to derive the group name.
For more information on working with formulas, check out Chapter 8, “Formulas and Logic.”
This formula should take the format of an if then statement with the output being the group name itself
(for example,
if {Customer.Country} = “USA” then “United States”}).
74
03 557300 Ch03.qxd 3/24/04 9:40 AM Page 75
Designing Reports
You may also notice there are two additional settings at the bottom of the Change Group Options dialog.
The Keep Group Together setting is designed to help eliminate orphaning of groups across multiple
pages. (This sometimes works with mixed results.) The second option, Repeat Group Header On Each
Page, will repeat the header section of your group on every page of your report. This can be handy for
large reports that have multiple pages of the same group; with the group header at the top, you will
always know where you are in the report’s structure.
And finally, the last formatting option we probably need to look at is how to throw page breaks between
groups. You won’t find this option on any of the dialogs we have used to create or edit groups. This set-
ting is related to the section formatting options we looked at in Chapter 2 when we had our first look the
Section Expert. Right-click either the group header or footer and select Section Expert from the right-
click menu to open the dialog shown in Figure 3-14.
Figure 3-14
Select the section where you want to throw the page break and then use the check boxes on the right
side of the dialog to select either the New page before or New page after option, depending on your
requirements.
Record Sorting
Another tool that you have to help organize your reports is record-level sorting. Record-level sorting is
similar to grouping in that it orders the records according to the criteria you specify (for example, alpha-
betically by country). However, the difference is that record-level sorting leaves the records in one big
group. In the earlier example of grouping, the records were grouped by country and put in order so that
each country had its own group, group header and footer, and so on. If we had performed a sort on
those same records, they would have been ordered but left in one large list.
75
03 557300 Ch03.qxd 3/24/04 9:40 AM Page 76
Chapter 3
To add record-level sorting to your report, right-click your report in a blank area and select Report →
Sort Records to open the dialog shown in Figure 3-15.
Figure 3-15
Select the field(s) that you want to use for your sort and move it from the list on the left to the list on the
right by highlighting the field and clicking Add. In the report we have been working through in this
chapter, add the field Orders.Order Date so that all of the records within the group will be ordered by
the date the orders were placed.
If you want to change the sort order, you will need to remove all of the fields and then add them back in
the correct order.
Working with Summaries
Simple summary fields include sum, average, minimum, maximum, and other calculations that do not
require any additional criteria. Summaries are most often used with groups and will appear on the
group footer if a group has been selected. If you selected the option to create a Grand Total, these will
always appear in the report footer on the very last page of your report.
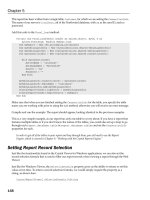
Inserting a Summary Field
To create a simple summary field, click the field that you want to summarize and select Insert →
Summary to open the dialog shown in Figure 3-16.
76
03 557300 Ch03.qxd 3/24/04 9:40 AM Page 77
Designing Reports
Figure 3-16
You will need to select a summary operator from the drop-down list at the top of the dialog, as well as
which group the summary should be inserted into. If you would like this summary to be calculated as a
percentage of a grand total, you can use the check box at the bottom of the dialog to enable this option
and the drop-down list to select the grand total field. This feature is especially handy when used along-
side sums and averages. For instance, if you were creating a report on international sales, you could
show the dollar amount (sum) for each country and the average sales, as well as a percentage value
representing that country in the total sales.
Another real time-saver is the option for inserting summary fields for all of the groups in your report;
this will copy the summary field to the group footers for all of the groups inserted onto your report. And
finally, the last option is for inserting a grand total field, which would appear at the bottom of the report
in the report footer. (You can also insert grand totals independently from the right-click menu you used
to insert the summary field.)
Using the report we have been creating in this chapter, add a summary field to the Orders.Order
Amount field to calculate the sum. Your report should now look something like Figure 3-17.
77
03 557300 Ch03.qxd 3/24/04 9:40 AM Page 78
Chapter 3
Figure 3-17
Changing a Summary Field
After a summary field has been inserted into your report, you can change the summary operation by
locating the summary field that you want to change on your report and selecting Change Summary
Operation from the right-click menu. In the Change Summary dialog, use the drop-down list provided
to change the summary operation and then click OK to accept your changes. The operator change
should immediately be reflected in your report.
TopN/Group Sorting
TopN/Group Sorting is a function of Crystal Reports used to sort groups according to a summary field
that has been created based on that group. This function is often used to determine something like the
top 20 customers (that is, Top N, where N is 20) or the top or bottom five products, and it can also be
used to order groups based on a summary field. Before you can use TopN/Group Sorting in your report,
you need to make sure that you have two things inserted onto your report: a group and a summary
field. Without both of these present, you cannot use TopN/Group Sorting.
78