Engineering Analysis with Ansys Software Episode 2 Part 3 pot
Bạn đang xem bản rút gọn của tài liệu. Xem và tải ngay bản đầy đủ của tài liệu tại đây (1.49 MB, 20 trang )
Ch05-H6875.tex 24/11/2006 17: 8 page 224
224 Chapter 5 Analysis for fluid dynamics
C
D
Figure 5.14 Window of Element Sizes on Picked Lines.
E
F
G
Figure 5.15 Window of Element Sizes on Picked Lines.
Ch05-H6875.tex 24/11/2006 17: 8 page 225
5.2 Analysis of flow structure in a diffuser 225
Table 5.3 Element sizes of picked lines
Line No. NDIV SPACE
115
2 50 0.2
315–
4505
530–
6 50 0.2
730–
8405
9 50 0.2
10 40 0.2
A
Figure 5.16 Window of Mesh
Areas.
B
Figure 5.17 ANSYS Graphics window.
Ch05-H6875.tex 24/11/2006 17: 8 page 226
226 Chapter 5 Analysis for fluid dynamics
A
Figure 5.18 Window of Pan-
Zoom-Rotate.
Figure 5.19 ANSYS Graphics window.
5.2.2.6 BOUNDARY CONDITIONS
In this section, boundary conditions listed in problem description (Section 5.2.1) are
set. By performing the steps mentioned below, all lines need to appear on the window.
Then set the boundary conditions.
Ch05-H6875.tex 24/11/2006 17: 8 page 227
5.2 Analysis of flow structure in a diffuser 227
Command
Utility Menu →Plot→Lines
Command
ANSYS Main Menu →Solution →Define Loads →Apply →Fluid/CFD →
Velocity →On Lines
The window Apply V on Lines opens (Figure 5.20).
A
Figure 5.20 Window of Apply V on Lines.
(1) Pick Line 4 at the entrance of the diffuser and click [A] OK button. Then the
window Apply VELO load on lines as shown in Figure 5.21 opens.
(2) Input [B] 20 to VX box and [C] 0 to VY box. Then, click [D] OK button. The sign
of setting boundary condition appears on ANSYS Graphics window as shown in
Figure 5.22.
(3) Set boundary conditions to all lines listed in Table 5.4.
Ch05-H6875.tex 24/11/2006 17: 8 page 228
228 Chapter 5 Analysis for fluid dynamics
B
C
D
Figure 5.21 Window of Apply VELO load on lines.
Command
ANSYS Main Menu →Solution →Define Loads →Apply →Fluid/CFD →
Pressure DOF →On Lines
The window Apply PRES on Lines opens (Figure 5.23).
(1) Pick Line 9 on ANSYS Graphics window and click [A] OK button. Then the
window Apply PRES on lines opens (Figure 5.24).
Ch05-H6875.tex 24/11/2006 17: 8 page 229
5.2 Analysis of flow structure in a diffuser 229
Figure 5.22 ANSYS Graphics window.
Table 5.4 Boundary conditions for all lines
Line No. VX VY
1–0
2––
300
4200
5–0
6––
700
8–0
9––
10 0 0
Ch05-H6875.tex 24/11/2006 17: 8 page 230
230 Chapter 5 Analysis for fluid dynamics
A
Figure 5.23 Window of Apply PRES on lines.
B
C
Figure 5.24 Window of Apply PRES on lines.
Ch05-H6875.tex 24/11/2006 17: 8 page 231
5.2 Analysis of flow structure in a diffuser 231
Figure 5.25 ANSYS Graphics window.
(2) Input [B] 0 to PRES box and close the window by clicking [C] OK button. The
drawing on ANSYS Graphics window is displayed as shown in Figure 5.25.
5.2.3 Execution of the analysis
5.2.3.1 FLOTRAN SET UP
The following steps are performed to set up the analysis of FLOTRAN.
Command
ANSYS Main Menu →Solution →FLOTRAN Set Up →Solution Options
The window FLOTRAN Solution Options opens (Figure 5.26).
(1) Set [A] Adiabatic, Turbulent, and Incompressible to TEMP, TURB, and COMP
boxes, and, then, click [B] OK button.
Command
ANSYS Main Menu →Solution →FLOTRAN Set Up →Execution Ctrl
Ch05-H6875.tex 24/11/2006 17: 8 page 232
232 Chapter 5 Analysis for fluid dynamics
A
B
Figure 5.26 Window of FLOTRAN Solution Options.
The window Steady State Control Settings opens (Figure 5.27).
(1) Input [A] 200 to EXEC box and click [B] OK button.
Command
ANSYS Main Menu →Solution →FLOTRAN Set Up →Fluid Properties
The window Fluid Properties opens (Figure 5.28).
(1) Select [A] AIR-SI in Density, Viscosity, Conductivity, and Specific heat boxes
and click [B] OK button. Then the window CFD Fluid Properties as shown in
Figure 5.29 opens and click [C] OK button.
Ch05-H6875.tex 24/11/2006 17: 8 page 233
5.2 Analysis of flow structure in a diffuser 233
A
B
Figure 5.27 Window of Steady State Control Settings.
5.2.4 Execute calculation
Command
ANSYS Main Menu →Solution →Run FLOTRAN
When the calculation is finished, the window Note as shown in Figure 5.30 opens.
(1) Click [A] Close button.
Ch05-H6875.tex 24/11/2006 17: 8 page 234
234 Chapter 5 Analysis for fluid dynamics
A
B
Figure 5.28 Window of Fluid Properties.
5.2.5
Postprocessing
5.2.5.1 READ THE CALCULATED RESULTS OF THE FIRST MODE OF
VIBRATION
Command
ANSYS Main Menu →General Postproc →Read Results →Last Set
5.2.5.2 PLOT THE CALCULATED RESULTS
Command
ANSYS Main Menu →General Postproc →Plot Results →Vector Plot →
Predefined
Ch05-H6875.tex 24/11/2006 17: 8 page 235
5.2 Analysis of flow structure in a diffuser 235
C
Figure 5.29 Window of CFD Fluid Properties.
A
Figure 5.30 Window of Note.
The window Vector Plot of Predefined Vectors as shown in Figure 5.31 opens.
(1) Select [A] DOF solution – Velocity V and click [B] OK.
(2) The calculated result for velocity vectors appears on ANSYS Graphics window as
shown in Figure 5.32.
Ch05-H6875.tex 24/11/2006 17: 8 page 236
236 Chapter 5 Analysis for fluid dynamics
A
B
Figure 5.31 Window of Vector Plot of Predefined Vectors.
Figure 5.32 ANSYS Graphics window.
Ch05-H6875.tex 24/11/2006 17: 8 page 237
5.2 Analysis of flow structure in a diffuser 237
5.2.5.3 P
LOT THE CALCULATED RESULTS BY PAT H OPERATION
In order to plot the calculated results for a selected cross section, Path Operation
command is used.
Command
ANSYS Main Menu →General Postproc →Path Operations →Define Path →
By Nodes
The window By Nodes opens (Figure 5.33).
(1) Check [A] Pick and pick two nodes on [B] the wall and [C] the x-axis as shown
in Figure 5.34. If a wrong node on ANSYS Graphics window is selected, delete
the picked node by using Unpick. Click [D] OK button.
(2) The window By Nodes as shown in Figure 5.35 opens. Input the path name [E]
vel01 to Name box [F] 50 to nDiv box and click [G] OK button. Then the window
PATH Command appears as shown in Figure 5.36, which explains the content of
the defined path. Close this window by clicking X mark at the upper right end.
A
D
Figure 5.33 Window of By Nodes.
Command
ANSYS Main Menu →General Postproc →Path Operations →Map onto Path
Ch05-H6875.tex 24/11/2006 17: 8 page 238
238 Chapter 5 Analysis for fluid dynamics
B
C
Figure 5.34 ANSYS Graphics window.
E
F
G
Figure 5.35 Window of By Nodes.
Ch05-H6875.tex 24/11/2006 17: 8 page 239
5.2 Analysis of flow structure in a diffuser 239
Figure 5.36 Window of PATH Command.
The window Map Result Items onto Path opens (Figure 5.37).
(1) Input [A] vel01 to Lab box and select [B] DOF solution and Velocity VX. Then
click OK button.
B
A
Figure 5.37 Window of Map Result Items onto Path.
Command
ANSYS Main Menu →General Postproc →Path Operations →
Plot Path Item →On Graph
Ch05-H6875.tex 24/11/2006 17: 8 page 240
240 Chapter 5 Analysis for fluid dynamics
The window Plot of Path Items on Graph opens (Figure 5.38).
(1) Select [A] VEL01 in Lab1-6 box and click OK button. Then the calculated result
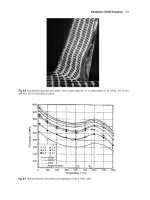
for the defined path appears onANSYS Graphics window as shown in Figure 5.39.
A
Figure 5.38 Window of Plot of Path Items on Graph.
Figure 5.39 ANSYS Graphics window.
In addition, when the values of the defined path are needed, the following steps
can be used.
Ch05-H6875.tex 24/11/2006 17: 8 page 241
5.2 Analysis of flow structure in a diffuser 241
Command
ANSYS Main Menu →General Postproc →List Results →Path Items
The window List of Path Items opens (Figure 5.40).
(1) Select [A] VEL01 in Lab1-6 box and click OK button. Then the list for the defined
path appears as shown in Figure 5.41.
A
Figure 5.40 Window of List Path Items.
Figure 5.41 Window of PRPATH Command.
Ch05-H6875.tex 24/11/2006 17: 8 page 242
242 Chapter 5 Analysis for fluid dynamics
5.3
Analysis of flow structure in a channel
with a butterfly valve
5.3.1 Problem description
Analyze the flow structure around a butterfly valve as shown in Figure 5.42.
0.2 m
0.06 m
30
°
0.07m
Flow Channel
butterfly valve
Figure 5.42 Flow channel with a butterfly valve (photo is quoted from />bidg-jutaku/kyutouyou/index.html).
Shape of the flow channel:
(1) Diameter of the flow channel: D
E
=0.06 m.
(2) Diameter of a butterfly valve: D
E
=0.06 m.
(3) Tilt angle of a butterfly valve: α =30
◦
.
Operating fluid: water
Flow field: turbulent
Velocity at the entrance: 0.01 m/s
Boundary conditions:
(1) Velocities in all directions are zero on all walls.
(2) Pressure is equal to zero at the exit.
(3) Velocity in the y direction is zero on the x-axis.
5.3.2 Create a model for analysis
5.3.2.1 SELECT KIND OF ANALYSIS
Command
ANSYS Main Menu →Preferences
Ch05-H6875.tex 24/11/2006 17: 8 page 243
5.3 Analysis of flow structure in a channel with a butterfly valve 243
5.3.2.2 S
ELECT ELEMENT TYPE
Command
ANSYS Main Menu →Preprocessor →Element Type →Add/Edit/Delete
Then the window Element Types opens.
(1) Click add and then the window Library of Element Types opens.
(2) Select FLOTRAN CFD-2D FLOTRAN 141. Click OK button.
(3) Click Options button in the window Element Types.
(4) The window FLUID141 element type options as shown in Figure 5.43 opens.
Select [A] Cartesian in the box of Element coordinate system and click OK
button. Finally click Close button in the window Element Types.
A
Figure 5.43 Window of FLUID141 element type options.
5.3.2.3 CREATE KEYPOINTS
To draw a flow channel with a butterfly valve for analysis, keypoints on the window
are used to describe it in this section.
Command
ANSYS Main Menu →Preprocessor →Modeling →Create →Keypoints →In
Active CS
(1) The window Create Keypoints in Active Coordinate System opens.
(2) Input the X and Y coordinate values to X, Y, Z Location in active CS box listed
in Table 5.5.