Diffusion Solids Fundamentals Diffusion Controlled Solid State Episode 2 Part 1 pdf
Bạn đang xem bản rút gọn của tài liệu. Xem và tải ngay bản đầy đủ của tài liệu tại đây (583.93 KB, 25 trang )
14.3 Techniques of Mechanical Spectroscopy
243
Fig. 14.5. Internal friction, Q−1 = π tan δ, and frequency dependent modulus, M ,
as functions of ωτ
In this case, a thermally activated process manifests itself in a loss peak,
which shifts to higher temperatures as the frequency is increased. Information on the activation enthalpy is then obtained from the peak temperatures,
Tpeak , shifting with frequencies ω by using the equation:
∆H = −kB
d ln ω
.
d(1/Tpeak )
(14.20)
In the Hz regime torsional pendulums operating at their natural frequencies can be used. A major disadvantage of this technique is that the range of
available frequencies is very narrow, often less than half a decade. This makes
it difficult to determine accurate values of the activation enthalpies and to
analyse frequency-temperature relations in detail. In order to overcome this
limitation devices with forced oscillations are in use. The frequency window
of this technique ranges approximately from 30 Hz up to 105 Hz.
At higher frequencies, the mechanical loss of solids can be studied by
resonance methods [14, 15]. At even higher frequencies, in the MHz and GHz
regimes, ultrasonic absorption and Brillouin light scattering can be used.
However, most mechanical loss studies have been done and are still done
with the help of low-frequency methods.
Starting in the 1990s, there have been efforts to make use of commercially
available instrumentation for dynamic mechanical thermal analysis (DMTA)
These devices usually operate in the three-point-bending mode. Among other
systems, this technique has been applied to study relaxation processes in
oxide glasses [16–18].
244
14 Mechanical Spectroscopy
Fig. 14.6. Octahedral interstitial sites in the bcc lattice
14.4 Examples of Diffusion-related Anelasticty
14.4.1 Snoek Effect (Snoek Relaxation)
The Snoek effect is the stress-induced migration of interstitials such as C,
N, or O in bcc metals. Although effects of internal friction in bcc iron were
reported as early as the late 19th century, this phenomenon was first carefully
studied and analysed by the Dutch scientist Snoek [1]. Interstitial solutes in
bcc crystals usually occupy octahedral interstitial sites illustrated in Fig. 14.6.
Octahedral sites in the bcc lattice have tetragonal symmetry inasmuch the
distance from an interstitial site to neighbouring lattice atoms is shorter along
100 than along 110 directions. The microstrains surrounding interstitial
solutes have tetragonal symmetry as well, which is lower than the cubic symmetry of the matrix. Another way of expressing this is to say that interstitial
solutes give rise to permanent elastic dipoles.
Figure 14.6 illustrates the three possible orientations of octahedral sites
denoted as X-, Y-, and Z-sites. Without external stress all sites are energetically equivalent, i.e. EX = EY = EZ , and the population n0 of interstitial
j
sites by solutes is n0 = n0 = n0 = n0 /3. n0 denotes the total number of
X
Y
Z
interstitials. If an external stress is applied this degeneracy is partly or completely removed, depending on the orientation of the external stress. For example, with uniaxial stress in the Z-direction Z-sites are energetically slightly
different from X- and Y-sites, i.e. EZ = EX = EY . In contrast, uniaxial stress
in 111 direction does not not remove the energetic degeneracy, because all
sites are energetically equivalent. In thermodynamic equilibrium the distribution of interstitial solutes on the X-, Y-, and Z-sites is given by
neq = n0
i
exp(−Ei /kB T )
.
j=X,Y,Z exp(−Ej /kB T )
(14.21)
In general, under the influence of a suitable oriented external stress the ‘solute
dipoles’ reorient, if the interstitial atoms have enough mobility. This redistribution gives rise to a strain relaxation and/or to an internal friction peak.
14.4 Examples of Diffusion-related Anelasticty
245
The relaxation time or the frequency/temperature position of the internal
friction peak can be used to deduce information about the mean residence
time of a solute on a certain site.
In order to deduce this information, we consider the temporal development of interstitial subpopulations nX , nY , nZ on X-, Y-, and Z-sites. Suppose
that uniaxial stress is suddenly applied in Z-direction. This stress disturbs
the initial equipartition of interstitials on the various types of sites and redistribution will start. Fig 14.6 shows that every X-site interstitial that performs
a single jump ends either on a Y- or on a Z-site. Interstitials on Y- and Z-sites
jump with equal probabilities to X-sites. The rate of change of the interstitial
subpopulations can be expressed in terms of the interstitial jump rate, Γint ,
as follows:
dnX
(14.22)
= −2Γint nX + Γint (nY + nZ ) .
dt
The first term on the right-hand side in Eq. (14.22) represents the loss of
interstitials located at X-sites due to hops to either Y- or Z-sites. The second
term on the right-hand side represents the gain of interstitials at X-sites from
other interstitials jumping from either Y- or Z-sites. Corresponding equations
are obtained for nY and nZ by cyclic permutation of the indices. Since the
total number of interstitials, n0 , is conserved, we have
n0 = nX + nY + nZ .
(14.23)
Substitution of Eq. (14.23) into Eq. (14.22) yields
Γint 0
3
dnX
= −Γint nX +
(n − neq ) = − Γint nX − n0 /3 .
X
dt
2
2
(14.24)
Equation (14.24) is an ordinary differential equation for the population dynamics of interstitial solutes. Its solution can be written in the form
nX (t) = neq + n0 − neq exp −
X
X
X
t
τR
,
(14.25)
where the relaxation time τR is given by
τR =
2
.
3Γint
(14.26)
The relaxation time is closely related to the mean residence time, τ , of an in¯
terstitial solute on a given site. Because an interstitial solute on an octahedral
site can leave its site in four directions with jump rate Γint , we have
τ=
¯
1
.
4Γint
(14.27)
246
14 Mechanical Spectroscopy
The solute jump rate can be written in the form
Γint = ν 0 exp −
M
Hint
kB T
,
(14.28)
M
where ν 0 and Hint denote attempt frequency and activation enthalpy of a solute jump. Then, the relaxation time of the Snoek effect is
τR =
1
4
τ = 0 exp
¯
3
6ν
M
Hint
kB T
.
(14.29)
The jump of an interstitial solute which causes Snoek relaxation and the
elementary diffusion step (jump length d = a/2, a = lattice parameter) are
identical. The diffusion coefficient developed from random walk theory for
octahedral interstitials in the bcc lattice is given by
D=
1
1
Γint d2 =
Γint a2 .
6
24
(14.30)
Substituting Eqs. (14.27) and (14.29) into Eq. (14.30) yields
D=
1 a2
.
36 τR
(14.31)
This equation shows that Snoek relaxation can be used to study diffusion
of interstitial solutes in bcc metals by measuring the relaxation time. It is
also applicable to interstitial solutes in hcp metals since the non-ideality
of the c/a-ratio gives rise to an asymmetry in the octahedral sites. Very
pure and very dilute interstitial alloys must be used, if the Snoek effect of
isolated interstitials is in focus. Otherwise, solute-solute or solute-impurity
interactions could cause complications such as broadening or shifts of the
internal friction peak.
Figure 14.7 shows an Arrhenius diagram of carbon diffusion in α-iron. For
references the reader may consult Le Claire’s collection of data for interstitial diffusion [12] and/or a paper by da Silva and McLellan [13]. The data
above about 700 K have been obtained with various direct methods including
diffusion-couple methods, in- and out-diffusion, or thin layer techniques. The
data below about 450 K were determined with indirect methods, including internal friction, elastic after-effect, or magnetic after-effect measurements. The
data cover an impressive range of about 14 orders of magnitude in the carbon
diffusivity. Extremely small diffusivities around 10−24 m2 s−1 are accessible
with the indirect methods, illustrating the potential of these techniques. The
Arrhenius plot of C diffusion is linear over a wide range at lower temperatures. There is some small positive curvature at higher temperatures. One
possible origin of this curvature could be an influence the magnetic transition,
which takes place at the Curie temperature TC . In the case of self-diffusion
of iron this influence is well-studied (see Chap. 17).
14.4 Examples of Diffusion-related Anelasticty
247
Fig. 14.7. Diffusion coefficient for C diffusion in α-Fe obtained by direct and
indirect methods: DIFF = in- and out-diffusion or diffusion-couple methods;
IF = internal friction; EAE = elastic after effect, MAE = magnetic after effect
It is interesting to note that the Snoek effect cannot be used to study
interstitial solutes in fcc metals. Interstitial solutes in fcc metals are also
incorporated in octahedral sites. In contrast to octahedral sites in the bcc
lattice, which have tetragonal symmetry, octahedral sites in the fcc lattice
and the microstrains associated with an interstitial solute in such sites have
cubic symmetry. Interstitial solutes produce some lattice dilation but no elastic dipoles. Therefore, an external stress will not result in changes of the
interstitial populations in an fcc matrix.
14.4.2 Zener Effect (Zener Relaxation)
The Zener effect, like the Snoek effect, is a stress-induced reorientation of
elastic dipoles by atomic jumps. Atom pairs in substitutional alloys, pairs
of interstitial atoms, solute-vacancy pairs possessing lower symmetry than
the lattice can form dipoles responsible for Zener relaxation. For example, in
strain-free dilute substitutional fcc alloys solute atoms are distributed ran-
248
14 Mechanical Spectroscopy
domly and isotropically. Solute-solute pairs on nearest-neighbour sites are
uniformly distributed among the six 110 directions. The size difference between solute and solvent atoms causes pairs to create microstrains with strain
fields of lower symmetry than that of the cubic host crystal.
A well-studied example of solute-solute pair reorientation in fcc materials
was reported already by Zener [2]. He observed a strong internal friction
peak in Cu-Zn alloys (α-brass) around 570 K. The stress-mediated reorientation of random Zn-Zn pairs along 110 in fcc crystals is somewhat analogous
to the Snoek effect. Le Claire and Lomer interpreted this relaxation on the
basis of changing directional short-range order under the influence of external
stress. In reality, the Zener effect in dilute substitutional fcc alloys depends
on several exchange jump frequencies between solute atoms and vacancies.
Therefore, it is difficult to relate the effect to the diffusion of solute atoms
in a quantitative manner. A satisfactory model, such as is available for the
Snoek effect of dilute interstitial bcc alloys, is not straightforward. The activation enthalpy of the process can be determined. However, in a pair model
for low solute concentrations the activation energy is more characteristic of
the rotation of the dipoles than of long-range diffusion.
14.4.3 Gorski Effect (Gorski Relaxation)
In contrast to reorientation relaxations discussed above, the Gorski effect is
due to the long-range diffusion of solutes B which produce a lattice dilatation
in a solvent A. This effect is named after the Russian scientist Gorski [4]. Relaxation is initiated, for example, by bending a sample to introduce a macroscopic strain gradient. This gradient induces a gradient in the chemical potential of the solute, which involves the size-factor of the solute and the gradient
of the dilatational component of the stress. Solutes redistribute by ‘up-hill’
diffusion and develop a concentration gradient, as indicated in Fig. 14.2. This
transport produces a relaxation of elastic stresses, by the migration of solutes
from the regions in compression to those in dilatation. The associated anelastic relaxation is finished when the concentration gradient equalises with the
chemical potential gradient across the sample. For a strip of thickness d, the
Gorski relaxation time, τG , is given by
τG =
d2
π 2 ΦD
,
(14.32)
B
where DB is the diffusion coefficient of solute B and Φ is the thermodynamic factor. A thermodynamic factor is involved, because Gorski relaxation
establishes a chemical gardient.
Equation (14.32) shows that with the Gorski effect one measures the time
required for diffusion of B atoms across the sample. The Gorski relaxation
time is a macroscopic one, in contrast to the relaxation time of the Snoek
relaxation. If the sample dimensions are known, an absolute value of the
14.4 Examples of Diffusion-related Anelasticty
249
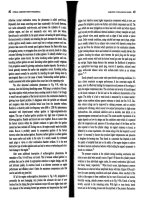
Fig. 14.8. Mechanical loss spectrum of a Na2 O4SiO4 at a frequency of 1 Hz according to Roling and Ingram [18, 19]
diffusivity is obtained. For a derivation of Eq. (14.32) we refer the reader
ă
to the review by Volkl [20]. The Gorski effect is detectable if the diffusion
coefficient of the solute is high enough. Gorski effect measurements have been
widely used for studies of hydrogen diffusion in metals [6, 20–22].
14.4.4 Mechanical Loss in Ion-conducting Glasses
Diffusion and ionic conduction in ion-conducting glasses is the subject of
Chap. 30. Mechanical loss spectroscopy is also applicable for the characterisation of dynamic processes in glasses and glass ceramics. This method can
provide information on the motion of mobile charge carriers, such as ions and
polarons, as well as on the motion of network forming entities. Mixed mobile ion effects in different types of mixed-alkali glasses, mixed alkali-alkaline
earth glasses, mixed alkaline earth glasses, and mixed cation anion glasses.
For references see, e.g., a review of Roling [8].
Let us consider an example: Fig. 14.8 shows the loss spectrum of a sodium
silicate glass according to Roling and Ingram [18, 19]. Such a spectrum
is typical for ion conducting glasses. The low-temperature peak near 0 ◦ C is
attributed to the hopping motion of sodium ions, which can be studied by
conductivity measurements in impedance spectroscopy and by tracer diffusion
techniques as well (for examples see Chap. 30). The activation enthalpy of
the loss peak is practically identical to the activation enthalpy of the dc
conductivity, which is due to the long-range motion of sodium ions [19]. The
intermediate-temperature peak at 235 ◦ C is attributed to the presence of
water in the glass. The increase of tan δ near 350 ◦ C is caused by the onset
of the glass transition.
250
14 Mechanical Spectroscopy
14.5 Magnetic Relaxation
In ferromagnetic materials, the interaction between the magnetic moment
and local order can give rise to various relaxation phenomena similar to those
observed in anelasticity. Their origin lies in the induced magnetic anisotropy
energy, the theory of which was developed by the French Nobel laureate
Neel [24].
An example, which is closely related to the Snoek effect, was reported for
the first time in 1937 by Richter [23] for α-Fe containing carbon. The direction of easy magnetisation in α-iron within a ferromagnetic domain is one of
the three 100 directions. Therefore, the octahedral X-, Y-, and Z-positions
for carbon interstitials are energetically not equivalent. A repopulation among
these sites takes place when the magnetisation direction changes. This can
happen when a magnetic field is applied. Suppose that the magnetic susceptibility χ is measured by applying a weak alternating magnetic field. Beginning
with a uniform population of the interstitials, after demagnetisation a redistribution into the energetically favoured sites will occur. This stabilises the
magnetic domain structure and reduces the mobility of the Bloch walls. As
a consequence, a temporal decrease of the susceptibility χ is observed, which
can be described by
χ(t) = χ0 − ∆χs 1 − exp −
t
τR
,
(14.33)
where ∆χs = χ0 − χ(∞) is denoted as the stabilisation susceptibility, t is the
time elapsed since demagnitisation, and τR is the relaxation time. The relationship between jump frequency, relaxation time, and diffusion coefficient is
the same as for anelastic Snoek relaxation.
The magnetic analogue to the Zener effect is directional ordering of ferromagnetic alloys in a magnetic field, which produces an induced magnetic
anisotropy. The kinetics of the establishment of magnetic anisotropy after
a thermomagnetic treatment can yield information about the activation energy of the associated diffusion process. The link between the relaxation time
and diffusion coefficient is as difficult to establish as in the case of the Zener
effect.
A magnetic analogue to the Gorski effect is also known. In a magnetic
domain wall, the interaction between magnetostrictive stresses and the strain
field of a defect (such as interstitials in octahedral sites of the bcc lattice, divacancies, etc.) can be minimised by diffusional redistribution in the wall. This
diffusion gives rise to a magnetic after-effect. The relaxation time is larger by
a factor δB /a (δB = thickness of the Bloch wall, a = lattice parameter) than
for magnetic Snoek relaxation. The variation of the susceptibility with time
is more complex than in Eq. (14.33). A comprehensive treatment of magă
netic relaxation eects can be found in the textbook of Kronmuller [9].
Obviously, magnetic methods are applicable to ferromagnetic materials at
temperatures below the Curie point only.
References
251
References
1. J.L. Snoek, Physica 8, 711 (1941)
2. C. Zener, Trans. AIME 152, 122 (1943)
3. C. Zener, Elasticity and Anelasticicty of Metals, University of Chicago Press,
Chicago, 1948
4. W.S. Gorski, Z. Phys. Sowjetunion 8, 457 (1935)
5. A.S. Nowick, B.S. Berry, Anelastic Relaxation in Crystalline Solids, Academic
Press, New York, 1972
6. B.S. Berry, W.C. Pritchet, Anelasticity and Diffusion of Hydrogen in Glassy and
Crystalline Metals, in: Nontraditional Methods in Diffusion, G.E. Murch, H.K.
Birnbaum, J.R. Cost (Eds.), The Metallurgical Society of AIME, Warrendale,
1984, p.83
7. R.D. Batist, Mechanical Spectroscopy, in: Materials Science and Technology,
Vol. 2B: Characterisation of Materials, R.W. Cahn, P. Haasen, E.J. Cramer
(Eds.), VCH, Weinheim, 1994. p. 159
8. B. Roling, Mechanical Loss Spectroscopy on Inorganic Glasses and Glass Ceramics, Current Opinion in Solid State Materials Science 5, 203210 (2001)
9. H. Kronmăller, Nachwirkung in Ferromagnetika, Springer Tracts in Natural
u
Philosophy, Springer-Verlag, 1968
10. W. Voigt, Ann. Phys. 67, 671 (1882)
11. J.H. Poynting, W. Thomson, Properties of Matter, C. Griffin & Co., London,
1902
12. A.D. Le Claire, Diffusion of C, N, and O in Metals, Chap. 8 in: Diffusion in
Solid Metals and Alloys, H. Mehrer (Vol.Ed,), Landolt-Bărnstein, Numerical
o
Data and Functional Relationships in Science and Technology, New Series,
Group III: Crystal and Solid State Physics, Vol. 26, Springer-Verlag, 1990
13. J.R.G. da Silva. R.B. McLellan, Materials Science and Engineering 26, 83
(1976)
14. J. Woirgard, Y. Sarrazin, H. Chaumet, Rev. Sci. Instrum. 48, 1322 (1977)
15. S. Etienne, J.Y. Cavaille, J. Perez, R. Point, M. Salvia, Rev. Sci. Instrum. 53,
1261 (1982)
16. P.F. Green, D.L. Sidebottom, R.K. Brown, J. Non-cryst. Solids 172–174, 1353
(1994)
17. P.F. Green, D.L. Sidebottom, R.K. Brown, J.H. Hudgens, J. Non-cryst. Solids
231, 89 (1998)
18. B. Roling, M.D. Ingram, Phys. Rev. B 57, 14192 (1998)
19. B. Roling, M.D. Ingram, Solid State Ionics 105, 47 (1998)
20. J. Vălkl, Ber. Bunsengesellschaft 76, 797 (1972)
o
21. J. Vălkl, G. Alefeld, in: Hydrogen in Metals I, G. Alefeld, J. Vălkl (Eds.), Topics
o
o
in Applied Physics 28, 321 (1978)
22. H. Wipf, Diffusion of Hydrogen in Metals, in: Hydrogen in Metals III, H. Wipf
(Ed.), Topics in Applied Physics 73, 51 (1995)
23. G. Richter, Ann. d. Physik 29, 605 (1937)
24. L. Neel, J. Phys. Rad. 12, 339 (1951); J. Phys. Rad. 13, 249 (1952); J. Phys.
Rad. 14, 225 (1954)
15 Nuclear Methods
15.1 General Remarks
Several nuclear methods are important for diffusion studies in solids. They
are listed in Table 13.1 and their potentials are illustrated in Fig. 13.1. The
first of these methods is nuclear magnetic resonance or nuclear magnetic
relaxation (NMR). NMR methods are mainly appropriate for self-diffusion
measurements on solid or liquid metals. In favourable cases self-diffusion coefficients between about 10−20 and 10−10 m2 s−1 are accessible. In the case of
foreign atom diffusion, NMR studies suffer from the fact that a signal from
nuclear spins of the minority component must be detected.
Măssbauer spectroscopy (MBS) and quasielastic neutron scattering
o
(QENS) are techniques, which have considerable potential for understanding diffusion processes on a microscopic level. The linewidths ∆Γ in MBS
and in QENS have contributions which are due to the diffusive motion of
atoms. This diffusion broadening is observed only in systems with fairly high
diffusivities since ∆Γ must be comparable with or larger than the natural
linewidth in MBS experiments or with the energy resolution of the neutron
spectrometer in QENS experiments. Usually, the workhorse of MBS is the
o
isotope 57 Fe although there are a few other, less favourable Măssbauer isotopes such as 119 Sn,115 Eu, and 161 Dy. QENS experiments are suitable for
fast diffusing elements with a large incoherent scattering cross section for
neutrons. Examples are Na self-diffusion in sodium metal, Na diffusion in
ion-conducting rotor phases, and hydrogen diffusion in metals.
Neither MBS nor QENS are routine methods for diffusion measurements.
The most interesting aspect is that these methods can provide microscopic
information about the elementary jump process of atoms. The linewidth for
single crystals depends on the atomic jump frequency and on the crystal
orientation. This orientation dependence allows the deduction of the jump
direction and the jump length of atoms, information which is not accessible
to conventional diffusion studies.
15.2 Nuclear Magnetic Relaxation (NMR)
The technique of nuclear magnetic relaxation has been widely used for many
years to give detailed information about condensed matter, especially about
254
15 Nuclear Methods
its atomic and electronic structure. It was recognised in 1948 by Bloembergen, Purcell and Pound [1] that NMR measurements can provide
information on diffusion through the influence of atomic movement on the
width of nuclear resonance lines and on relaxation times. Atomic diffusion
causes fluctuations of the local fields, which arise from the interaction of nuclear magnetic moments with their local environment. The fluctuating fields
either can be due to magnetic dipole interactions of the magnetic moments or
due to the interaction of nuclear electric quadrupole moments (for nuclei with
spins I > 1/2) with internal electrical field gradients. In addition, external
magnetic field gradients can be used for a direct determination of diffusion
coefficients.
We consider below some basic principles of NMR. Our prime aim is an
understanding of how diffusion influences NMR. Solid state NMR is a very
broad field. For a comprehensive treatment the reader is referred to textbooks
of Abragam [2], Slichter[3], Mehring [4] and to chapters in monographs
and textbooks [5–9]. In addition, detailed descriptions of NMR relaxation
techniques are available, e.g., in [10]). Corresponding pulse programs are
nowadays implemented in commercial NMR spectrometers.
15.2.1 Fundamentals of NMR
NMR methods are applicable to atoms with non-vanishing nuclear spin moment, I, and an associated magnetic moment
µ=γ I,
(15.1)
where γ is the gyromagnetic ratio, I the nuclear spin, and
the Planck
constant divided by 2π. In a static magnetic field B0 in z-direction, a nuclear
magnetic moment µ performs a precession motion around the z-axis governed
by the equation
dµ
= µ ⊗ B0 .
(15.2)
dt
The precession frequency is the Larmor frequency
ω0 = γB0 .
(15.3)
The degeneracy of the 2I +1 energy levels is raised due to the nuclear Zeeman
effect. The energies of the nuclear magnetic dipoles are quantised according
to
(15.4)
Um = −mγ B0 ,
where the allowed values correspond to m = −I, −I + 1, . . . , I − 1, I. For
example, for nuclei with I = 1/2 there are only two energy levels with the
energy difference ω0 .
At thermal equilibrium, the spins are distributed according to the Boltzmann statistics on the various levels. Since the energy difference between
15.2 Nuclear Magnetic Relaxation (NMR)
255
Fig. 15.1. Set-up for a NMR experiment (schematic)
levels for typical magnetic fields (0.1 to 1 Tesla) is very small, the population
difference of the levels is also small. A macroscopic sample in a static magnetic
field B 0 in the z-direction displays a magnetisation M eq along the z-direction
and a transverse magnetisation M⊥ = 0. The equilibrium magnetisation of
an ensemble of nuclei (number density N ) is given by
M eq = N
γ2
2
I(I + 1)
B0 .
3kB T
(15.5)
A typical experimental set-up for NMR experiments (Fig. 15.1) consists of
a sample placed in a strong, homogeneous magnetic field B 0 of the order of
a few Tesla. A coil wound around the sample permits the application of an
alternating magnetic field B 1 perpendicular to the z-direction with frequency
ω. Typically, these fields are radio-frequency (r.f.) fields. If the frequency ω
of the transverse r.f. field B 1 is close to the Larmor frequency, this field
will induce transitions between the Zeeman levels of the nuclear spins. In
NMR-spectrometers the coil around the sample is used for several steps of
the experiment, such as irradiation of r.f. pulses and detection of the free
induction decay of the ensemble of nuclei (see below).
The analysis of NMR experiments proceeds via a consideration of detailed interactions among nuclear moments and between them and other
components of the solid such as electrons, point defects, and paramagnetic
impurities. This theory has been developed over the past decades and can be
found, e.g., in the textbooks of Abragam [2] and Slichter [3]. Although
this demands the use of quantum mechanics, much can be represented by
semi-classical equations proposed originally by Bloch. The effect of rf-pulse
sequences on the time evolution of the total magnetisation M in an external
field
(15.6)
B = B0 + B1
256
15 Nuclear Methods
is given by the Bloch equation [2, 3]:
eq
dM
M⊥
Mz − Mz
= γM ⊗ B −
−
+ ∇ [D∇(M − M eq )] .
dt
T2
T1
(15.7)
The first term in Eq. (15.7) describes the precession of the spins around the
magnetic field B. The second and third terms give the rate of relaxation of
the magnetisation and define two phenomenological constants, T1 and T2 ,
denoted as relaxation times. They pertain to the longitudinal and transverse
components of the magnetisation. In the absence of any transverse field, T1
eq
determines the rate at which Mz returns to its equilibrium value Mz . This
relaxation corresponds to an energy transfer between the spin-system and
the so-called ‘lattice’, where the ‘lattice’ represents all degrees of freedom
of the material with the exception of those of the spin-system. Therefore,
T1 is denoted as the spin-lattice relaxation time. T2 refers to the transverse
part of the nuclear magnetisation and is called the spin-spin relaxation time.
Nuclear spins can be brought to a state of quasi-thermal equilibrium among
themselves without being in thermal equilibrium with the lattice. T2 describes
relaxation to such a state. It follows that T2 ≤ T1 . T2 is closely related to the
width of the NMR signal.
The last term in Eq. (15.7) was introduced by Torrey [11] and describes
the time evolution of the magnetisation M , when the sample is also put
into a magnetic field gradient. M eq is the equilibrium value of the magnetic
moment in field B0 and D the diffusion coefficient. Equation (15.7) shows that
various NMR techniques can be used to deduce information about atomic
diffusion.
Elegant pulse techniques of radiofrequency spectroscopy permit the direct
determination of D and of the relaxation times T1 and T2 (see, e.g., Gerstein
and Dybowski [10]).
15.2.2 Direct Diffusion Measurement by Field-Gradient NMR
When a sample is placed deliberately in a magnetic field gradient, G =
∂B/∂z, in addition to a static magnetic field, a direct determination of diffusion coefficients is possible. The basis of such NMR experiments in an inhomogeneous magnetic field is the last term of the Bloch equation. In a magnetic field gradient the Larmor frequency of a nuclear moment depends on
its positions. Field-gradient NMR (FG-NMR) utilises the fact that nuclear
spins that diffuse in a magnetic field-gradient experience an irreversible phase
shift, which leads to a decrease in transversal magnetisation. This decay can
be observed in so-called spin-echo experiments [12, 13]. The amplitude of the
spin-echo is given by
⎤
⎡
techo
MG (techo ) = M0 (techo ) exp ⎣−γ 2 D
2
t
G(t ) dt
0
0
dt ⎦ , (15.8)
15.2 Nuclear Magnetic Relaxation (NMR)
where
M0 (techo ) = M0 (0) exp −
techo
T2
.
257
(15.9)
techo denotes the time of the spin echo. MG (techo ) and M0 (techo ) are the echo
amplitudes with and without field-gradient G(t). M0 (0) is the equilibrium
magnetisation of the spin system.
For a 90-τ -180-τ spin-echo pulse sequence we have techo = 2τ . In a constant magnetic field gradient G0 the solution of Eq. (15.8) is proportional to
the transversal magnetisation M⊥ , which is given by
MG (2τ ) = M0 (0) exp −
2τ
T2
2
exp − γ 2 DG2 τ 3
0
3
.
(15.10)
By varying τ or G0 the diffusion coefficient can be determined from the
measured spin-echo amplitude. The diffusion of spins is followed directly by
FG-NMR. Thus, FG-NMR is comparable to tracer diffusion. For a known
G0 value a measurement of the diffusion-related part of the spin echo versus
time can provide the diffusion coefficient without any further hypothesis. In
contrast to tracer diffusion, the FG-NMR technique permits diffusion measurements in isotopically pure systems.
Equation (15.10) shows that the FG-NMR technique is applicable when
the spin-spin relaxation time T2 of the sample is large enough. A significant diffusion-related decay of the spin-echo amplitude must occur within T2 .
For fixed values of T2 and G0 this requires D-values that are large enough.
The measurement of small D-values requires high field-gradients. This can
be achieved by using pulsed magnetic field-gradients (PFG) as suggested
by McCall [14]. The first experiments with PFG-NMR were performed
by Stejskal and Tanner [13] for diffusion studies in aqueous solutions.
For a comprehensive review of PFG-NMR spectroscopy the reader is reă
ferred, for example, to the reviews of Stilbs [15], Karger et al. [16], and
Majer [7]. PFG-NMR has been widely applied to study diffusion of hydrogen in metals and intermetallic compounds [7]. Applications to anomalous
diffusion processes such as diffusion in porous materials and polymeric matrices can be found in [16]. Diffusion of hydrogen in solids is a relatively fast
process and the proton is particularly suited for NMR studies due to its high
gyromagnetic ratio. Diffusivities of hydrogen between 10−10 and 10−13 have
been studied by PFG-NMR [7].
A fine example for the application of PFG-NMR are measurements of
self-diffusion of liquid lithium and sodium [17]. Figure 15.2 displays selfdiffusivities in liquid and solid Li obtained by PFG-NMR according to Feinauer and Majer [18]. At the melting point, the diffusivity in liquid Li is
almost three orders of magnitude faster than in the solid state. Also visible is
the isotope effect of Li diffusion. The diffusivity of 6 Li is slightly faster than
that of 7 Li.
258
15 Nuclear Methods
Fig. 15.2. Self-diffusion of 6 Li and 7 Li in liquid and solid Li studied by PFG-NMR
according to Feinauer and Majer [18]
15.2.3 NMR Relaxation Methods
Indirect NMR methods for diffusion studies measure either the relaxation
times T1 and T2 , or the linewidth of the absorption line. In addition, other
relaxation times not contained in the Bloch equation can be operationally
defined. The best known of these is the spin-lattice relaxation time in the
rotating frame, T1ρ . This relaxation time characterises the decay of the magnetisation when it is ‘locked’ parallel to B1 in a frame of reference rotating
around B0 with the Larmor frequency ω0 = γB0 . In such an experiment,
M starts from M eq and decays to B1 M eq /B0 . Since T1ρ is shorter than T1 ,
measurements of T1ρ permit the detection of slower atomic motion than T1 .
Let us consider a measurement of the spin-lattice relaxation time T1 . If
a magnetic field is applied in the z-direction, T1 describes the evolution of
the magnetisation Mz towards equilibrium according to
dMz
M eq − Mz
= z
.
dt
T1
(15.11)
A measurement of T1 proceeds in two steps. (i) At first, the nuclear magnetisation is inverted by the application of an ‘inversion pulse’. (ii) Then, the
magnetisation Mz (t) is observed by a ‘detection pulse’ as it relaxes back to
the equilibrium magnetisation.
The effect of r.f. pulses can be discussed on the basis of the Bloch equation
(15.7). If the resonance condition, ω0 = γB0 , is fulfilled for the alternating
B 1 field, the magnetisation will precess in the y-z plane with a precession
15.2 Nuclear Magnetic Relaxation (NMR)
259
Fig. 15.3. Schematic iluustration of a T1 measurement with an inversion-recovery
(π-τ -π/2) pulse sequence
frequency γB1 . The application of a pulse of the r.f. field B1 with a duration tp
will result in the precession of the magnetisation to the angle Θp = γB1 tp . By
suitable choice of the pulse length the magnetisation can be inverted (Θp = π)
or tilted into the x-y plane (Θp = π/2). During precession in the x-y plane
the magnetisation will induce a voltage in the coil (Fig. 15.1). This signal
is called the free induction decay (FID). If, for example, an initial π-pulse is
applied, Mz (t) can be monitored by the amplitude of FID after a π/2-reading
pulse at the evolution time t, which is varied in the experiment1 . This widely
used pulse sequence for the measurement of T1 is illustrated in Fig. 15.3.
NMR is sensitive to interactions of nuclear moments with fields produced
by their local environment. The relaxation times and the linewidth are determined by the interaction between nuclear moments either directly or via
electrons. Apart from coupling to the spins of conduction electrons in metals or of paramagnetic impurities in non-metals, two basic mechanisms of
interaction must be considered in relation to atomic movements. The first
interaction is dipole-dipole coupling among the nuclear magnetic moments.
The second interaction is due to nuclear electric quadrupole moments with
internal electric field gradients. Nonzero quadrupolar moments are present
for nuclei with nuclear spins I > 1/2. The diffusion of nuclear moments
causes variations in both of these interactions. Therefore, the width of the
resonance line and the relaxation times have contributions which are due to
the thermally activated jumps of atoms.
1
Without discussing further details, we mention that more complex pulse sequences have been tailored to overcome limitations of the simple sequence, which
suffers from the dead-time of the detection system after the strong r.f. pulse.
260
15 Nuclear Methods
Fig. 15.4. Temporal fluctuations of the local field – the origin of motional narrowing
Spin-Spin Relaxation and Motional Narrowing: Let us suppose for the
moment that we need to consider only magnetic dipole interactions, which is
indeed the case for nuclei with I = 1/2. Each nuclear spin precesses, in fact,
in a magnetic field B = B 0 + B local , where B local is the local field created by
the magnetic moments of neighbouring nuclei. The local field experienced by
a particular nucleus is dominated by the dipole fields created by the nuclei
in its immediate neighbourhood, because dipolar fields vary as 1/r3 with
the distance r between the nuclei. Since the nuclear moments are randomly
oriented, the local field varies from one nucleus to another. This leads to
a dispersion of the Larmor frequency and to a broadening of the resonance
line according to
1
∆ω0 =
∝ γ∆Blocal .
(15.12)
T2
∆Blocal is an average of the local fields in the sample. In solids without
internal motion, local fields are often quite large and give rise to rather short
T2 values. Typical values without motion of the nuclei are the following:
∆Blocal ≈ 2ì104 Tesla, T2 100às and 0 104 rad s−1 . Such values are
characteristic of a ‘rigid lattice’ regime. The pertaining spin-spin relaxation
time is denoted as T2 (rigid lattice).
Let us now consider how diffusion affects the spin-spin relaxation time
and the linewidth of the resonance line. Diffusion comes about by jumps of
individual atoms from one site to another. The mean residence time of an
atom, τ , is temperature dependent via
¯
τ = τ0 exp
¯
∆H
kB T
(15.13)
with an activation enthalpy ∆H and a pre-factor τ0 . Each time when an
atom jumps into a new site, its nuclear moment will find itself in another
local field. As a consequence, the local field sensed by a nucleus will fluctuate
between ±Blocal on a time-scale characterised by the mean residence time
(Fig. 15.4). If the mean residence time of an atom is much shorter than the
spin-spin relaxation time of the rigid lattice, i.e. for τ
¯
T2 (rigid lattice),
15.2 Nuclear Magnetic Relaxation (NMR)
261
Fig. 15.5. Schematic illustration of diffusional contributions (random jumps) to
spin-lattice relaxation rates, 1/T1 and 1/T1ρ , and to the spin-spin relaxation rate
1/T2
a nuclear moment will sample many different local fields. The nuclear moment
will behave as though it were in some new effective local field, which is given
by the average of all the local fields sampled. If the sampled local fields
vary randomly in direction and magnitude this average will be quite small,
depending on how many are sampled. The dephasing between the spins grows
more slowly with time than in a fixed local field. The effective local fields of
all the nuclear moments will be small, and the nuclear moments will precess
at nearly the same frequency. Thus, the nuclear moments will not lose their
coherence as rapidly during a FID, and T2 will be longer. A longer FID is
equivalent to a narrower resonance line.
If the diffusion rate is increased, it can be shown by statistical considerations that the width of the resonance line becomes
∆ω =
1
2
= ∆ω0 τ .
¯
T2
(15.14)
This phenomenon is called motional narrowing. A schematic illustration of
the temperature dependence the spin-spin relaxation rate 1/T2 is displayed
in Fig. 15.5: at low temperatures the relaxation rate of the rigid lattice is
observed, since diffusion is so slow that an atom does not even jump once
during the FID; as τ gets shorter with increasing temperature 1/T2 decreases
¯
and the width of the resonance line gets narrower.
Spin-Lattice Relaxation: When discussing the Bloch equations we have
seen that the spin-lattice relaxation time T1 is the characteristic time during
262
15 Nuclear Methods
which the nuclear magnetisation returns to its equilibrium value. We could
also say the nuclear spin system comes to equilibrium with its environment,
called ‘lattice’. In contrast to spin-spin relaxation, this process requires an
exchange of energy with the ‘lattice’. Spin-lattice relaxation either takes place
by the absorption or emission of phonons or by coupling of the spins to conduction electrons (via hyperfine interaction) in metals. The relaxation rate
due to the coupling of nuclear spins with conduction electrons is approximately given by the Koringa relation
1
T1
= const × T,
(15.15)
e
where T denotes the absolute temperature. The relaxation rate due to dipolar interactions, (1/T1 )dip , and due to quadrupolar interactions, (1/T1 )Q , is
added to that of electrons, so that the total spin-lattice relaxation rate is
1
=
T1
1
T1
+
e
1
T1
+
dip
1
T1
.
(15.16)
Q
For systems with nuclear spins I = 1/2, quadrupolar contributions are absent.
The fluctuating fields can be described by a correlation function G(t),
which contains the temporal information about the atomic diffusion process [2, 3]. Let us assume as in the original paper by Bloembergen, Purcell and Pound [1] that the correlation function decays exponentially with
the correlation time τc , i.e. as
G(t) = G(0) exp −
|t|
τc
.
(15.17)
This behaviour is characteristic of jump diffusion in a three dimensional system and τc is closely related to the mean residence time between successive
jumps. The Fourier transform of Eq. (15.17), which is called the spectral
density function J(ω), is a Lorentzian given by
J(ω) = G(0)
2τc
.
2
1 + ω 2 τc
(15.18)
Transitions between the energy levels of the spin-system can be induced, i.e.
spin-lattice relaxation becomes effective, when J(ω) has components at the
transition frequency. The spin-lattice relaxation rate is then approximately
given by
1
3
≈ γ 4 2 I(I + 1)J(ω0 ) .
(15.19)
T1 dip
2
Detailed expressions for the relaxation rates
e.g., in [2, 6].
1
1
T1 , T2
and
1
T1ρ
can be found,
15.2 Nuclear Magnetic Relaxation (NMR)
263
Fig. 15.6. Diffusion-induced spin-lattice relaxation rate, (1/T1 )dip , of 8 Li in solid
Li as a function of temperature according to Heitjans et al. [8]. The B0 values correspond to Larmor frequencies ω0 /2π of 4.32 MHz, 2.14 MHz, 334 kHz, and
53 kHz
The correlation time τc , like the mean residence time τ , will usually obey
¯
an Arrhenius relation
∆H
0
τc = τc exp
,
(15.20)
kB T
where ∆H is the activation enthalpy of the diffusion process. Since the movement of either atom of a pair will change the correlation function we may
¯
identify τc with one half of the mean residence time τ of an atom at a lattice
site.
The diffusion-induced spin-lattice relaxation rate, (1/T1 )dip , is shown in
Fig. 15.6 for self-diffusion of 8 Li in lithium according to Heitjans et al. [8].
In a representation of the logarithm of the relaxation rate as function of
the reciprocal temperature, a symmetric peak is observed with a maximum
at ω0 τc ≈ 1. At temperatures well above or below the maximum, which
correspond to the cases ω0 τc
1 or ω0 τc
1, the slopes yield ∆H/kB or
−∆H/kB .
The work of Bloembergen, Purcell and Pound [1] is based on the
assumption of the exponential correlation function of Eq. (15.17), which is
appropriate for diffusion in liquids. Later on, the theory was extended to
random walk diffusion in lattices by Torrey [19]. Based on the encounter
model (see Chap. 7) the influence of defect mechanisms of diffusion and the
associated correlation effects have been included into the theory by Wolf [20]
and MacGillivray and Sholl [21]. These refinements lead to results that
264
15 Nuclear Methods
Fig. 15.7. Comparison of self-diffusivities for 6 Li in solid Li determined by PFGNMR with spin-lattice relaxation results assuming a vacancy mechanism (solid line)
and an interstitial mechanism (dashed line) according to Majer [22]
are broadly similar to those of [1]. However, the refinements are relevant for
a quantitative interpretation of NMR results in terms of diffusion coefficients.
We illustrate this by an example:
Figure 15.7 shows a comparison of diffusion data of 6 Li in solid lithium
obtained with PFG-NMR and data deduced from relaxation measurements.
PFG-NMR yields directly 6 Li self-diffusion coefficients in solid lithium. No
assumption about the elementary diffusion steps is needed for these data.
The dashed and solid lines are deduced from (1/T1 )dip data, assuming two
different atomic mechanisms. Good coincidence of diffusivities from spinlattice relaxation and the PFG-NMR data is obtained with the assumption
that Li diffusion is mediated by vacancies. Direct interstitial diusion clearly
can be excluded [22].
15.3 Măssbauer Spectroscopy (MBS)
o
The Măssbauer effect has been detected by the 1961 Nobel laureate in physics
o
ă
R. Mossbauer [23]. The Măssbauer eect is the recoil-free emission and abo
sorption of γ-radiation by atomic nuclei. Among many other applications,
Măssbauer spectroscopy can be used to deduce information about the moveo
ments of atoms for which suitable Măssbauer isotopes exist. There are only
o
15.3 Măssbauer Spectroscopy (MBS)
o
265
Fig. 15.8. Măssbauer spectroscopy. Top: moving source experiment; bottom: prino
ciples
a few nuclei, 57 Fe, 119 Sn, 151 Eu, and 161 Dy, for which Măssbauer spectroscopy
o
can be used. 57 Fe is the major ‘workhorse’ of this technique
Information about atomic motion is obtained from the broadening of the
otherwise very narrow -line. Thermally activated diusion of Măssbauer
o
atoms contributes to the linewidth in a way rst recognised by Singwi and
ă
Sjolander in 1960 [24] soon after the detection of the Măssbauer eect.
o
Măssbauer spectroscopy uses two samples, one playing the rˆle of the
o
o
source, the other one the rˆle of an absorber of γ-radiation as indicated in
o
Fig. 15.8. In the source the nuclei emit γ-rays, some of which are absorbed
without atomic recoil in the absorber. The radioisotope 57 Co is frequently
used in the source. It decays with a half-life time of 271 days into an excited
state of the Măssbauer isotope 57 Fe. The Măssbauer level is an excited level
o
o
of 57 Fe with lifetime τN = 98 ns. It decays by emission of γ-radiation of the
energy Eγ = 14.4 keV to the ground state of 57 Fe, which is a stable isotope
with a 2.2% natural abundance. If the Măssbauer isotope is incorporated in
o
a crystal, the recoil energy of the decay is transferred to the whole crystal.
Then, the width of the emitted γ-line becomes extremely narrow. This is
the eect for which Măssbauer received the Nobel price. The absorber also
o
contains the Măssbauer isotope. A fraction f of the emitted γ-rays is absorbed
o
without atomic recoil in the absorber. In the experiment, the source is usually
moved relative to the absorber with a velocity v. Experimantal set-ups with
static source and a moving absorber are also possible. This motion causes
a Doppler shift
v
(15.21)
∆E = Eγ
c
of the source radiation, where c denotes the velocity of light. The linewidth
in the absorber is then recorded as a function of the relative velocity or as
a function of the Doppler shift ∆E.
266
15 Nuclear Methods
Fig. 15.9. Simplified, semi-classical explanation of the diffusional line-broadening
of a Măssbauer spectrum. Q denotes the wave vector of the γ-rays
o
Diffusion in a solid, if fast enough, leads to a diusional broadening of
the Măssbauer spectrum. This can be understood in a simplified picture
o
as illustrated in Fig. 15.9 [25]: at low temperatures, the Măssbauer nuclei
o
stay on their lattice sites during the emission process. Without diffusion the
natural linewidth Γ0 is observed, which is related to the lifetime of the excited
Măssbauer level, τN , via the Heisenberg uncertainty relation:
o
Γ0 τN ≥ .
(15.22)
At elevated temperatures, the atoms become mobile. A diffusing atom resides
on one lattice site only for a time τ between two successive jumps. If τ
¯
¯
is of the same order or smaller than N , the Măssbauer atom changes its
o
position during the emission process. When an atom is jumping the wave
packet emitted by the atom is ‘cut’ into several shorter wave packets. This
leads to a broadening of the linewidth Γ , in addition to its natural width Γo .
If τ
¯
τN , the broadening, ∆Γ = Γ − Γ0 , is of the order of
∆Γ ≈ /¯ .
τ
(15.23)
Neglecting correlation effects (see, however, below) and considering diffusion
on a Bravais lattice with a jump length d the diffusion coefficient is related
to the diffusional broadening via
D≈
d2
.
12
(15.24)
Experimental examples for Măssbauer spectra of 57 Fe in iron are shown
o
in Fig. 15.10 according to Vogl and Petry [27]. The Măssbauer source
o
was 57 Co. The linewidth increases with increasing temperature due to the
diffusional motion of Fe atoms. Figure 15.11 shows an Arrhenius diagram
of self-diffusion for γ- and δ-iron, in which the Măssbauer data are como
pared with tracer results [27]. The jump length d in Eq. (15.24) was assumed to be the nearest neighbour distance of Fe. It can be seen that
15.3 Măssbauer Spectroscopy (MBS)
o
267
Fig. 15.10. Măssbauer spectra for self-diusion in polycrystalline Fe from a review
o
of Vogl and Petry [27]. FWHM denotes the full-width of half maximum of the
Măssbauer line. The spectrum at 1623 K pertains to γ-iron and the spectra at higher
o
temperatures to -iron
the diusivities determined from the Măssbauer study agree within ero
ror bars with diffusivities from tracer studies. Equation (15.24) is an approximation and follows from the more general Eq. (15.27). For this aim
Eq. (15.27) is specified to polycrystalline samples and considered for Q
1/d. For 14.4 keV γ-radiation we have Q = 73 nm−1 , which is indeed
much larger than 1/d. The broadening is more pronounced in the hightemperature δ-phase of iron with the bcc structure as compared to the fcc
γ-phase of iron. This is in accordance with the fact that self-diffusion increases by about one order of magnitude, when γ-iron transforms to δ-iron
(see Chap. 17).
268
15 Nuclear Methods
Fig. 15.11. Self-diffusion in γ- and δ-iron: comparison of Măssbauer (symbols) and
o
tracer results (solid lines) according to Vogl and Petry [27]
Diffusional Broadening of MBS Signals: A quantitative analysis of
diffusional line-broadening uses the fact that according to van Hove [28]
the displacement of atoms in space and time can be described by the selfcorrelation function Gs (r, t). This is the probability density to find an atom
displaced by the vector r within a time interval t. We are interested in the selfcorrelation function because the Măssbauer absorption spectrum, (Q, ), is
o
related to the double Fourier transform of Gs in space and time via
σ(Q, ω) ∝ Re
Gs (r, t) exp [i(Q · r − ωt) − Γ0 | t | /2 ]drdt ,
(15.25)
where 0 is the natural linewidth of the Măssbauer transition.
o
The self-correlation function contains both diffusional motion as well as
lattice vibrations. Usually, these two contributions can be separated. The
vibrational part leads to the so-called Debye-Waller factor, fDW , which governs the intensity of the resonantly absorbed radiation. The diffusional part
determines the shape of the Măssbauer spectrum. As the wave packets are
o
emitted by the same nucleus, they are coherent. The interference between
these packets depends on the orientation between the jump vector of the
atom and the wave vector (see Fig. 15.9). If a single-crystal specimen is used,
in certain crystal directions the linewidth is small and in other directions it
is larger.
To exploit Eq. (15.25) a diffusion model is necessary to calculate σ(Q, ω).
For random jumps on a Bravais lattice (Markov process) the shape of the