Báo cáo sinh học: "Motifs, themes and thematic maps of an integrated Saccharomyces cerevisiae interaction networ" pps
Bạn đang xem bản rút gọn của tài liệu. Xem và tải ngay bản đầy đủ của tài liệu tại đây (190.28 KB, 13 trang )
Research article
Motifs, themes and thematic maps of an integrated
Saccharomyces cerevisiae interaction network
Lan V Zhang
*
, Oliver D King
*
, Sharyl L Wong
*
, Debra S Goldberg
*
, Amy
HY Tong
†
, Guillaume Lesage
‡
, Brenda Andrews
†
, Howard Bussey
‡
, Charles
Boone
†
and Frederick P Roth
*
Addresses: *Department of Biological Chemistry and Molecular Pharmacology, Harvard Medical School, Boston, MA 02115 USA.
†
Banting
and Best Department of Medical Research and Department of Medical Genetics and Microbiology, University of Toronto, Toronto ON M5G
1L6, Canada.
‡
Department of Biology, McGill University, Montreal PQ H3A 1B1, Canada.
Correspondence: Frederick P Roth. E-mail:
Abstract
Background: Large-scale studies have revealed networks of various biological interaction
types, such as protein-protein interaction, genetic interaction, transcriptional regulation,
sequence homology, and expression correlation. Recurring patterns of interconnection, or
‘network motifs’, have revealed biological insights for networks containing either one or two
types of interaction.
Results: To study more complex relationships involving multiple biological interaction types,
we assembled an integrated Saccharomyces cerevisiae network in which nodes represent genes
(or their protein products) and differently colored links represent the aforementioned five
biological interaction types. We examined three- and four-node interconnection patterns
containing multiple interaction types and found many enriched multi-color network motifs.
Furthermore, we showed that most of the motifs form ‘network themes’ - classes of higher-
order recurring interconnection patterns that encompass multiple occurrences of network
motifs. Network themes can be tied to specific biological phenomena and may represent
more fundamental network design principles. Examples of network themes include a pair of
protein complexes with many inter-complex genetic interactions - the ‘compensatory
complexes’ theme. Thematic maps - networks rendered in terms of such themes - can
simplify an otherwise confusing tangle of biological relationships. We show this by mapping
the S. cerevisiae network in terms of two specific network themes.
Conclusions: Significantly enriched motifs in an integrated S. cerevisiae interaction network
are often signatures of network themes, higher-order network structures that correspond to
biological phenomena. Representing networks in terms of network themes provides a useful
simplification of complex biological relationships.
BioMed Central
Journal
of Biology
Open Access
Published: 1 June 2005
Journal of Biology 2005, 4:6
The electronic version of this article is the complete one and can be
found online at />Received: 17 November 2004
Revised: 21 February 2005
Accepted: 8 April 2005
© 2005 Zhang et al.; licensee BioMed Central Ltd.
This is an Open Access article distributed under the terms of the Creative Commons Attribution License ( />which permits unrestricted use, distribution, and reproduction in any medium, provided the original work is properly cited.
Journal of Biology 2005, 4:6
Background
A cellular system can be described as a web of relationships
amongst genes, proteins, and other macromolecules. Pro-
teins can interact via direct or indirect physical contact
(referred to as protein-protein interactions). They can also
interact genetically; for example, if a combination of muta-
tions in two genes causes a more severe fitness defect (or
death) than either mutation alone, the two genes have a
synthetic sick or lethal (SSL) genetic interaction. In addi-
tion, two genes can relate to each other by transcriptional
regulation, sequence homology, or expression correlation.
Overlaps between different types of biological interaction
have been noted previously. For example, interacting pro-
teins are more likely to have similar expression patterns
[1,2]; genes with correlated expression are more likely to be
controlled by a common transcription factor [3]; and syn-
thetic genetic interactions are more likely to occur between
homologous genes [4]. These represent pairwise relation-
ships between various types of biological interaction,
however, understanding how they are organized in an inte-
grated network remains a challenging task.
The concept of network motifs (referred to simply as ‘motifs’
hereafter) has been developed to describe simple patterns of
interconnection in networks that occur more frequently than
expected in randomized networks [5,6]. It has been proposed
that network motifs represent the basic building blocks of
complex networks [5-7]. Different types of network exhibit
different motif profiles, providing a means for network classi-
fication [8]. The network motif concept is extensible to an
integrated network of many interaction types (that is, a
‘multi-color network’, with interactions of each type repre-
sented by a different color). Multi-color network motifs char-
acterize relationships between different biological interaction
types within local network neighborhoods. A recent study
examined network motifs in integrated cellular networks of
two interaction types - transcriptional regulation and protein-
protein interaction [9]. Other gene-pair relationships are also
important. Correlated expression profiles may reflect
common regulation or a cellular requirement for contempo-
raneous action. Sequence homology suggests descent from a
common ancestor and therefore an increased likelihood of
performing a related function. Genetic interactions describe
synergistic or antagonistic consequences of mutations in two
or more genes. For example, a recent systematic study [4]
identified a large number of SSL interactions, revealing gene
pairs in which one gene compensates for loss of the other,
suggesting a functional relationship between the two gene
products. Here, we describe network motifs discovered from a
Saccharomyces cerevisiae network that integrates five types of
biological interactions or relationships: protein-protein inter-
actions, genetic interactions, transcriptional regulation,
sequence homology, and expression correlation.
It has been shown for the Escherichia coli and Caenorhabditis
elegans transcriptional networks that subgraphs matching
two types of transcriptional regulatory circuit motif - feed-
forward and bi-fan - overlap with one another and form
large clusters [6,10,11]. This suggests that instead of repre-
senting network “building blocks”, motifs should in some
cases be viewed as signatures of more fundamental higher-
order structures. Here, we describe ‘network themes’ -
recurring higher-order interconnection patterns that
encompass multiple occurrences of network motifs and
reflect a common organizational principle. We show that
most network motifs found in the integrated S. cerevisiae
network can be understood in terms of only a few network
themes. Network themes can be tied to specific biological
phenomena and may represent more fundamental network
design principles. They also suggest a natural simplification
of the otherwise complex set of relationships in an inte-
grated network. We demonstrate this by providing two the-
matic maps of the integrated S. cerevisiae network.
Results
An integrated S. cerevisiae network
We constructed an integrated S. cerevisiae network by com-
bining five types of biological interaction. Nodes in the
network represent genes or proteins, and differently colored
links represent different biological interaction types. These
include: 3,060 SSL interactions derived from synthetic genetic
array (SGA) analysis [4]; 40,438 protein sequence homology
relationships from a genome-wide BLAST search [12]; 57,367
correlated mRNA expression relationships derived from
microarray data [13]; 49,537 stable protein interactions
defined by shared membership in a protein complex [14-16];
and 4,357 transcriptional regulatory interactions from a
genome-wide chromatin immuno-precipitation (ChIP) study
[7]. This collection of data resulted in a single integrated
network involving 5,831 nodes and 154,759 links in total
(for a full list see Additional data file 1 available with the
online version of this article).
Three-node network motifs and corresponding
themes in the integrated network
Networks of protein-protein and synthetic genetic inter-
action have been reported to be scale-free and ‘small-world’
[4,17,18]. Being a small-world network implies neighbor-
hood clustering, where neighbors of a given node tend to
interact with one another, resulting in an abundance of
three-node interconnection patterns - that is, ‘triangles’. In
addition, relationships such as sequence homology and cor-
related expression are often transitive (that is, if gene A is
homologous to gene B, and gene B is homologous to gene
C, then gene A is often homologous to gene C). Thus, a tri-
angle motif for each of these component subnetworks is
6.2 Journal of Biology 2005, Volume 4, Article 6 Zhang et al. />Journal of Biology 2005, 4:6
expected. In order to find additional motifs involving multi-
ple interaction types, we looked for frequently occurring
patterns of interconnection in the integrated network,
assessing their significance by comparing the observed
network with appropriately randomized networks.
We first exhaustively tested all three-node interconnection
patterns defined by a single type of link between each pair
of nodes (there are 50 such patterns; for a full list see Addi-
tional data file 2 available with the online version of this
article). Shown in Figure 1 is a list of enriched three-node
network motifs, each describing a significantly (p Ͻ 0.001)
enriched topological relationship among biological interac-
tions of varying types in the integrated S. cerevisiae network.
We found that most motifs can be explained in terms of
higher-order structures, or network themes, which are repre-
sentative of the underlying biological phenomena. We clas-
sified these motifs into seven sets (Figure 1a-g) according to
the themes discussed below. There are five additional motifs
that we could not classify into themes (Figure 1h). These are
addressed further in the Discussion.
The first motif set contains the transcriptional feed-forward
motif (Figure 1a), which has been characterized in several
earlier studies of single-color networks of transcriptional reg-
ulation [5-7,11]. Because transcriptional regulation links
often overlap co-expression links, we added to this set
another motif composed of two genes with correlated expres-
sion that are also indirectly connected by transcriptional regu-
latory links through an intermediate gene. We noticed that
gene triads matching the feed-forward motif in the S. cere-
visiae network often overlap with one another to form large
clusters, as in the E. coli and C. elegans transcriptional regula-
tory networks [6,10,11]. For example, Swi4 and its transcrip-
tional activator Mcm1 together regulate a number of
cell-cycle-related genes (Figure 1a) [19-21]. Most gene triads
matching the feed-forward motif belong to such clusters,
leading us to note a ‘feed-forward’ theme - a pair of transcrip-
tion factors, one regulating the other, and both regulating a
common set of target genes that are often involved in the
same biological process.
The next set contains ‘co-pointing’ motifs, in which a
target gene is regulated by two transcription factors that
interact physically or share sequence homology (Figure
1b). These co-pointing motifs reflect the fact that two tran-
scription factors regulating the same target gene are often
derived from the same ancestral gene, or function as a
protein complex. We found that these motifs also overlap
extensively, forming a co-pointing theme, in which multi-
ple transcription factors, connected to one another by
physical interaction or sequence homology, regulate a
common set of target genes. Figure 1b shows one such
example, where Hap2, Hap3, Hap4 and Hap5 form the
CCAAT-binding factor complex [22] which regulates
common target genes, many of which are involved in
carbohydrate metabolism [23].
A third set of motifs contains two targets of the same tran-
scription factor bridged by a link of correlated expression,
protein-protein interaction, or sequence homology (Figure
1c). These motifs indicate that transcriptional co-regulation
is often accompanied by co-expression, membership in the
same protein complex, or descent from a common ances-
tor [3,24], and suggest a ‘regulonic complex’ theme in
which co-regulated proteins are often components of a
complex or related by gene duplication and divergence.
Illustrating this theme, six members of the histone
octamer, Hhf1, Hhf2, Hht1, Hht2, Hta1 and Htb1 are all
regulated by Hir1 and Hir2, histone transcriptional co-
repressors that are required for periodic repression of the
histone genes (Figure 1c) [25].
The fourth motif set consists of four three-node motifs each
containing protein-protein interactions or correlated expres-
sion links (Figure 1d). Protein-protein interaction is known
to correlate positively with co-expression [1,2], and proteins
corresponding to these motifs often reside in the same
complex. Thus, motifs within this set are likely to be signa-
tures of a ‘protein complex’ theme. One of the many exam-
ples is the ATP synthase complex [26,27], whose members
are linked extensively to one another by protein-protein
interaction and correlated expression (Figure 1d).
Journal of Biology 2005, Volume 4, Article 6 Zhang et al. 6.3
Journal of Biology 2005, 4:6
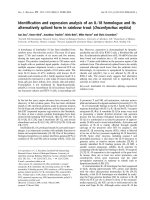
Figure 1 (see the figure on the following page)
Three-node motifs and corresponding themes in the integrated S. cerevisiae network. (a) A motif corresponding to the ‘feed-forward’ theme; (b) motifs
corresponding to the ‘co-pointing’ theme; (c) motifs corresponding to the ‘regulonic complex’ theme; (d) motifs corresponding to the ‘protein complex’
theme; (e) motifs corresponding to the theme of neighborhood clustering of the integrated SSL/homology network; (f) motifs corresponding to the
‘compensatory complex members’ theme; (g) motifs corresponding to the ‘compensatory protein and complex/process’ theme; (h) other unclassified
motifs. Each of (a-g), from left to right, shows a schematic diagram unifying the collection of motifs in that set, the list of motifs with the motif statistics,
a specific example of a subgraph matching one or more of these motifs, and a larger structure corresponding to the network theme. Each colored link
represents one of the five interaction types according to the color scheme (bottom right). For a given motif, N
real
is the number of corresponding
subgraphs in the real network, and N
rand
describes the number of corresponding subgraphs in a randomized network, represented by the average and
the standard deviation. A node labeled ‘etc.’ signifies that the structure contains more nodes with connectivity similar to the labeled node.
6.4 Journal of Biology 2005, Volume 4, Article 6 Zhang et al. />Journal of Biology 2005, 4:6
S: synthetic sickness or lethality
H: sequence homology
X: correlated expression
P: stable physical interaction
R: transcriptional regulation
R
R
R
A1 A2
(2.6±0.5)×10
2
4.7×10
2
5.4±3.2
3.0×10
1
N
rand
N
real
R
R/X
R
a
b
c
Mcm1 Swi4
Yhp1
Clb2
Pcl1
Sim1
Gin4
Cdc6
Rax2
Yor315w
etc.
R
R
R
Mcm1
Swi4
Clb2
Motif set A
A motif example
A theme example
X
R
R
RRRR
RR
P
Cox4
Hap2 Hap3
B1 B2
3.3±3.7
1.3×10
2
N
rand
N
real
(8.0±2.3)×10
1
6.1×10
2
RR
P/H
a
b
c
P
Hap5
Cox4
Atp3
Ccc1
Apt17
Cox6
Qcr10 Isa1
Grx4
Ypl207w
Qcr9 Prp3
Hap4
Hap3Hap2
Motif set B
A motif example A theme example
H
Hir1
Hhf1 Hht1
RR
P,X
C2 C3C1
(2.7±0.3)×10
2
3.5×10
3
Nrand
Nreal
(5.3±0.5)×10
2
(5.4±0.5)×10
2
1.9×10
3
5.9×10
3
P
RRRRRR
X
a
b
c
RR
P/X/H
Hir1
Hir2
Hhf1
Hhf2
Hht2
Hht1
Htb1
Htb2
Hta2
Hta1
Motif set C
A motif example
A theme example
H
P,XP,X
P,X
Atp20
Atp14 Atp3
P
PPPP
X
XXXX
D4D3D2D1
(5.2±0.2)×10
3
6.7×10
4
(1.1±0.0)×10
5
5.7×10
5
N
rand
N
real
(2.7±0.1)×10
4
(8.2±0.3)×10
3
1.2×10
6
9.9×10
4
a
P/X P/X
P/X
X P
Atp2
Atp14
Atp3
Atp15
Atp20
etc.
Motif set D
A motif example A theme example
S
PP
SSH SH HSSH SH H
XXXPPPXPXX
S
F3 F5 F6F4F2F1
(1.3±0.2)×10
2
2.8×10
2
(1.5±0.3)×10
2
2.7×10
2
(1.1±0.0)×10
4
4.1×10
4
(2.0±0.1)×10
3
1.1×10
4
N
rand
N
real
(2.4±0.1)×10
3
(7.6±0.7)×10
2
4.4×10
4
1.2×10
3
P/X P/X
S/H
S/HS/H
a
b
c
HHH
PP
S
Rpb5
Ssn8
Cdc73
Ssn8 Cdc73
Rpb3
Rpb5
Rpo21
Rpb9
Rpb4Rpb2
Rpb7
etc.
Motif set F
A motif example A theme example
S
Sec72
Yke2
Key
Gim5
SS
P,X
G5 G6G4G3G2G1
(1.2±0.2)×10
2
2.5×10
2
N
rand
N
real
(4.0±0.2)×10
3
(7.0±1.5)×10
1
(1.2±0.1)×10
4
(3.5±0.3)×10
2
(2.4±0.3)×10
2
4.3×10
4
2.8×10
2
3.0×10
4
7.2×10
2
2.0×10
3
PPP XXX
a
P/X
Sec72
Gim4
Yke2
Gim5
Pac10
Gim3
Motif set G
A motif example A theme example
H
H4H3 H5H2H1
P
P
R
H
H
RXR
(1.9±0.2)×10
2
2.7×10
2
(2.6±0.4)×10
2
3.3×10
3
(6.2±1.3)×10
1
3.1×10
2
(5.4±0.5)×10
2
7.8×10
2
N
rand
N
real
(2.5±0.2)×10
3
3.2×10
3
Motif set H
H
X
R
X
X
R
H
S,H S,H
S,H
Myo2
Num1
Tpm1
S
E4E3E2E1
(1.0±0.2)×10
5
5.6×10
5
(1.3±0.1)×10
3
3.2×10
3
(1.7±0.1)×10
3
2.7×10
3
N
rand
N
real
(3.8±0.4)×10
2
9.8×10
2
S
SSS HHHHS
H
S/HS/H
S/H
a
Num1 Tpm1
Smi1
Fab1
Chs7
Slt2
etc.
Myo2
Motif set E
A motif example A theme example
b
c
b
c
b
c
(a)
(b)
(c)
(d)
(e)
(f)
(g)
(h)
Figure 1 (see the legend on the preceding page)
The fifth motif set contains three-node motifs linked by SSL
interaction or by sequence homology (Figure 1e). In the SSL
network, neighbors of the same gene often interact with one
another [4]. This translates into a triangle motif of three SSL
links. Furthermore, homology relationships are often transi-
tive (that is, if gene A is homologous to gene B, and gene B
is homologous to gene C, then gene A is often homologous
to gene C). These phenomena, combined with the fact that
genes sharing sequence homology have an increased ten-
dency to show SSL interaction, suggest an underlying theme
of the neighborhood clustering in the integrated
SSL/homology network: SSL or homology neighbors of one
node tend to be linked to one another by SSL interaction or
sequence homology. This theme is exemplified by Myo2
and a number of genes connected to Myo2 by SSL interac-
tion or sequence homology (Figure 1e) [4,28,29].
The sixth motif set describes network motifs containing
two nodes linked either by SSL interaction or by sequence
homology, with a third node connected to each of them
through protein-protein interaction or through correlated
expression (Figure 1f). All three proteins (a, b and c, as in
the schematic diagram in Figure 1f) may be members of
the same complex, with either b or c being sufficient to
support the essential function of the complex. Proteins b
and c may either reside in the complex at the same time, or
be mutually exclusive (that is, competing for the same
docking position in the complex). This can be generalized
to a network theme of a protein complex with partially
redundant or compensatory members. As one instance of
this theme, both Ssn8 and Cdc73 associate with the RNA
polymerase II complex [30,31], and only one of them is
required for viability (Figure 1f) [4].
We found the seventh motif set particularly interesting.
Motifs in this set contain two nodes linked by protein-
protein interaction or correlated expression, with a third
node connected to both either by SSL interaction or by
sequence homology (Figure 1g). Considering previously
observed correlations between protein-protein interaction
and co-expression [1,2] and between SSL interaction and
sequence homology [4], these motifs indicate that members
of a given protein complex or biological process often have
common synthetic genetic interaction partner(s) (Figure
1g). For instance, four out of the five Gim complex proteins
[32] exhibit synthetic lethality with Sec72 (Figure 1g) [4]. A
‘compensatory protein and complex/process’ theme, in
which a protein and a distinct protein complex or biological
process have compensatory function, results in synthetic
sickness or lethality between the protein and any member
of the complex/process essential to the function of that
complex/process. It is also possible for the single protein to
be part of another complex/process, so that these motifs
may in turn be signatures of a larger ‘compensatory com-
plexes/processes’ theme, which we examine further below.
In addition to the motif sets described above, there are five
motifs that we did not categorize (Figure 1h). These are
especially interesting, as they may represent unknown bio-
logical phenomena (described further in the Discussion).
Four-node network motifs corresponding to the
‘compensatory complexes/processes’ theme in the
integrated network
There are over 5,000 different connected four-node inter-
connection patterns with each pair of nodes bridged by at
most one link type. Here, we have focused on a subset of
four-node patterns of particular interest. Recalling the ‘com-
pensatory protein and complex/process’ theme (Figure 1g),
in which a protein has compensatory function with other
proteins in a complex or a process, we wondered whether
there also exists a network theme corresponding to a pair of
complexes/processes with compensatory function (con-
nected to each other by many links of SSL interaction or
sequence homology). We searched for all four-node inter-
connection patterns that would fit this ‘compensatory com-
plexes/processes’ theme (there are a total of 66 such patterns
- for a full list see Additional data file 3 available with the
online version of this article). Each pattern is composed of
two pairs of nodes such that a protein-protein interaction or
correlated expression link exists within each pair and SSL or
sequence homology links extend between the two pairs
(Figure 2). Using one thousand randomized networks to
assess significance, 48 out of the 66 patterns corresponding
to this theme were found to be network motifs defined by
significant enrichment (p Ͻ 0.001) in the real network (see
Figure 2 for a few examples and Additional data file 3 for a
full list). This supports our hypothesis that compensatory
pairs of complexes or processes are a theme in the integrated
S. cerevisiae network. The endoplasmic reticulum (ER)
protein-translocation subcomplex [33] and the Gim
complex [32], connected by many SSL interactions [4],
together illustrate this theme. This example also encom-
passes the ‘compensatory protein and complex/process’
theme depicted in Figure 1g, wherein multiple SSL or
homology links connect Sec72 and the Gim complex.
A thematic map of compensatory complexes
In order to identify additional pairs of protein complexes
with overlapping or compensatory function, we rendered a
map of the network in terms of the ‘compensatory com-
plexes’ theme. This map can also serve as a guide to ‘redun-
dant systems’ within the integrated S. cerevisiae network,
wherein two complexes provide the organism with robust-
ness with respect to random mutation when each complex
acts as a ‘failsafe mechanism’ for the other. To generate a
Journal of Biology 2005, Volume 4, Article 6 Zhang et al. 6.5
Journal of Biology 2005, 4:6
thematic map of compensatory complexes, we searched for
pairs of protein complexes with many inter-complex SSL
interactions. For this purpose, we only considered links of
protein-protein interaction and SSL interaction and reduced
the original network to one in which nodes are complexes
and links are SSL interactions (with multiple links allowed
between a pair of ‘collapsed’ nodes). For each pair of protein
complexes, we calculated the number of links between them
and assessed the significance of enrichment (see the Materi-
als and methods section for details). Among the 72 com-
plexes examined (for a list of complexes see Additional data
file 1 available with the online version of this article), we
found 21 pairs of complexes (involving 26 complexes; listed
in Additional data file 4) showing significant enrichment
(p Յ 0.05) for inter-complex SSL interactions. These com-
pensatory complexes can be visualized as a thematic map in
which each node represents a protein complex and each link
bridges a pair of complexes connected by a significant
number of SSL interactions (Figure 3).
A thematic map of regulonic complexes
Other themes depicted in Figure 1 that might be usefully
exploited to generate a simplified thematic map include the
‘regulonic complex’ theme (Figure 1c), wherein one tran-
scription factor (TF) regulates multiple members of a given
protein complex. Such a phenomenon has been observed
previously [34]. Here, we provide an automated procedure
for drawing the map in terms of this network theme. To this
end, we examined all possible pairings of a transcription
factor with a particular protein complex (together, a ‘TF-
complex pair’). We reduced the integrated network of stable
protein-protein interactions and transcriptional regulations
to one in which nodes are either transcription factors or
complexes and links indicate transcriptional regulation
(with multiple links allowed between a pair of nodes). For
each TF-complex pair, we calculated the number of links
between them, and assessed the significance according to
the probability of obtaining at least the observed number of
links if each transcription factor were to choose its regula-
tory targets randomly. A total of 91 TF-complex pairs
showed significant enrichment (p Յ 0.05) for transcrip-
tional regulation links. These significant TF-complex rela-
tionships can also be viewed as a network whose nodes are
transcription factors or complexes and whose links repre-
sent TF-complex pairs with significantly enriched transcrip-
tional regulation (Figure 4a). Judging from experimental
evidence, many of the links connect transcription factors
and protein complexes involved in the same biological
process, and complexes of related function are often con-
nected to the same transcription factor (Figure 4b).
Discussion
Network motifs have previously been sought in simple net-
works [5-7,10,11] and recently in an integrated network of
transcriptional regulation and protein-protein interaction
[9]. In this study, we sought network motifs in an integrated
S. cerevisiae network with five types of biological interaction.
We identified many significantly enriched motifs, which fall
into several classes with distinct biological implications,
revealing the interplay of different types of biological inter-
action in local network neighborhoods. Previously, motifs
6.6 Journal of Biology 2005, Volume 4, Article 6 Zhang et al. />Journal of Biology 2005, 4:6
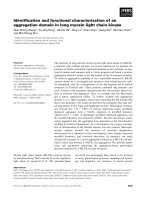
Figure 2
Four-node network motifs corresponding to the ‘compensatory complexes/processes’ theme. (a) A schematic diagram unifying the collection of
four-node motifs corresponding to the ‘compensatory complexes/processes’ theme; (b) examples of specific four-node motifs together with the
motif statistics; (c) a specific example of a four-node subgraph matching a few of these motifs; (d) the larger structure corresponding to the network
theme. Each colored link represents one of the four interaction types according to the color scheme (see key). For a given motif, N
real
is the number
of corresponding subgraphs in the real network, and N
rand
describes the number of corresponding subgraphs in a randomized network, represented
by the average and the standard deviation.
etc.
P
P
SS
S
S
P
X
SS
S
S
P
P
SS
H
P
X
HH
S
S/HS/H
S/HS/H
P/X
P/X
Sec72
Gim4
Yke2
Gim5
Pac10
Gim3
Sec66
Sec63Sec62
Sec72 Sec66
Gim5Yke2
SS
S
P,X
S
P
A motif example
A theme example
0.13±0.39
6.7×10
1
1.1±1.4
1.6×10
1
5.9±4.1
3.8×10
1
N
rand
N
real
0.16±0.50
3.5×10
2
S: synthetic sickness or lethality
H: sequence homology
X: correlated expression
P: stable physical interaction
Key
(a) (b)
(c) (d)
have been described as elementary building blocks of
complex networks [5-7,9,11]. Here, we describe network
themes - recurring higher-order interconnection patterns that
encompass multiple occurrences of network motifs. We show
that the abundance of most motifs in the integrated S. cere-
visiae network can be explained in terms of a network theme.
Network themes represent a more fundamental level of
abstraction that may often be preferable to network motifs
for several reasons. Network motifs have been defined with
artificial restrictions on the number of nodes and the spe-
cific interconnection patterns, and gene triads or tetrads cor-
responding to these motifs often do not exist in isolation in
the network. Rather, they often overlap extensively with one
another to form higher-order structures corresponding in
many cases to known biological phenomena; this is
supported by observations from other studies [9,10]. This
phenomenon suggests that motifs are often not ‘atomic’ ele-
ments of the network, but are instead signatures or
symptoms of more fundamental higher-order structures, or
network themes. Although many motifs can be explained in
terms of higher-order themes, some network motifs have an
elemental function that is preserved even when that motif is
embedded within a larger theme. This was demonstrated,
for example, by Alon and colleagues for the coherent feed-
forward loop [35].
In addition to the network themes and motifs depicted in
Figure 1a-g, there are five motifs that we did not categorize
(Figure 1h). Each of these motifs contains: a transcriptional
regulation link, with a third node connecting to the tran-
scription factor and its target via two stable physical interac-
tions (motif H1); two sequence homology links (motif H2);
one correlated expression link and one homology link,
Journal of Biology 2005, Volume 4, Article 6 Zhang et al. 6.7
Journal of Biology 2005, 4:6
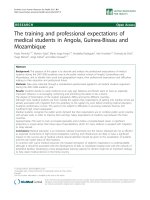
Figure 3
A thematic map of compensatory complexes. Here, nodes represent protein complexes, and a link is drawn between two nodes if there is a significantly
large number of inter-complex SSL interactions. Links between compensatory complexes are labeled with the numbers of supporting SSL interactions.
2
22
7
5
2
4
2
2
2
2
3
3
2
2
2
4
2
2
6
2
2
Gim complex
CCAAT-binding factor complex
Actin-associated proteins
ER protein-translocation subcomplex
Ctf19 complex
Kinesin-related motorproteins
Dynactin complex
Cytoplasmic ribosomal large subunit
Vps35/Vps29/Vps26 complex
HDB complex
SAGA complex
RNA pol ll
Ccr4 complex
SPB-associated proteins
Rad54-Rad51 complex
Replication complex
Rad17/Mec3/Ddc1 complex
Sister chromatid cohesion complex
Ctf3 complex
Mre11/Rad50/Xrs2 complex
Actin-associated motorproteins
Septin filaments
Pho85-Pho80 complex
Srb10 complex
1,3-β-D-glucan synthase
v-SNAREs
1,6-β-D-glucan synthesis
associated proteins
6.8 Journal of Biology 2005, Volume 4, Article 6 Zhang et al. />Journal of Biology 2005, 4:6
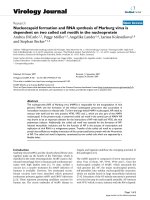
Figure 4
A thematic map of regulonic complexes. (a) Here, blue nodes represent transcription factors, red nodes represent protein complexes, and a link is
drawn between a transcription factor and a protein complex if the promoters of a significantly large number of complex members are bound by the
transcription factor. (b) An enlarged region of the regulonic complex map in (a). Links between transcription factors and the complexes they
regulate are labeled with the numbers of supporting interactions in the transcription regulation network. For lists of transcription factors and
complexes in the map see Additional data files 5 and 6, available with the online version of this article.
2
2
2
2
6
3
3
5
5
2
3
9
4
6
2
2
CHA4
CBF1
ABF1
RLM1
GCR1
Actin-associated proteins
NuA4 complex / ADA complex / SLIK complex / SAGA complex
rRNA splicing
NSP1 complex
RNA pol III / RNA pol I
RNase P / RNase MRP
Arp2p/Arp3p complex
Vps complex
RNA pol II
Mitochondrial ribosomal small subunit
TOM
TCP RING Complex
1
75
2
2
78
2
3
90
2
4
68
4
4
5
74
2
6
49
2
52
2
60
2
89
2
7
51
2
8
65
3
67
3
4
82
2
9
87
3
10
70
2
2
11
48
8
61
2
73
11
84
8
12
6
13
64
2
14
2
15
2
69
2
16
58
2
17
56
2
62
2
18
54
6
55
5
5
57
2
9
72
3
81
2
83
4
85
6
86
3
88
3
19
2
20
80
2
21
2
22
66
8
2
23
3
2
24
5
53
3
59
3
63
2
71
2
3
25
91
2
26
3
4
3
77
2
27
2
28
2
2
76
2
29
2
30
50
6
8
31
2
32
6
33
2
34
14
17
35
45
60
79
3
36
3
37
2
38
2
39
2
40
53
67
41
2
2
42
2
43
2
44
17
24
45
6
46
14
47
2
2
3
9
(a)
(b)
respectively (motif H3); one homology link and one corre-
lated expression link, respectively (motif H4), or two corre-
lated expression links (motif H5). Given that physical
interaction links are mostly transitive, motif H1 indicates that
transcription factors often co-complex with the target proteins
they regulate, and suggests a mechanism of feedback regula-
tion for transcription through protein-protein interaction.
Motif H2 implies sequence homology between a transcrip-
tion factor and its target, given the near transitivity of
homology links. Such homology may seem unexpected but
can be explained if there is frequent serial regulation of one
transcription factor by another, since transcriptional factors
often share homology, for example in their DNA binding
domains. Motif H5 may be due simply to the overlap
between transcriptional regulation links and correlated
expression links, and the near transitivity of correlated expres-
sion links. The implications of motifs H3 and H4 are unclear
to us; they might represent currently unknown trends in tran-
scriptional regulatory mechanism. We hope to address some
of these questions in the future by investigating the roles of
genes in the subnetworks corresponding to the motifs (for
example, whether the target gene in motif H2 is often a tran-
scription factor).
Both network motifs and themes represent network character-
istics that can be exploited to predict individual interactions
given sometimes-uncertain experimental evidence. As has
recently been shown, integration of multiple evidence types
[22,36-38] can be successfully used to predict protein-protein
interactions and synthetic genetic interactions, or to stratify
them by confidence. In addition, the dense local neighbor-
hood characteristic of the protein-protein interaction network
can be exploited to predict protein-protein interactions [39-
42]. This idea, extended to multi-color network motifs, allows
us to make predictions based on topological relationships
involving multiple types of links. In particular, we may
predict a certain type of link between a given pair of nodes if
its addition would complete a structure matching an enriched
network motif. For example, two genes with a common SSL
interaction partner may have increased probability of protein-
protein interaction, because the addition of a protein-protein
interaction link between these two genes results in a match to
motif G1 (Figure 1g). Similarly, an SSL link between two
genes can complete a match to motif G1 if the two genes are
connected to a third gene by a protein-protein interaction
link and an SSL link, respectively (Figure 1g). Such a ‘two-hop
physical-SSL’ relationship has been recently shown to be a
strong predictor of SSL interaction [38]. An interaction can
also be predicted if its addition fits into a recurring network
theme. For instance, there are significantly enriched SSL inter-
actions between the ER protein-translocation subcomplex
and the Gim complex (Figure 2). However, no SSL interac-
tions have been observed between Sec62 or Sec63, two
members of the ER protein-translocation subcomplex and
any protein in the Gim complex because Sec62 and Sec63
were not used as queries in the SGA analysis [4]. We therefore
hypothesize that Sec62 or Sec63 has SSL interactions with
many members of the Gim complex.
In addition, since themes represent the network organization
at the functional level, they can also be used to predict func-
tions for genes involved in a specific theme. For example, in
the feed-forward theme depicted in Figure 1a, most of the
genes regulated by both Mcm1 and Swi4 are involved in
control or execution of the cell cycle. We therefore hypothesize
that Yor315w, a protein of unknown function, is involved in
the cell cycle. More refined hypotheses can be achieved by
incorporating other information such as sequence data and
expression profiles. Predictions based on network themes may
be robust with respect to errors in the input data, since they
depend on connectivity patterns in extended network neigh-
borhoods instead of one or very few links.
To assess whether SSL interactions involving essential genes
are enriched in subgraphs matching the motifs, we counted,
for each motif containing an SSL link, the fraction of sub-
graphs with at least one SSL interaction involving an essen-
tial gene. The results are summarized in Additional data file
2, available with the online version of this article. In the
SGA analysis, 11 of the 132 query genes are essential.
Among the 3,060 SSL interactions, 322 of them (10.5%)
involve an essential gene. Results for the network motifs are
mostly consistent with this frequency of essentiality: for
most motifs (E1, E2, E3, G1, G4 and G5), approximately
10% of the matching subgraphs contain SSL interactions
involving an essential gene (see Additional data file 2). It is
interesting, however, that subgraphs matching motifs F1
and F3 are particularly enriched with SSL interactions
involving essential genes (36.4% and 24.4%, respectively).
This suggests that SSL interactions within a protein complex
may often involve essential genes.
Each network theme has a different biological implication,
and each permits a natural simplification of the integrated
network. To demonstrate this, we produced thematic maps
of compensatory complexes and of regulonic complexes.
The map of compensatory complexes identifies specific
protein complexes with overlapping or compensatory func-
tion. Many of the links connect functionally related com-
plexes, as supported by previous experimental evidence. For
example, the replication complex, is ‘genetically connected’
to the Mre11/Rad50/Xrs2 complex [43], the Rad54-Rad51
complex [44], and the Rad17/Mec3/Ddc1 complex [45].
The first two function in the repair of double-strand DNA
breaks [44,46] and the third is required for cell-cycle check-
point control after DNA damage [47], both of which are
Journal of Biology 2005, Volume 4, Article 6 Zhang et al. 6.9
Journal of Biology 2005, 4:6
associated with DNA replication. The histone deacetylase B
(HDB) complex [48,49] is linked to the SAGA complex
[50]; both of these affect histone acetylation and are
important components of transcriptional regulation [51].
There are also some unverified but intriguing links, such as
the one between the Gim complex [32] and the CCAAT-
binding factor [22], which connects two seemingly unre-
lated complexes (Figure 3). The potential functional
relationship between these complexes awaits further experi-
mental validation.
Novel predictions for synthetic sick or lethal interactions
can be made from the thematic map of compensatory com-
plexes. Specifically, we can predict any two proteins to have
an SSL interaction if they are members of two separate com-
plexes bridged by a link in the map. There were 1,134 such
protein pairs that had not been previously tested by the SGA
study used to derive the compensatory complex map. We
sought independent validation of these predictions among
published smaller-scale studies of genetic interaction. We
conservatively estimate that 10% of these pairs will have
been examined for genetic interaction (note that Tong et al.
[4] , the largest systematic study to date, examined only
approximately 4% of all gene pairs). Therefore, we might
only hope to find approximately 113 validated pairs (10%
of 1,134 predictions). Tong et al. [4] observed the baseline
rate of SSL interaction to be 0.5%, so by chance we might
expect to find fewer than one SSL interaction (0.5% of 10%
of 1,134). Our literature search revealed ten gene pairs with
known SSL interactions among the predictions: Arp2-Myo1
[52], Vrp1-Myo1 [53], Las17-Myo1 [54], Bem1-Myo1 [54],
Rvs167-Myo1 [55], Rvs167-Myo2 [55], Smy1-Pfy1 [56],
Rad50-Cdc2 [57,58], Rad54-Cdc2 [57], and Rad51-Cdc2
[58]. From this we conservatively estimate a success rate of
around 9%, demonstrating the value of the thematic map in
predicting new SSL interactions. Our use of the thematic map
to predict genetic interactions differs from the previous pre-
diction approach based on two-hop physical-SSL interactions
[38] in that here we required a greater abundance of SSL
interactions between two protein complexes than would be
expected by chance, whereas previous work did not exploit
the number of observed two-hop physical-SSL interactions.
Furthermore, the thematic map approach has the potential
to predict genetic interaction between two genes even if
neither gene has any previously known SSL interactions.
In producing the thematic map of compensatory complexes,
the statistical power was limited because only 4% of yeast
gene pairs have been examined for synthetic genetic interac-
tions [4]. Many compensatory complex pairs have escaped
detection because too few inter-complex protein pairs have
been tested for SSL to achieve statistical significance. We
expect this map to grow substantially as large-scale studies
of genetic interaction proceed [59]. In higher organisms for
which exhaustive determination of genetic interaction is a
more distant goal, we may advance our understanding more
rapidly by choosing a ‘scaffold’ set of genes such that each
known or hypothesized protein complex or pathway is rep-
resented by at least one query gene in an SSL screen.
Materials and methods
Constructing an integrated S. cerevisiae network
Synthetic genetic interactions between 132 query genes and
about 5,000 array genes were obtained from a recent large-
scale SGA analysis in S. cerevisiae [4]. Genome-wide BLAST
[12] was performed using all yeast protein sequences. Pairs
of proteins with E values of less than 10
-3
were considered
homologous. Pearson correlation coefficients were calcu-
lated for all pairs of yeast proteins based on the Rosetta
compendium microarray dataset [13]. Protein pairs with
correlation coefficients larger than 0.6 were regarded as
having correlated expression. Protein complexes were
obtained from the MIPS [14] database and two large-scale
affinity purification studies [15,16]. All pairs of proteins
residing in the same complex were treated as having stable
protein-protein interactions. Transcriptional regulation was
inferred from the genome-wide ChIP studies of 106 yeast
transcription factors [7]. If transcription factor A binds to
the promoter region of gene B with a p value of less than
0.001, then a directed transcriptional regulatory link is
assigned from A to B.
Detecting network motifs
We enumerated all connected three-node subgraphs in the
network as previously described [5]. For each interconnec-
tion pattern defined by one link between each pair of
nodes, we recorded the number of subgraphs matching this
pattern in the real network as well as in all randomized net-
works. A subgraph is considered a ‘match’ to the pattern if
the subgraph can be transformed to the pattern by any com-
bination of node identity permutations or link removals.
The p value for the enrichment of an interconnection
pattern is defined by the fraction of randomized networks
having at least the number of matching subgraphs as the
real network.
Generating randomized networks
Different types of interactions in the integrated network
were randomized independently, and then overlaid to gen-
erate a randomized multi-color network. For each interac-
tion type, we applied a previously described method [60] to
sample from an ensemble of random networks with the
property that the expected degree of each node is the same
as its degree in the real network. Such a method uniformly
samples networks with the same degree sequence. The
6.10 Journal of Biology 2005, Volume 4, Article 6 Zhang et al. />Journal of Biology 2005, 4:6
fugacities - parameters controlling the expected degree for
each node [60] - were obtained using the multidimensional
Newton-Raphson method.
Links in the network of transcription regulation are direc-
tional, originating from the transcriptional regulator and
ending at the target gene. We distinguished two types of
degree for each node - the in-degree (the number of links
that end at the node) and the out-degree (the number of
links that originate from the node). We then sampled from
an ensemble of random networks [60] such that the
expected in-degree and out-degree of each node in the
ensemble are the same as the corresponding in-degree and
out-degree, respectively, in the real network. Such a ran-
domization procedure preserved the directionality of the
transcriptional regulatory links.
Nodes in the SSL network can be divided into three mutually-
exclusive categories - genes that were used as both query
and array genes in the SGA analysis (denoted as
‘query/array’ genes), genes that were used only as query
genes (denoted as ‘query-only’ genes), and genes that were
used only as array genes (denoted as ‘array-only’ genes) [4].
Since an SSL link can only exist between a query gene (that
is, either a ‘query/array’ gene or a ‘query-only’ gene) and an
array gene (that is, either a ‘query/array’ gene or an ‘array-
only’ gene) [4], we decomposed the SSL network into three
sub-networks - a ‘query/array< >query/array’ sub-network
containing only links between ‘query/array’ genes, a ‘query-
only< >query/array’ sub-network containing only links
between ‘query-only’ genes and ‘query/array’ genes, and a
‘query< >array-only’ sub-network containing only links
between ‘query’ genes (that is, either ‘query/array’ or ‘query-
only’ genes) and ‘array-only’ genes. When randomizing each
of the three sub-networks, only links between the specified
gene groups were allowed (for example, in the ‘query< >
array-only’ sub-network, only links between ‘query’ genes
and ‘array-only’ genes were allowed in the randomized
network). A randomized SSL network was then generated by
overlaying three such random sub-networks, one from each
type. The above procedure preserved the inspection bias of
the SGA method, and prohibited any link that could never
be observed based on the experiment design.
Creating the thematic map of compensatory
complexes
To generate a thematic map of compensatory complexes, the
integrated protein network containing SSL interaction links
from the SGA analysis [4] and stable protein-protein interac-
tion links from the MIPS complex catalog [14] was trans-
formed to a network of protein complexes by merging
multiple nodes belonging to the same protein complex into a
single node. Nodes that do not belong to any known protein
complex were removed, along with their associated SSL links.
A few mistakes in the MIPS complex catalog were corrected,
and some redundantly listed complexes were merged (for the
final list of complexes see Additional data file 1, available
with the online version of this article). This generated a multi-
graph in which multiple links are allowed between two
nodes. For each pair of complexes, we recorded the number
of links between them, and calculated the probability of
obtaining an equal or greater number of links if each protein
were to choose its SSL interaction partners randomly from all
eligible proteins. Here two proteins are eligible interaction
partners for each other if the pair has been tested by the SGA
method [4] and both have at least one observed SSL partner
in the transformed network. The nature of the SSL network,
introduced from the SGA experiments, complicates the analy-
sis, because interactions were tested only between ‘query’
genes and each of the 5,000 or so ‘array’ genes [4]. For each
complex, therefore, some links originate with a query gene in
the complex and end with a query gene outside the complex,
some links connect a query gene within the complex and a
non-query gene outside the complex, while others link a non-
query gene within the complex and a query gene outside the
complex. Hence, each complex has three different degree
types, and the total number of links between two complexes
follows a distribution corresponding to the sum of three
hypergeometric distributions. The p values were calculated
based on this composite distribution. A pair of complexes is
connected in the map if the p value is less than 0.05 and there
are two or more inter-complex SSL links.
Creating the thematic map of regulonic complexes
The integrated protein network containing directed tran-
scriptional regulation links from the genome-wide ChIP
study (with a p value threshold of 0.005) [7], and stable
protein-protein interaction links from the MIPS complex
catalog was transformed to a network of transcription
factors and protein complexes by collapsing nodes belong-
ing to the same protein complex into a single node. Pairs of
complexes that overlap by more than 50% were merged.
This generates a multigraph in which multiple links are
allowed between two nodes. For each TF-complex pair, we
recorded the number of links between them, and calculated
the probability of obtaining at least the same number of
links if each node chose its interaction partners randomly.
We calculated p values according to the cumulative hyperge-
ometric distribution. A TF-complex pair is connected in the
map if the p value is less than 0.05 and there are two or
more regulatory links between the TF and the complex.
Additional data files
The following supplementary tables of motifs and protein
complexes are provided as Additional data files with the
Journal of Biology 2005, Volume 4, Article 6 Zhang et al. 6.11
Journal of Biology 2005, 4:6
online version of this article: Additional data file 1 is a
zipped archive containing the five types of biological inter-
actions in the integrated S. cerevisiae network as well as lists
of MIPS complexes used to generated Figure 3 and Figure 4;
Additional data file 2 lists all three-node interconnection
patterns examined; Additional data file 3 lists all four-node
interconnection patterns examined; Additional data file 4
lists all complexes in Figure 3; Additional data file 5 lists all
the transcription factors in Figure 4; Additional data file 6
lists all protein complexes in Figure 4.
Acknowledgements
We thank G. Berriz, F. Gibbons, M. Umbarger and Z. Wunderlich for
critical comments of the manuscript. L.V.Z. was supported by Fu and
Ryan Fellowships. O.D.K., S.L.W., and D.S.G. were supported by NRSA
(from NHGRI), Ryan, and NSF Fellowships, respectively. In addition, this
work was supported by an institutional grant from HHMI (F.P.R.), the
Milton Fund of Harvard University (S.L.W. and F.P.R.), and grants from
the CIHR (B.A. and C.B.), Genome Canada (B.A., C.B. and H.B.),
Genome Ontario (B.A. and C.B), and Genome Quebec (H.B.).
References
1. Ge H, Liu Z, Church GM, Vidal M: Correlation between tran-
scriptome and interactome mapping data from Saccha-
romyces cerevisiae. Nat Genet 2001, 29:482-486.
2. Jansen R, Greenbaum D, Gerstein M: Relating whole-genome
expression data with protein-protein interactions. Genome
Res 2002, 12:37-46.
3. Yu H, Luscombe NM, Qian J, Gerstein M: Genomic analysis of
gene expression relationships in transcriptional regulatory
networks. Trends Genet 2003, 19:422-427.
4. Tong AH, Lesage G, Bader GD, Ding H, Xu H, Xin X, Young J,
Berriz GF, Brost RL, Chang M et al.: Global mapping of the
yeast genetic interaction network. Science 2004, 303:808-813.
5. Milo R, Shen-Orr S, Itzkovitz S, Kashtan N, Chklovskii D, Alon U:
Network motifs: simple building blocks of complex net-
works. Science 2002, 298:824-827.
6. Shen-Orr SS, Milo R, Mangan S, Alon U: Network motifs in the
transcriptional regulation network of Escherichia coli. Nat
Genet 2002, 31:64-68.
7. Lee TI, Rinaldi NJ, Robert F, Odom DT, Bar-Joseph Z, Gerber
GK, Hannett NM, Harbison CT, Thompson CM, Simon I et al.:
Transcriptional regulatory networks in Saccharomyces
cerevisiae. Science 2002, 298:799-804.
8. Milo R, Itzkovitz S, Kashtan N, Levitt R, Shen-Orr S, Ayzenshtat I,
Sheffer M, Alon U: Superfamilies of evolved and designed
networks. Science 2004, 303:1538-1542.
9. Yeger-Lotem E, Sattath S, Kashtan N, Itzkovitz S, Milo R, Pinter
RY, Alon U, Margalit H: Network motifs in integrated cellu-
lar networks of transcription-regulation and protein-
protein interaction. Proc Natl Acad Sci USA 2004, 101:5934-5939.
10. Dobrin R, Beg QK, Barabasi AL, Oltvai ZN: Aggregation of
topological motifs in the Escherichia coli transcriptional
regulatory network. BMC Bioinformatics 2004, 5:10.
11. Kashtan N, Itzkovitz S, Milo R, Alon U: Topological generaliza-
tions of network motifs. Phys Rev E Stat Nonlin Soft Matter Phys
2004, 70:031909.
12. Altschul SF, Madden TL, Schaffer AA, Zhang J, Zhang Z, Miller W,
Lipman DJ: Gapped BLAST and PSI-BLAST: a new genera-
tion of protein database search programs. Nucleic Acids Res
1997, 25:3389-3402.
13. Hughes TR, Marton MJ, Jones AR, Roberts CJ, Stoughton R,
Armour CD, Bennett HA, Coffey E, Dai H, He YD et al.:
Functional discovery via a compendium of expression
profiles. Cell 2000, 102:109-126.
14. Mewes HW, Frishman D, Guldener U, Mannhaupt G, Mayer K,
Mokrejs M, Morgenstern B, Munsterkotter M, Rudd S, Weil B:
MIPS: a database for genomes and protein sequences.
Nucleic Acids Res 2002, 30:31-34.
15. Gavin AC, Bosche M, Krause R, Grandi P, Marzioch M, Bauer A,
Schultz J, Rick JM, Michon AM, Cruciat CM et al.: Functional
organization of the yeast proteome by systematic analysis
of protein complexes. Nature 2002, 415:141-147.
16. Ho Y, Gruhler A, Heilbut A, Bader GD, Moore L, Adams SL, Millar
A, Taylor P, Bennett K, Boutilier K et al.: Systematic identifica-
tion of protein complexes in Saccharomyces cerevisiae by
mass spectrometry. Nature 2002, 415:180-183.
17. Wagner A: The yeast protein interaction network evolves
rapidly and contains few redundant duplicate genes. Mol Biol
Evol 2001, 18:1283-1292.
18. Solé RV, Pastor-Satorras R, Smith E, Kepler TB: A model of
large-scale proteome evolution. Adv Complex Systems 2002,
5:43-54.
19. Mai B, Miles S, Breeden LL: Characterization of the ECB
binding complex responsible for the M/G(1)-specific tran-
scription of CLN3 and SWI4. Mol Cell Biol 2002, 22:430-441.
20. Fitch MJ, Donato JJ, Tye BK: Mcm7, a subunit of the presump-
tive MCM helicase, modulates its own expression in con-
junction with Mcm1. J Biol Chem 2003, 278:25408-25416.
21. Simon I, Barnett J, Hannett N, Harbison CT, Rinaldi NJ, Volkert TL,
Wyrick JJ, Zeitlinger J, Gifford DK, Jaakkola TS et al.: Serial reg-
ulation of transcriptional regulators in the yeast cell cycle.
Cell 2001, 106:697-708.
22. McNabb DS, Xing Y, Guarente L: Cloning of yeast HAP5: a
novel subunit of a heterotrimeric complex required for
CCAAT binding. Genes Dev 1995, 9:47-58.
23. Gancedo JM: Yeast carbon catabolite repression. Microbiol Mol
Biol Rev 1998, 62:334-361.
24. Zhang LV, Wong SL, King OD, Roth FP: Predicting co-com-
plexed protein pairs using genomic and proteomic data
integration. BMC Bioinformatics 2004, 5:38.
25. Spector MS, Raff A, DeSilva H, Lee K, Osley MA: Hir1p and
Hir2p function as transcriptional corepressors to regulate
histone gene transcription in the Saccharomyces cerevisiae
cell cycle. Mol Cell Biol 1997, 17:545-552.
26. Arnold I, Pfeiffer K, Neupert W, Stuart RA, Schagger H: ATP
synthase of yeast mitochondria. Isolation of subunit j and
disruption of the ATP18 gene. J Biol Chem 1999, 274:36-40.
27. Arnold I, Pfeiffer K, Neupert W, Stuart RA, Schagger H: Yeast
mitochondrial F1F0-ATP synthase exists as a dimer:
identification of three dimer-specific subunits. EMBO J 1998,
17:7170-7178.
28. Liu H, Bretscher A: Characterization of TPM1 disrupted
yeast cells indicates an involvement of tropomyosin in
directed vesicular transport. J Cell Biol 1992, 118:285-299.
29. Wang T, Bretscher A: The rho-GAP encoded by BEM2 regu-
lates cytoskeletal structure in budding yeast. Mol Biol Cell
1995, 6:1011-1024.
30. Myer VE, Young RA: RNA polymerase II holoenzymes and
subcomplexes. J Biol Chem 1998, 273:27757-27760.
31. Mueller CL, Jaehning JA: Ctr9, Rtf1, and Leo1 are compo-
nents of the Paf1/RNA polymerase II complex. Mol Cell Biol
2002, 22:1971-1980.
32. Geissler S, Siegers K, Schiebel E: A novel protein complex pro-
moting formation of functional alpha- and gamma-tubulin.
EMBO J 1998, 17:952-966.
33. Hanein D, Matlack KE, Jungnickel B, Plath K, Kalies KU, Miller KR,
Rapoport TA, Akey CW: Oligomeric rings of the Sec61p
complex induced by ligands required for protein trans-
location. Cell 1996, 87:721-732.
34. Simonis N, van Helden J, Cohen GN, Wodak SJ: Transcrip-
tional regulation of protein complexes in yeast. Genome Biol
2004, 5:R33.
35. Mangan S, Zaslaver A, Alon U: The coherent feedforward loop
serves as a sign-sensitive delay element in transcription
networks. J Mol Biol 2003, 334:197-204.
36. Jansen R, Yu H, Greenbaum D, Kluger Y, Krogan NJ, Chung S,
Emili A, Snyder M, Greenblatt JF, Gerstein M: A Bayesian
6.12 Journal of Biology 2005, Volume 4, Article 6 Zhang et al. />Journal of Biology 2005, 4:6
networks approach for predicting protein-protein inter-
actions from genomic data. Science 2003, 302:449-453.
37. Jansen R, Lan N, Qian J, Gerstein M: Integration of genomic
datasets to predict protein complexes in yeast. J Struct and
Funct Genomics 2002, 2:71-81.
38. Wong SL, Zhang LV, Tong AH, Li Z, Goldberg DS, King OD,
Lesage G, Vidal M, Andrews B, Bussey H et al.: Combining bio-
logical networks to predict genetic interactions. Proc Natl
Acad Sci USA 2004, 101:15682-15687.
39. Goldberg DS, Roth FP: Assessing experimentally derived
interactions in a small world. Proc Natl Acad Sci USA 2003,
100:4372-4376.
40. Bader GD, Hogue CW: An automated method for finding
molecular complexes in large protein interaction net-
works. BMC Bioinformatics 2003, 4:2.
41. Albert I, Albert R: Conserved network motifs allow
protein-protein interaction prediction. Bioinformatics 2004,
20:3346-3352.
42. King AD, Przulj N, Jurisica I: Protein complex prediction via
cost-based clustering. Bioinformatics 2004, 20:3013-3020.
43. Usui T, Ohta T, Oshiumi H, Tomizawa J, Ogawa H, Ogawa T:
Complex formation and functional versatility of Mre11 of
budding yeast in recombination. Cell 1998, 95:705-716.
44. Solinger JA, Lutz G, Sugiyama T, Kowalczykowski SC, Heyer WD:
Rad54 protein stimulates heteroduplex DNA formation in
the synaptic phase of DNA strand exchange via specific
interactions with the presynaptic Rad51 nucleoprotein
filament. J Mol Biol 2001, 307:1207-1221.
45. Majka J, Burgers PM: Yeast Rad17/Mec3/Ddc1: a sliding
clamp for the DNA damage checkpoint. Proc Natl Acad Sci
USA 2003, 100:2249-2254.
46. Lobachev KS, Gordenin DA, Resnick MA: The Mre11 complex
is required for repair of hairpin-capped double-strand
breaks and prevention of chromosome rearrangements.
Cell 2002, 108:183-193.
47. Kondo T, Matsumoto K, Sugimoto K: Role of a complex con-
taining Rad17, Mec3, and Ddc1 in the yeast DNA damage
checkpoint pathway. Mol Cell Biol 1999, 19:1136-1143.
48. Kadosh D, Struhl K: Repression by Ume6 involves recruitment
of a complex containing Sin3 corepressor and Rpd3 histone
deacetylase to target promoters. Cell 1997, 89:365-371.
49. Zhang Y, Sun ZW, Iratni R, Erdjument-Bromage H, Tempst P,
Hampsey M, Reinberg D: SAP30, a novel protein conserved
between human and yeast, is a component of a histone
deacetylase complex. Mol Cell 1998, 1:1021-1031.
50. Grant PA, Schieltz D, Pray-Grant MG, Steger DJ, Reese JC, Yates
JR 3rd, Workman JL: A subset of TAF(II)s are integral com-
ponents of the SAGA complex required for nucleosome
acetylation and transcriptional stimulation. Cell 1998,
94:45-53.
51. Kadonaga JT: Eukaryotic transcription: an interlaced
network of transcription factors and chromatin-modifying
machines. Cell 1998, 92:307-313.
52. Norden C, Liakopoulos D, Barral Y: Dissection of septin actin
interactions using actin overexpression in Saccharomyces
cerevisiae. Mol Microbiol 2004, 53:469-483.
53. Roumanie O, Peypouquet MF, Bonneu M, Thoraval D, Doignon F,
Crouzet M: Evidence for the genetic interaction between
the actin-binding protein Vrp1 and the RhoGAP Rgd1
mediated through Rho3p and Rho4p in Saccharomyces
cerevisiae. Mol Microbiol 2000, 36:1403-1414.
54. Roumanie O, Peypouquet MF, Thoraval D, Doignon F, Crouzet M:
Functional interactions between the VRP1-LAS17 and
RHO3-RHO4 genes involved in actin cytoskeleton
organization in Saccharomyces cerevisiae. Curr Genet 2002,
40:317-325.
55. Breton AM, Aigle M: Genetic and functional relationship
between Rvsp, myosin and actin in Saccharomyces cere-
visiae. Curr Genet 1998, 34:280-286.
56. Marcoux N, Cloutier S, Zakrzewska E, Charest PM, Bourbonnais
Y, Pallotta D: Suppression of the profilin-deficient pheno-
type by the RHO2 signaling pathway in Saccharomyces
cerevisiae. Genetics 2000, 156:579-592.
57. Giot L, Chanet R, Simon M, Facca C, Faye G: Involvement of
the yeast DNA polymerase delta in DNA repair in vivo.
Genetics 1997, 146:1239-1251.
58. Chanet R, Heude M: Characterization of mutations that are
synthetic lethal with pol3-13, a mutated allele of DNA
polymerase delta in Saccharomyces cerevisiae. Curr Genet
2003, 43:337-350.
59. Ooi SL, Shoemaker DD, Boeke JD: DNA helicase gene inter-
action network defined using synthetic lethality analyzed
by microarray. Nat Genet 2003, 35:277-286.
60. Park J, Newman MEJ: Origin of degree correlations in the
Internet and other networks. Phys Rev E Stat Nonlin Soft Matter
Phys 2003, 68:026112.
Journal of Biology 2005, Volume 4, Article 6 Zhang et al. 6.13
Journal of Biology 2005, 4:6