Báo cáo sinh học: "Conservation of core gene expression in vertebrate tissues" pdf
Bạn đang xem bản rút gọn của tài liệu. Xem và tải ngay bản đầy đủ của tài liệu tại đây (1.83 MB, 17 trang )
Research article
CCoonnsseerrvvaattiioonn ooff ccoorree ggeennee eexxpprreessssiioonn iinn vveerrtteebbrraattee ttiissssuueess
Esther T Chan*
¶
, Gerald T Quon
†¶
, Gordon Chua
঴
, Tomas Babak
¶#
,
Miles Trochesset
†‡
, Ralph A Zirngibl*, Jane Aubin*, Michael JH Ratcliffe
§
,
Andrew Wilde*, Michael Brudno
†‡¶
, Quaid D Morris*
†‡¶
and Timothy R Hughes*
‡¶
Addresses: *Department of Molecular Genetics,
†
Department of Computer Science,
‡
Banting and Best Department of Medical Research,
§
Department of Immunology and Sunnybrook Research Institute, and
¶
Terrence Donnelly Centre for Cellular and Biomolecular Research,
University of Toronto, 160 College Street, Toronto, Ontario M5S 3E1, Canada.
¥
Current address: Department of Biological Sciences,
University of Calgary, 2500 University Drive NW, Calgary, Alberta, T2N 1N4 Canada.
#
Current address: Rosetta Inpharmatics, 401 Terry
Avenue North, Seattle, WA 98109, USA.
Correspondence: Quaid D Morris. Email: Timothy R Hughes. Email:
AAbbssttrraacctt
BBaacckkggrroouunndd
Vertebrates share the same general body plan and organs, possess related sets of
genes, and rely on similar physiological mechanisms, yet show great diversity in morphology,
habitat and behavior. Alteration of gene regulation is thought to be a major mechanism in
phenotypic variation and evolution, but relatively little is known about the broad patterns of
conservation in gene expression in non-mammalian vertebrates.
RReessuullttss
We measured expression of all known and predicted genes across twenty tissues in
chicken
,
frog and pufferfish. By combining the results with human and mouse data and
considering only ten common tissues, we have found evidence of conserved expression for
more than a third of unique orthologous genes. We find that, on average, transcription factor
gene expression is neither more nor less conserved than that of other genes. Strikingly,
conservation of expression correlates poorly with the amount of conserved nonexonic
sequence, even using a sequence alignment technique that accounts for non-collinearity in
conserved elements. Many genes show conserved human/fish expression despite having
almost no nonexonic conserved primary sequence.
CCoonncclluussiioonnss
There are clearly strong evolutionary constraints on tissue-specific gene
expression. A major challenge will be to understand the precise mechanisms by which many
gene expression patterns remain similar despite extensive
cis
-regulatory restructuring.
Journal of Biology
2009,
88::
33
Open Access
Published: 16 April 2009
Journal of Biology
2009,
88::
33 (doi:10.1186/jbiol130)
The electronic version of this article is the complete one and can be
found online at />Received: 23 January 2009
Revised: 12 March 2009
Accepted: 18 March 2009
© 2009 Chan
et al.
; licensee BioMed Central Ltd.
This is an Open Access article distributed under the terms of the Creative Commons Attribution License ( />which permits unrestricted use, distribution, and reproduction in any medium, provided the original work is properly cited.
BBaacckkggrroouunndd
Vertebrates all share a body plan, gene number and gene
catalog [1-4] inherited from a common progenitor, but so
far it has been unclear to what degree gene expression is
conserved. King and Wilson [5] initially posited that
phenotypic differences among primates are mainly due to
adaptive changes in gene regulation, rather than to changes
in protein-coding sequence or function, and this idea has
accumulated supporting evidence in recent years [6-12].
Recent work has indicated that gene expression evolves in a
fashion similar to other traits, where in the absence of
selection, random mutations introduce variants within a
population [11,13-19]. Changes negatively affecting fitness
are probably eliminated by purifying selection: core cellular
processes seem to be coexpressed from yeast to human [20],
and conservation of the expression of individual genes in
specific tissues has been observed across distantly related
vertebrates [21-24], perhaps reflecting requirements for
patterning and development as well as conserved functions
of organs, tissues and cell types. Conversely, changes that
benefit fitness (for example, under new ecological
pressures) may become fixed: changes in gene expression
are believed to underlie many differences in morphology,
physiology and behavior and, indeed, subtle differences in
gene regulation can result in spatial and temporal
alterations in transcript levels, with phenotypic
consequences at the cell, tissue and organismal levels [5,25].
The degree to which stabilizing selection constrains
directional selection and neutral drift across the full
vertebrate subphylum is, to our knowledge, unknown.
Comparative genomic analyses provide a perspective on the
evolution of both cis- and trans-regulatory mechanisms, and
they are often used as a starting point for the identification
of regulatory mechanisms. One estimate, using collinear
multiple-genome alignments, suggested that roughly a
million sequence elements are conserved in vertebrates
(particularly among mammals, which represent the
majority of sequenced vertebrates) [26-29], with most being
nonexonic [28], and a series of studies have demonstrated
the cis-regulatory potential of the most highly conserved
nonexonic elements (for example, [27,29,30]). Another
study [31] found that only 29% of nonexonic mammalian
conserved bases are evident in chicken, and that nearly all
aligning sequence in fish overlaps exons, raising the
possibility that gene regulatory mechanisms may be very
different among vertebrate clades. Absence of conserved
sequence does not imply lack of regulatory conservation,
however, as many known cis-regulatory elements seem to
undergo rapid turnover [32,33], and there are examples in
which orthologous genes have similar expression patterns
despite apparent lack of sequence conservation in regulatory
regions [34]. As further evidence of pervasive regulatory
restructuring in vertebrate evolution, an analysis [35] that
accounted for shuffling (non-collinearity) of locally con-
served sequences suggested that the number of conserved
elements may be several fold higher than collinear align-
ments detect, particularly between distant vertebrate
relatives, such as mammals and fish.
Trans-acting factors (transcription factors or TFs) also
show examples of striking conservation, such as among
the homeotic factors, and diversifying selection [36].
Studies comparing expression patterns between human
and chimpanzee liver found that TF genes were enriched
among the genes with greatest human-specific increase in
expression levels [37,38], supporting arguments for
alteration of trans-regulatory architecture as a driving
evolutionary mechanism [39]. On the other hand, in the
Drosophila developmental transition, expression of trans-
cription factor genes is more evolutionarily stable than
expression of their targets, on average [40]. The fact that
enhancers will often function similarly in fish and
mammals, even when the enhancer itself is not conserved,
indicates that mechanisms underlying cell-specific and
developmental expression are likely to be widely
conserved across vertebrates [41,42].
Global trends in conservation of gene expression, conser-
vation of cis-regulatory sequence and relationships between
the two are not completely understood [13,39,41], partly
because the cis-regulatory ‘lexicon’ (that is, how TF binding
sites combine to form enhancers) remains mostly un-
known, testing individual enhancers is tedious and
expensive, and many vertebrates are not amenable to
genetic experimentation. These issues are of both academic
and practical consequence: in addition to our curiosity
about the origin and distinctive characteristics of the human
species, primary sequence conservation is widely used to
identify regulatory mechanisms. We reasoned that
expression profiling data from species spanning much
greater phylogenetic distance than humans and mice, and
thus having greater opportunity for both neutral drift and
positive selection, would allow assessment of the degree of
conservation of tissue gene expression among all
vertebrates, and a comparison of the conservation of expres-
sion to the conservation of nonexonic primary sequence.
Here, we describe a survey of gene expression in adult
tissues and organs in the main vertebrate clades: mammals,
avians/reptiles, amphibians and fish. Our analyses demon-
strate that core tissue-specific gene expression patterns are
conserved across all major vertebrate lineages, but that the
correspondence between conservation of expression and
amount of conserved nonexonic sequence is weak overall,
at least at a level that is detectable by current alignment
approaches.
33.2
Journal of Biology
2009, Volume 8, Article 33 Chan
et al.
/>Journal of Biology
2009,
88::
33
RReessuullttss
TTiissssuuee ssppeecciiffiicc ggeennee eexxpprreessssiioonn iiss bbrrooaaddllyy ccoorrrreellaatteedd aaccrroossss
vveerrtteebbrraatteess
To examine gene expression in a broad range of vertebrates,
we collected a compendium of gene expression datasets,
consisting of previously published datasets for human [43]
and mouse [44], and newly generated datasets containing
20 tissues each from chicken (Gallus gallus), frog (Xenopus
tropicalis) and pufferfish (Tetraodon nigroviridis). Details of
the experiments are found in the Materials and methods;
lists of tissues are found in Additional data file 1. Clustering
analyses of each dataset separately (Additional data file 2)
shows that prominent tissue-specific expression patterns are
found in all vertebrates.
To ask whether tissue-specific gene expression patterns are
conserved among vertebrates, we focused on 1-1-1-1-1
orthologs (genes that are present in a single unambiguous
copy in each of the five genomes), because genes that have
undergone duplication events are subject to different
constraints from singletons [45,46]. Among 4,898 1-1-1-1-1
orthologs found by Inparanoid [47], 3,074 were measured
by microarrays in all ten common tissues of chicken, frog,
pufferfish, and mammals (human and mouse combined
expression - see Materials and methods). The expression
profiles of these 3,074 genes in analogous and functionally
related tissues in different species were more similar than
they were to those of unrelated tissues from the same
species (Figure 1), even for pufferfish, which diverged from
the other vertebrates in our study roughly 450 million years
ago (Mya), well before the divergence of frog (about
360 Mya) or chicken (about 310 Mya) [48]. Despite
differences in cognition and behavior between humans and
other species, overall gene expression in the brain is most
similar across the species studied compared with expression
in other tissues (median expression ratio Pearson
correlation (r) = 0.63), consistent with a previous study
comparing human and chimpanzee [49]. The relatively low
divergence of gene expression in brain is hypothesized to be
due to constraints imposed by the participation of neurons
in more functional interactions than cells in other tissues
[50]. In contrast, gene expression in the kidney was most
dissimilar between species (median expression ratio
Pearson r = 0.21), possibly reflecting evolution of kidney
function (see Discussion). A dendrogram for the ten
common tissues (with the same tissue measured in all five
datasets; Additional data file 3) shows clear segregation of
the data for heart/muscle, eye, central nervous system
(CNS), spleen, liver and stomach/intestine. Only the testis
and kidney datasets are split, each into two groups, with
pufferfish and/or frog forming the outlying group.
Additional data file 4 shows that, among these 3,074 genes,
the Gene Ontology (GO) processes enriched in tissues are
also generally conserved across the five species. We
conclude that programs of tissue-specific expression are
broadly conserved among vertebrates.
TThhoouussaannddss ooff iinnddiivviidduuaall ttiissssuuee ssppeecciiffiicc ggeennee eexxpprreessssiioonn eevveennttss
aarree ccoonnsseerrvveedd aaccrroossss aallll vveerrtteebbrraattee c
cllaaddeess
We next sought to quantify the conservation of expression
of individual genes. We used two conceptually simple
measures intended to capture different aspects of conser-
vation of expression. The first asks how often specific gene
expression events (instances in which gene X is expressed in
tissue Y) are conserved across all vertebrates. We refer to this
as the ‘binary measure’ because, to simplify statistical
analysis, we considered a fixed proportion of the normal-
ized, ranked microarray intensities of genes in each tissue to
be expressed (‘1’), and analyzed the data using several such
proportions (1/6, 1/5, 1/4, 1/3, 1/2; Additional data file 5
contains the binary matrices). We then asked how often a
gene is expressed in all species in a given tissue (that is, a
fully conserved expression ‘event’). The proportion of
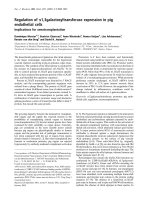
conserved expression events at different thresholds ranges
from 3% to 19.3% of all possible expression events, among
the 3,074 1-1-1-1-1 orthologs (Figure 2a), and the propor-
tion of genes with at least one conservation event ranges
from 11% to 49.5% (Figure 2b), in all cases clearly exceed-
ing permuted (negative control) datasets. On the basis of
the spread between blue and orange bars in Figure 2, about
10% of the 30,740 possible gene expression events are
conserved among all vertebrates, and at least 20% of all
1-1-1-1-1 orthologs participate in at least one such event.
This measure probably underestimates the conservation of
gene expression, because we surveyed only ten tissues and
because we have not considered lack of expression across all
species to represent an example of conserved expression.
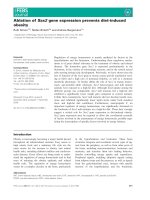
The second measure we used was Pearson correlation across
the ten common tissues. As with the binary measure, we
found that gene expression across tissues between real
1-1-1-1-1 orthologs is more similar than randomly matched
genes in pairwise comparisons between species (Figure 3
shows results for other species versus human; Additional
data file 6 shows all pairwise comparisons, and also the
median of pufferfish versus all other species, to provide a
summary of overall conservation). The difference between
the real and random (permuted) lines in Figure 3 and
Additional data file 6 indicates that roughly 20% of all
1-1-1-1-1 orthologs display conserved expression - a pro-
portion comparable to that obtained using the binary
measure. In fact, at r = 0.4, the apparent false discovery rate
is similar to that obtained with the 1/3 cutoff using the
binary measure (27.4% versus 34.5%), as is the number of
genes classified as having conserved expression (843 versus
1,062). The overlap between these two sets of genes is
/>Journal of Biology
2009, Volume 8, Article 33 Chan
et al.
33.3
Journal of Biology
2009,
88::
33
higher than expected at random (417 versus 291 at
random); however, it is far from absolute, indicating that
the definition of conserved expression influences conclu-
sions regarding conservation of expression.
33.4
Journal of Biology
2009, Volume 8, Article 33 Chan
et al.
/>Journal of Biology
2009,
88::
33
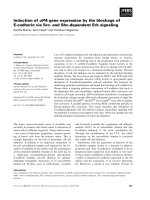
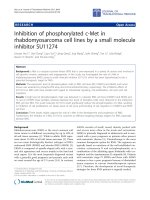
FFiigguurree 11
Comparison of tissue expression profiles among five diverse vertebrates. Clustered heat map of the all-versus-all Pearson correlation matrix
between 20 tissues in each of human (H), mouse (M), chicken (C), frog (F) and pufferfish (P) over all 3,074 1-1-1-1-1 orthologs. Analogous and
functionally related tissues are boxed in white, demonstrating the cross-species similarity of those tissues on the basis of their gene expression
profiles.
Kidney
Liver
Digestive tissues
Lung & uterus
Immune tissues
Reproductive tissues
Neural tissues
Muscle & skin tissues
Pearson correlation coefficient
H-Adrenal gland
H-Kidney
M-Kidney
C-Kidney
H-Liver
M-Liver
C-Liver
F-Gallbladder
F-Liver
P-Liver
H-Pancreas
H-Stomach
M-Large intestine
M-Small intestine
M-Stomach
C-Gallbladder
P-Gallbladder
C-Intestine
P-Intestine
P-Stomach
F-Smallintestine
F-Largeintestine
F-Stomach
C-Oviduct
C-Stomach
M-Mammary gland
H-Lung
M-Lung
F-Lung
H-Uterus
M-Uterus
M-Ovary
H-Placenta
P-Fin
P-Gill
C-Lung
H-Thyroid
H-Bone marrow
M-Bone Marrow
H-Thymus
M-Thymus
M-Spleen
C-BursaofFabricus
C-Thymus
C-Femur
C-Spleen
H-Small Intestine
H-Spleen
F-Spleen
P-Spleen
P-Kidney
M-Calvaria
F-Cartilage
F-Femur
H-Testis
M-Testis
C-Testis
F-Testis
F-Fatbody
F-Kidney
F-Ovary
P-Ovary
P-Testis
P-Swimbladder
F-Oviduct
C-Ovary
H-Brain
H-Brain - cerebral cortex
H-Brain - cerebellum
M-Cerebellum
M-Cortex
C-Cerebellum
C-Cerebralcortex
F-Brain
P-Brain
H-Retina
M-Eye
C-Eye
F-Eye
P-Eye
H-Heart
M-Heart
H-Skeletal Muscle
M-Skeletal Muscle
C-Muscle
F-Muscle
P-Redmuscle
P-Whitemuscle
C-Heart
F-Heart
P-Heart
P-Beak
P-Calvaria
P-Skin
P-Connectivetissue
M-Skin
C-Skin
C-Gizzard
F-Esophagus
F-Skin
0
0.1
0.2
0.3
0.4
>0.5
Regardless of the method of comparison the same essential
conclusion is reached: a major component of tissue gene
expression has apparently remained intact since the
common ancestor of all vertebrates. A large fraction of genes
is encompassed; between the two measures (the binary
measure and the Pearson measure), 48.4% of all 1-1-1-1-1
orthologs (1,488/3,074) scored as having conserved expres-
ion at about 30% apparent false discovery rate. Thus, in just
the ten common tissues we analyzed, gene expression is at
least partially conserved for at least a third of all unique
orthologs (48.4% x 0.7 = 33.9%) by at least one of our two
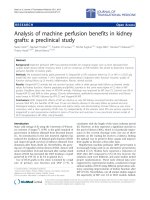
definitions of conservation. The expression of these 1,488
genes in modern-day lineages is shown in Figure 4. Most of
these genes have tissue-specific patterns of expression,
indicating that the genes we are identifying are not simply
ubiquitously expressed housekeeping genes.
Although the focus of our study was to identify conserved
gene expression patterns, our data are consistent with
previous findings that divergence of gene expression scales
with evolutionary time [17,18] when averaged over all
genes (Figure 5a) or all tissues (Figure 5b; the same trend is
apparent in Figure 4 and Additional data file 3). Individual
tissue expression profiles show different evolutionary trajec-
tories, however (Figure 5c), presumably reflecting diversity
in constraints on tissue function.
/>Journal of Biology
2009, Volume 8, Article 33 Chan
et al.
33.5
Journal of Biology
2009,
88::
33
FFiigguurree 22
Conservation of gene expression using the binary measure.
((aa))
Proportion of conservation events out of total possible conservation events at
different thresholds using the binary model.
((bb))
Proportion of genes with at least one conservation event among the ten common tissues out of all
3,074 measured genes using the binary model. See Results and Materials and methods for details.
Proportion of genes considered expressed in each tissue
Top 1/2
T
op 1/3
Top 1/4
Top 1/5
T
op 1/6
Proportion of fully conserved expression events
(out of total possible events)
(b)(a)
0
0.1
0.2
0.3
0.4
0.5
0
0.05
0.1
0.15
0.2
randomly− matched genes
real orthologs
Top 1/2
Top 1/3
Top 1/4
Top 1/5
Top 1/6
Proportion of genes with at least one
fully conserved expression event
(out of 3,074 1-1-1-1-1 orthologs)
Proportion of genes considered expressed in each tissue
FFiigguurree 33
Cumulative distributions comparing the pairwise conservation of gene
expression of each species versus human using the Pearson correlation
measure. Data shown use median-subtracted asinh values (comparable to
ratios). The dotted lines are negative controls derived using permuted data.
C, chicken; F, frog; H, human; M, mouse; P, pufferfish.
−0.8 −0.6 −0.4 −0.2 0 0.2 0.4 0.6 0.8 1.0
0
0.1
0.2
0.3
0.4
0.5
0.6
0.7
0.8
0.9
1.0
Pairwise Pearson correlation of expression ratios between human and other species
Cumulative distribution
H vs M
Random H vs M
H vs C
Random H vs C
H vs F
Random H vs F
H vs P
Random H vs P
33.6
Journal of Biology
2009, Volume 8, Article 33 Chan
et al.
/>Journal of Biology
2009,
88::
33
FFiigguurree 44
A core conserved vertebrate tissue transcriptome. Expression ratios of the measured and predicted expression patterns of 1,488 1-1-1-1-1
orthologs as described in the text and Materials and methods are shown. Two-dimensional hierarchical agglomerative clustering using a distance
metric of 1 - Pearson correlation followed by clustering and diagonalization [44] was applied to the expression ratios of each ortholog in each tissue
over all five datasets.
Relative expression ratio
2
>10
5
0
Human Mouse Chicken Frog Pufferfish
1,488 genes with conserved expression
CNS
Eye
Heart
Muscle
Intestine
Stomach
Kidney
Liver
Spleen
Testis
CNS
Eye
Heart
Muscle
Intestine
Stomach
Kidney
Liver
Spleen
Testis
CNS
Eye
Heart
Muscle
Intestine
Stomach
Kidney
Liver
Spleen
Testis
CNS
Eye
Heart
Muscle
Intestine
Stomach
Kidney
Liver
Spleen
Testis
CNS
Eye
Heart
Muscle
Intestine
Stomach
Kidney
Liver
Spleen
Testis
CCoonnsseerrvvaattiioonn ooff eexxpprreessssiioonn ddooeess nnoott ccoorrrreellaattee wwiitthh
pprrooppoorrttiioonn oorr aammoouunntt ooff ccoonnsseerrvveedd nnoonneexxoonniicc sseeqquue
ennccee
We next asked what gene properties correlate with conser-
vation of expression among the 3,074 measured unique
orthologs. We considered the following gene properties:
those that are contained in our data, that is, median
expression level and Shannon entropy as a measure of tissue
specificity and preferential expression in individual tissues;
GO annotations; and sequence properties, that is, length of
gene, size of encoded protein, presence of a DNA-binding
domain (for known and predicted TFs), sequence conser-
vation of encoded protein (pairwise BLASTP bit score) and
/>Journal of Biology
2009, Volume 8, Article 33 Chan
et al.
33.7
Journal of Biology
2009,
88::
33
FFiigguurree 55
Comparison of gene expression conservation to evolutionary distance. The scatter plots show expression distance as 1 - Pearson correlation, using
median-subtracted asinh values (comparable to ratios).
((aa))
Median pairwise correlation over all genes; each point represents a pair of species.
((bb))
Median pairwise correlation over all tissues; each point represents a pair of species.
((cc))
Individual pairwise correlations over tissues, as indicated
with colors; each point represents a single tissue in a single pair of species. Estimated species divergence times were obtained from [48].
Species divergence time (million years)
r = 0.74
Species divergence time (million years)
Species divergence time (million years)
r = 0.72
0 100 200 300 400 500
0
0.2
0.4
0.6
0.8
1.0
0 100 200 300 400 500
0
0.2
0.4
0.6
0.8
1.0
0 100 200 300 400 500
0
0.2
0.4
0.6
0.8
1.0
CNS
Heart
Eye
Kidney
Intestine
Liver
Muscle
Spleen
Stomach
Testis
Expression divergence distance (1 - Pearson r)
Expression divergence distance (1 - Pearson r)
Expression divergence distance (1 - Pearson r)
(a) (b)
(c)
amount of conserved nonexonic sequence (measured in
several ways) (Additional data files 7 and 8; see Materials
and methods for details).
Several observations emerged from this analysis. First, the
genes with the highest expression similarity between species
are most often genes expressed in a highly tissue-specific
manner in tissues with specialized functions. Although the
Pearson correlation is heavily influenced by extreme values,
thus giving higher weight to tissue-specific pairs, most of
these high scoring genes were also classified as conserved by
our binary measure. Among the 50 genes with highest
median pairwise Pearson correlation of expression are
structural components of the eye lens, liver-synthesized
proteins involved in the complement system and blood
coagulation, and neurotransmitter receptors and trans-
porters. This observation is supported by the GO categories
enriched among genes with high expression similarity, such
as synaptic transmission (GO:0007268), visual perception
(GO:0007601), wound healing (GO:0042060) and muscle
development (GO:0007517) (Wilcoxon-Mann-Whitney test
(WMW) p-values 1.55 x 10
-4
, 2.36 x 10
-3
, 2.24 x 10
-3
and
4.98 x 10
-5
, respectively; Additional data file 8). In contrast,
we did not find any evidence that the expression of TFs (228
of the 3,074 measured orthologs) is more or less conserved
than that of non-TFs, in contrast to previous reports of both
higher [38] and lower [40] rates of evolution of TF
expression. A slightly lower proportion of TFs did seem to
show conservation events relative to non-TFs using the
binary measure, but this difference is due to the fact that TFs
are expressed in fewer tissues: the difference is not seen
when comparing TFs and non-TFs with similar overall
expression levels (data not shown).
It is widely believed that conserved nonexonic sequence
often serves a cis-regulatory function, and it follows that a
larger amount of conserved nonexonic sequence might
correlate with a higher probability of conserved expression.
However, we found that the correspondence was very weak:
for example, for the binary model, we obtained Spearman
correlations of -0.086 and 0.0029 with the number of
nonexonic bases in Phastcons conserved regions [28] and in
ultraconserved elements (UCEs) [26], respectively; for the
Pearson model, these correlations were 0.054 and 0.0075,
respectively. Similar results were obtained when proportion
of bases replaced number of bases (Figure 6a,b). The hand-
ful of outlying points in the upper right of Figure 6b includes
several TFs, a subset of which are known to have an
exceptional degree of nonexonic sequence conservation [26].
We reasoned that pervasive shuffling might obscure most of
the cis-regulatory elements, particularly in pufferfish. In
order to address this possibility, we developed a technique
similar to that of Sanges et al. [35] to detect shuffled
conserved sequence elements (SCEs), which may be non-
collinear, across the five species (see Materials and methods
for details). Among the total 4,898 1-1-1-1-1 orthologs, we
identified 491,028, 457,074, 79,001, 54,134 and 11,731
SCEs in human, mouse, chicken, frog and pufferfish with
median lengths of 164, 80, 68, 68 and 65 nucleotides,
respectively. These SCEs showed good overlap with those in
[35] (75.5% of the sequences in [35] within regions we
aligned were identified as SCEs in our analysis) and they
were calibrated to minimize false positives (see Materials
and methods). However, we still did not observe a strong
relationship between the degree of conservation and the
proportion or number of aligned bases in each species
(median Spearman correlation: -0.062 and 0.042 for binary
and Pearson models, respectively, versus proportion of
aligned nonexonic bases in each species; Figure 6c,d; similar
correlations are obtained with number of aligned non-
exonic bases).
We also examined the correlations between nonexonic
sequence conservation and expression correlation at
varying evolutionary distances from human. Although
correlations remain weak (Figure 7a), we did find that
genes in the highest quartile of sequence conservation had
a significantly higher distribution of expression correlation
than those in the lowest quartile, for all pairwise
comparisons except human versus pufferfish (Figure 7b).
However, in all comparisons, there are many genes with
little sequence conservation and high expression corre-
lation, and vice versa. In fact, among the 173 genes with
the most highly conserved expression in our study by both
measures we applied (those in the top 1/6 by the binary
measure and with median Pearson r ≥ 0.5), most (102)
have no nonexonic conserved sequence in fish, on the basis
of our SCEs. The expression of these 102 genes in the ten
common tissues in the representatives of all modern
lineages is shown in Figure 8.
Because TF binding sites are degenerate, it is conceivable
that these genes have a high number of conserved TF
binding sites, despite their lack of primary sequence conser-
vation. To examine this possibility we used Enhancer
Element Locator (EEL) [51] to align TF binding sites defined
by 138 motif models downloaded from the JASPAR data-
base [52]. Over all 4,804 aligned human/pufferfish
ortholog pairs, the number of genes that scored highly using
EEL was only slightly higher with real ortholog pairs than
with randomly assigned orthologs with similar amounts of
nonexonic associated sequence in both genomes (p = 0.24,
Kolmogorov-Smirnov test; see Materials and methods and
33.8
Journal of Biology
2009, Volume 8, Article 33 Chan
et al.
/>Journal of Biology
2009,
88::
33
Additional data file 9) and there is almost no correlation
between EEL score and conservation of expression (EEL
score against median versus pufferfish normalized
intensity Pearson r = 0.022). We conclude that the
regulatory architecture of the vast majority of genes has
diverged beyond recognition by any current approaches,
/>Journal of Biology
2009, Volume 8, Article 33 Chan
et al.
33.9
Journal of Biology
2009,
88::
33
FFiigguurree 66
Relationship between expression similarity between orthologous genes and amount of conserved nonexonic sequence. Proportion of conserved
nonexonic sequence defined as Phastcons elements
((aa,,bb))
and human bases in non-collinear alignment
((cc,,dd))
compared against the conservation of gene
expression by the binary measure (a,c) and Pearson measure (normalized intensities) versus pufferfish (P) (b,d) (see text and Materials and methods
for details). Selected TFs are indicated in (b) (see text). Probable TFs as determined by their Ensembl gene descriptions, but that were not identified
by our domain analyses, are indicated by †. Spearman rho refers to the Spearman correlation coefficient.
Proportion of noncoding bases covered
by Phastcons element bases
Median (vs P) normalized intensities Pearson
correlation across common tissues
Proportion of noncoding bases covered
by Phastcons element bases
(a)
(b)
Binary expression threshold
−1 −0.8 −0.6 −0.4 −0.2 0 0.2 0.4 0.6 0.8 1
0
0.05
0.1
0.15
0.2
0.25
0.3
0.35
Spearman rho = 0.038
(c)
(d)
Proportion of noncoding bases covered by
human bases in non-collinear alignment
Median (vs P) normalized intensities Pearson
correlation across common tissues
Proportion of noncoding bases covered by
human bases in noncollinear alignment
Binary expression threshold
0
0.01
0.02
0.03
0.04
0.05
0.06
0.07
0.08
0.09
Bottom 1/2 Top 1/2
Top 1/3
Top 1/4
Top 1/5 Top 1/6
Top 1/6Top 1/5Top 1/4
Top 1/3
Top 1/2
0
0.1
0.2
0.3
0.4
0.5
0.6
0.7
0.8
Bottom 1/2
−1 −0.8
−0.6 −0.4 −0.2 0
0.2
0.4 0.6
0.8 1
0
0.1
0.2
0.3
0.4
0.5
0.6
0.7
0.8
0.9
Spearman rho = 0.028
ZEB2
PROX1
LMO4
NFIB
ZIC1
TFAP2B
†
†
Lower Higher
Lower
Higher
Lower Higher
Lower Higher
despite the apparently very similar regulatory output in
many cases, and the likelihood that at least some
orthologous TFs are functioning in the same tissues.
DDiissccuussssiioonn
Our data provide a resource of large-scale gene expression
data in tissues of three non-mammalian vertebrates and
33.10
Journal of Biology
2009, Volume 8, Article 33 Chan
et al.
/>Journal of Biology
2009,
88::
33
FFiigguurree 77
Low correlation between conservation of gene expression and amount of conserved nonexonic sequence is largely independent of evolutionary
distance.
((aa))
Scatter plots show the proportion of bases conserved in SCE alignments versus Pearson correlation (ratios) for individual genes.
((bb))
Box
plots show the distribution of Pearson correlations for genes in the top and bottom quartiles of number of conserved bases. Asterisks indicate
significant differences between the top and bottom quartiles.
Top 25% of genes with most
conserved human bases
Bottom 25% of genes with
least conserved human bases
Top 25% of genes with most
conserved mouse bases
Bottom 25% of genes with
least conserved mouse bases
Top 25% of genes with most
conserved chicken bases
Bottom 25% of genes with
least conserved chicken bases
Top 25% of genes with most
conserved frog bases
Bottom 25% of genes with
least conserved frog bases
Top 25% of genes with most
conserved pufferfish bases
Bottom 25% of genes with
least conserved pufferfish bases
1.0
0.8
0.6
0.4
0.2
0
- 0.2
- 0.4
- 0.6
- 0.8
-1.0
Pairwise human vs other species
Pearson correlation
* WMW p < 0.05
*****
*
*
*
(a)
(b)
0 1 1−1 0
0
0.2
0.4
0.6
0.8
Human−mouse Pearson r
Proportion of mouse bases conserved
Spearman:0.10
1−1 0
0
0.1
0.2
0.3
0.4
Human−chicken Pearson r
Proportion of chicken bases conserved
Spearman:0.10
1
−1 0
0
0.05
0.10
0.15
0.20
Human−frog Pearson r
Proportion of frog bases conserved
Spearman:0.065
−1
0
0.2
0.4
0.6
0.8
1.0
Human−mouse Pearson r
Proportion of human bases conserved
Spearman:0.078
−1 0 1
0
0.05
0.10
0.15
0.20
Human−pufferfish Pearson r
Proportion of pufferfish bases conserved
Spearman:0.044
/>Journal of Biology
2009, Volume 8, Article 33 Chan
et al.
33.11
Journal of Biology
2009,
88::
33
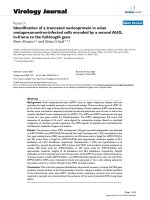
FFiigguurree 88
Expression of 102 genes with highly conserved expression across all vertebrate lineages, but no detectable nonexonic sequence conservation
between pufferfish and frog, chicken, mouse, or human. Mouse and human expression profiles are merged to represent mammals. Gene identifiers
and descriptions for human were downloaded from Ensembl.
ENSG00000074211
ENSG00000198794
ENSG00000130540
ENSG00000165443
ENSG00000139182
ENSG00000107331
ENSG00000166922
ENSG00000135472
ENSG00000108797
ENSG00000107618
ENSG00000112619
ENSG00000125864
ENSG00000132376
ENSG00000128731
ENSG00000130561
ENSG00000112041
ENSG00000162409
ENSG00000129170
ENSG00000168334
ENSG00000134571
ENSG00000010256
ENSG00000139180
ENSG00000150768
ENSG00000164776
ENSG00000185437
ENSG00000151729
ENSG00000166343
ENSG00000072954
ENSG00000140740
ENSG00000105220
ENSG00000151929
ENSG00000115593
ENSG00000124701
ENSG00000131791
ENSG00000091140
ENSG00000184489
ENSG00000163069
ENSG00000084754
ENSG00000114416
ENSG00000178802
ENSG00000115539
ENSG00000143384
ENSG00000184752
ENSG00000028528
ENSG00000100129
ENSG00000107537
ENSG00000146701
ENSG00000127948
ENSG00000158865
ENSG00000141434
ENSG00000145384
ENSG00000104325
ENSG00000067167
ENSG00000116044
ENSG00000116761
ENSG00000129007
ENSG00000145741
ENSG00000151715
ENSG00000140990
ENSG00000143368
ENSG00000084623
ENSG00000143870
ENSG00000064601
ENSG00000111679
ENSG00000140612
ENSG00000142669
ENSG00000170860
ENSG00000158296
ENSG00000198843
ENSG00000120885
ENSG00000182919
ENSG00000100219
ENSG00000084110
ENSG00000155660
ENSG00000123131
ENSG00000109072
ENSG00000180398
ENSG00000117601
ENSG00000171557
ENSG00000159403
ENSG00000171564
ENSG00000138207
ENSG00000151655
ENSG00000144867
ENSG00000130066
ENSG00000139344
ENSG00000157637
ENSG00000124783
ENSG00000163479
ENSG00000120915
ENSG00000166794
ENSG00000143891
ENSG00000112977
ENSG00000162961
ENSG00000106305
ENSG00000198612
ENSG00000182831
ENSG00000100296
ENSG00000151023
ENSG00000163918
ENSG00000114902
ENSG00000136490
Serine/threonine protein phosphatase 2A, 55 kDa regulatory subunit B, gamma isoform
Secretory carrier-associated membrane protein 5 (Secretory carrier membrane protein 5)
Sulfotransferase 4A1 (EC 2.8.2 ) (Brain sulfotransferase-like protein)
Phytanoyl-CoA hydroxylase interacting protein-like
Calsyntenin-3 precursor
ATP-binding cassette sub-family A member 2 (ATP-binding cassette transporter 2)
Neuroendocrine protein 7B2 precursor (Secretory granule endocrine protein I)
Fas apoptotic inhibitory molecule 2 (Lifeguard protein)
Contactin-associated protein 1 precursor (Caspr)
Interphotoreceptor retinoid-binding protein precursor (IRBP)
Peripherin (Retinal degeneration slow protein)
Filensin (Beaded filament structural protein 1)
Skeletal muscle and kidney-enriched inositol phosphatase (EC 3.1.3.56)
Hect domain and RLD 2
S-arrestin (Retinal S-antigen)
Tubby related protein 1 (Tubby-like protein 1)
5'-AMP-activated protein kinase, catalytic alpha-2 chain (EC 2.7.1 )
Cysteine and glycine-rich protein 3 (Cysteine-rich protein 3)
Cardiomyopathy associated 1
Myosin-binding protein C, cardiac-type (Cardiac MyBP-C)
Ubiquinol-cytochrome-c reductase complex core protein I, mitochondrial precursor (EC 1.10.2.2)
NADH-ubiquinone oxidoreductase 39 kDa subunit, mitochondrial precursor (EC 1.6.5.3) (EC 1.6.99.3)
Pyruvate dehydrogenase complex E2 subunit (PDCE2) , mitochondrial precursor (EC 2.3.1.12)
Phosphorylase b kinase gamma catalytic chain, skeletal muscle isoform (EC 2.7.1.38)
SH3 domain-binding glutamic acid-rich protein (SH3BGR protein)
ADP/ATP translocase 1 (Adenine nucleotide translocator 1) (ANT 1)
Zinc finger MYND domain-containing protein 17
Transmembrane protein 38A
Ubiquinol-cytochrome-c reductase complex core protein 2, mitochondrial precursor (EC 1.10.2.2)
Glucose-6-phosphate isomerase (EC 5.3.1.9) (GPI)
BAG family molecular chaperone regulator 3 (BCL-2 binding athanogene- 3)
SET and MYND domain containing protein 1
Probable C->U editing enzyme APOBEC-2 (EC 3.5.4 )
5'-AMP-activated protein kinase, beta-2 subunit (AMPK beta-2 chain)
Dihydrolipoyl dehydrogenase, mitochondrial precursor (EC 1.8.1.4)
Protein tyrosine phosphatase type IVA protein 3 (EC 3.1.3.48)
Beta-sarcoglycan (Beta-SG) (43 kDa dystrophin-associated glycoprotein)
Trifunctional enzyme alpha subunit, mitochondrial precursor (TP-alpha)
Fragile X mental retardation syndrome-related protein 1
Mannose-6-phosphate isomerase (EC 5.3.1.8) (Phosphomannose isomerase)
Phosducin-like protein 3 (Viral IAP-associated factor 1) (VIAF-1)
Induced myeloid leukemia cell differentiation protein Mcl-1 (Bcl-2- related protein EAT/mcl1)
NADH-ubiquinone oxidoreductase subunit B17.2 (EC 1.6.5.3) (EC 1.6.99.3)
Sorting nexin-1
Eukaryotic translation initiation factor 3 subunit 6 interacting protein
Phytanoyl-CoA dioxygenase, peroxisomal precursor (EC 1.14.11.18)
Malate dehydrogenase, mitochondrial precursor (EC 1.1.1.37)
NADPH cytochrome P450 reductase (EC 1.6.2.4)
solute carrier family 5 (sodium/glucose cotransporter), member 11
Meprin A beta-subunit precursor (EC 3.4.24.18)
Fatty acid-binding protein, intestinal (I-FABP)
2,4-dienoyl-CoA reductase, mitochondrial precursor (EC 1.3.1.34)
Translocation associated membrane protein 1
Nuclear factor erythroid 2 related factor 2 (NF-E2 related factor 2)
Cystathionine gamma-lyase (EC 4.4.1.1)
Calmodulin-like 4 isoform 2
Transcription factor BTF3 (RNA polymerase B transcription factor 3)
Transmembrane protein 45B
NADH-ubiquinone oxidoreductase PDSW subunit (EC 1.6.5.3) (EC 1.6.99.3)
Splicing factor 3B subunit 4 (Spliceosome associated protein 49)
Eukaryotic translation initiation factor 3 subunit 2 (eIF-3 beta)
Protein disulfide-isomerase A6 precursor (EC 5.3.4.1)
Lysosomal protective protein precursor (EC 3.4.16.5)
Tyrosine-protein phosphatase non-receptor type 6 (EC 3.1.3.48)
Microsomal signal peptidase 18 kDa subunit (EC 3.4 )
SH3 domain-binding glutamic acid-rich-like protein 3 (SH3 domain- binding protein 1)
U6 snRNA-associated Sm-like protein LSm3
Solute carrier family 13 member 3 (Sodium-dependent high-affinity dicarboxylate transporter 2)
Selenoprotein T precursor
Clusterin precursor (Complement-associated protein SP-40,40)
Ester hydrolase C11orf54
X box binding protein 1 (XBP-1)
Histidine ammonia-lyase (EC 4.3.1.3)
Protein disulfide-isomerase A4 precursor (EC 5.3.4.1)
Peroxiredoxin 4 (EC 1.11.1.15) (Prx-IV )
Vitronectin precursor (Serum spreading factor)
Multiple coagulation factor deficiency protein 2 precursor (Neural stem cell derived neuronal survival protein)
Antithrombin-III precursor (ATIII)
Fibrinogen gamma chain precursor
Uncharacterized protein
Fibrinogen beta chain precursor
Plasma retinol-binding protein precursor (PRBP)
Inter-alpha-trypsin inhibitor heavy chain H2 precursor (ITI heavy chain H2)
Signal recognition particle receptor beta subunit (SR-beta)
Diamine acetyltransferase 1 (EC 2.3.1.57)
Probable imidazolonepropionase
Putative sodium-coupled neutral amino acid transporter 10
Translocon-associated protein alpha subunit precursor (TRAP-alpha)
Translocon-associated protein beta subunit precursor ( TRAP-beta)
Epoxide hydrolase 2 (EC 3.3.2.3) (Soluble epoxide hydrolase)
Peptidyl-prolyl cis-trans isomerase B precursor (EC 5.2.1.8)
Aldose 1-epimerase (EC 5.1.3.3) (Galactose mutarotase)
Death-associated protein 1 (DAP-1)
Dpy-30-like protein
Multisynthetase complex auxiliary component p38 (JTV-1 protein)
COP9 signalosome complex subunit 8 (Signalosome subunit 8)
UPF0472 protein C16orf72
Protein C22orf19 (NF2/meningioma region protein pK1.3)
Enkurin
Activator 1 37 kDa subunit (Replication factor C 37 kDa subunit)
Signal peptidase complex subunit 1 (EC 3.4 )
LIM domain-containing protein 2
CNS
Eye
Heart
Muscle
In
testine
Stomac
h
Kidney
Li
ver
T
estis
Spleen
CNS
Eye
Heart
Muscle
Intestine
S
t
omach
Kidney
Liver
Testis
Spleen
CNS
Eye
Hear
t
Muscle
Intestine
S
t
omach
Kidney
Li
v
er
Testis
Spleen
CNS
Ey
e
Heart
Muscle
In
testine
Stomach
Kidney
Li
ver
Testis
Spleen
Human/
Mouse
Chicken Frog
>10
5
0
1
2
Relative
expression
ratio
demonstrate that there is conservation of core vertebrate
tissue gene expression. Our analysis almost certainly under-
estimates the proportion of genes with conserved expression
patterns, because our analysis focused on only ten large
adult tissues in mature animals in captivity. Nonetheless,
our results already provide an index of several thousand
highly conserved tissue gene expression events and a picture
of core gene expression in major tissues and organs of the
common progenitor of all vertebrates, which most likely
resembled the expression patterns shown in Figure 4.
In our analysis, some biological processes emerged as more
highly conserved than others. Genes involved in the more
conserved processes on the whole tend to be preferentially
expressed in tissues with a limited number of cell types
(brain, eye, liver, heart and muscle) that carry out special-
ized functions particular to those tissues. This finding is
consistent with the notion that mechanisms underlying
important biological processes should be conserved across
taxa [53]. It is likely that the conservation of gene
expression in these tissues extends beyond the base of verte-
brates; coexpression of neuronal genes, for example, is
observed as far as nematodes [54]. Genes expressed in
tissues subject to greater environmental influence (such as
intestine, stomach and spleen) may be more likely to take
on new roles and diverge in expression as means of
adaptation. We find gene expression similarity in the testis
across vertebrates to be relatively low compared with other
tissues, in support of earlier observations of accelerated
evolution of testis gene expression in Drosophila [55] and
primates [49], and consistent with mating competition and
speciation. We also note that relatively low conservation of
gene expression in the kidney is consistent with its divergent
function; in teleosts, the kidney is a major lymphoid organ
[56].
Our finding that the correlation between the amount of
conserved nonexonic sequence and conservation of gene
expression is low underscores the apparent malleability of
the cis-regulatory ‘lexicon’ [32,35,57]. It is easy to rationa-
lize cases in which there is conserved sequence but little or
no conservation of expression in our study, because it is
possible that the majority of conserved sequence identified
is either not cis-regulatory, is functioning as cis-regulatory in
a context that we have not measured and/or regulates neigh-
boring genes. What is most striking is that many genes with
the highest conserved tissue-specific expression have almost
no nonexonic conserved sequence outside mammals.
Divergence in trans-regulatory architecture does not provide
a satisfying explanation for this observation: although there
are examples in which the binding specificity of TFs evolves
[58,59], as a general rule the individual monomeric TF
sequence specificities seem to be unchanged over large
evolutionary distances [60], and DNA-contacting residues
are often the most conserved [61]. The fact that conserva-
tion of TF expression is comparable to that of other genes
with similar levels of tissue specificity also supports the
notion that many ancestral vertebrate regulatory mecha-
nisms are still in use. Moreover, enhancers can be func-
tional across large evolutionary distances (for example,
human reporters in zebrafish), even when the enhancers are
not conserved, or are below the threshold of detection by
current alignment techniques [42].
Understanding the mechanisms underlying conservation of
expression patterns is a major challenge in our under-
standing of evolution, and of genome function and gene
regulation: even within a single genome, it is difficult to
find cis-regulatory modules shared by coexpressed genes,
indicating that there are many ways to achieve the same
expression output. We propose that our catalog of con-
served (and non-conserved) expression will be useful to test
ideas regarding enhancer definition. In particular, we predict
that the small size of pufferfish genes and knowledge of the
expression of TFs in each tissue may facilitate searches for
enhancers on the basis of density and arrangement of TF
binding sites, rather than primary sequence alignment
[34,62]. These and other techniques require experimental
data for training and testing, and we now provide such data
for tens of thousands of genes across the vertebrate lineage,
including several thousand unique orthologs.
MMaatteerriiaallss aanndd mmeetthhooddss
DDaattaa aavvaaiillaabbiilliittyy
Data tables including microarray data, probe sequences, the
1-1-1-1-1 ortholog list, Phastcons information, UCE infor-
mation, GO annotations and novel non-collinear align-
ments are found in the Additional data files and also on our
project website [63].
TTiissssuuee ssoouurrcceess
Five chickens (three young females, one in-lay adult female
and one rooster) were obtained from Sunnybrook Health
Sciences Centre, Toronto, Canada. The bursa of Fabricius
and thymus were dissected from the young females. The
oviduct and ovaries were dissected from the in-lay adult
female and the testis dissected from the rooster. Approxi-
mately 75 adult female and five adult male frogs were
obtained from Nasco (Atkinson, USA), housed in 20 L
aquariums at 20°C and fed a diet of Aquamax Grower 600
trout food (Purina Mills, Gray Summit, USA). Exactly 100
green spotted pufferfish, of unknown age and sex, described
as caught wild in Malaysia, were purchased from Aquarium
33.12
Journal of Biology
2009, Volume 8, Article 33 Chan
et al.
/>Journal of Biology
2009,
88::
33
Services Warehouse Outlets (Thornhill, Canada) and
housed in a single 120 gallon (453 L) aquarium tank at
room temperature. Their markings, size (about 6-7 cm) and
behavior matched descriptions of Tetraodon nigroviridis. The
fish were fed frozen brine shrimp twice a day.
TTiissssuuee ccoolllleeccttiioonn aanndd mmRRNNAA iissoollaattiioonn
Animal handling and euthanization procedures were per-
formed according to protocols approved by the University of
Toronto. Tissue processing and mRNA extraction were as
described previously [44]. Tissues collected are listed in
Additional file 1. All fish and frogs were anaesthetized by
adding 35 ml of a 1:10 clove oil (Rougier Pharma, Mirabel,
Canada):ethanol mixture to 1.5 L tank water containing a
single animal. Following cessation of movement (15-20 s),
they were euthanized by decapitation. Chickens were
euthanized by barbiturate injection followed by decapitation.
MMiiccrrooaarrrraayy ddeessiiggnn,, pprroocceessssiinngg aanndd ddaattaa ccoolllleeccttiioonn
Oligonucleotide microarrays (60-mer) were custom-
designed by us and manufactured by Agilent Technologies
to survey the expression of a set of known and predicted
mRNAs compiled from Ensembl [64] version 37 and JGI
(for X. tropicalis, v3.0) corresponding to 24,877, 25,594 and
25,937 known and predicted loci in Tetraodon, chicken and
X. tropicalis, respectively, using 41,533, 41,534 and 41,523
probes. cDNA synthesis, labeling reactions and microarray
processing procedures were performed as described
previously [44]. Each tissue was assayed in duplicate, in
fluor-reversed pairs with biological replicates and averaged
(average Pearson correlation between replicate arrays =
0.89). Using a previously described procedure to define
expression [44], 72%, 77% and 89% of genes on the arrays
were detected in at least one of the tissues profiled in
chicken, frog and pufferfish, respectively, with 40%, 33%
and 52% of genes detected in each tissue, on average
(Additional data file 10), comparable to previously reported
figures of 52% and 59% in human and mouse [44,65]. Our
percentages may be lower because many predicted genes
were included on the arrays. Microarray-based expression
data for 55 mouse tissues [44] and 60 human tissues [43]
were downloaded and mapped to Ensembl v37 identifiers
by aligning probe sequences to Ensembl transcript
sequences using BLAT [66]. Expression similarity was
calculated using the relative expression levels or ‘ratios’
(median-subtracted, variance stabilization-normalized asinh
intensities) as well as using the absolute values (normal-
ized intensities) in each tissue, as indicated in the Results
and figures. All new microarray data have been uploaded to
the Gene Expression Omnibus (GEO) database,
accession numbers [GEO:GSE12974, GEO:GSE12975,
GEO:GSE12976], and are also found on our project website
[63].
DDeetteerrmmiinnaattiioonn ooff ggeennee oorrtthhoollooggyy
rreellaattiioonnsshhiippss
Inparanoid [67] was used to analyze each possible pairwise
all-versus-all protein BLAST [68] comparison between all
known proteins for each of the five vertebrate species in
version 37 of the Ensembl database to delineate pairwise
gene orthology relationships. These relationships were then
assembled into unique 1-1-1-1-1 ortholog groups across the
five species using custom Perl scripts in an approach
analogous to that of Alexeyenko et al. [69].
GGeennee OOnnttoollooggyy aannaallyyssiiss
GO annotations were downloaded from Ensembl BioMart
[70] for each species. Annotations for chicken, frog and
pufferfish (Tetraodon) were further supplemented by
mapping the corresponding mouse annotations by any type
of orthology as defined by Ensembl. Annotations were up-
propagated and terms with few or too many annotated
genes were removed as described previously [44]. All GO
WMW analyses performed across the set of unique ortho-
logs were done with human annotations.
DDeeffiinniittiioonn ooff eexxpprreessssiioonn ccoonnsseerrvvaattiioonn eevveennttss iinn eeaacchh ggeennee
aanndd ttiissssuuee uussiinngg tthhee bbiinnaarryy mmeeaassuurree
We split each set of orthologs in each tissue in each species
on the basis of their measured normalized expression
intensities according to the following thresholds: top 1/2,
top 1/3, top 1/4, top 1/5 and top 1/6. Because the human
and mouse datasets were designed independently from
those of the other three species, there were orthologous
genes with missing measurements. In order to facilitate
comparison between as many unique orthologs between
the five species as possible, we applied variance stabilizing
normalization [71] to the human and mouse orthologs in
order to make them comparable, under the assumption that
gene expression is mostly conserved between the mammals
relative to the rest of the vertebrate phylogeny. We com-
bined the human and mouse ortholog data by averaging to
obtain a set of 3,074 unique orthologs with measured
microarray data across ten common tissues.
CCaallccuullaattiinngg SShhaannnnoonn eennttrrooppyy aass aa mmeeaassuurree ooff ttiissssuuee
ssppeecciiffiicciittyy
Shannon entropy, which measures the degree of overall
tissue specificity of a gene, was calculated as described by
Schug et al. [72]. Briefly, the relative expression of a gene
g in a tissue t relative to its expression given in N tissues
is defined as p
t|g
= w
g,t
/Σ
1 ≤ t ≤ N
w
g,t
, where w
g,t
is the expres-
/>Journal of Biology
2009, Volume 8, Article 33 Chan
et al.
33.13
Journal of Biology
2009,
88::
33
sion level of the gene g in tissue t. The Shannon entropy of a
gene’s expression distribution is then calculated as
H
g
= Σ
1 ≤ t ≤ N
-p
t|g
log
2
p
t|g
. This value is expressed in bits and
ranges from zero to log
2
(10) genes expressed in a single
tissue and uniformly expressed in all the common tissues
examined, respectively.
DDeeffiinniittiioonn ooff oovveerrllaapp bbeettwweeeenn nnoonneexxoonniicc rreeggiioonnss aassssoocciiaatteedd
wwiitthh hhuummaann 11 11 11 11 11 oorrtthhoollooggss aanndd PPhhaassttc
coonnss eelleemmeennttss
aanndd UUCCEEss
Locations of Phastcons elements [28] and UCEs [26] were
downloaded from the hg17 version of the UCSC genome
browser [73] and from the supplementary website [74] of
Bejerano et al. [26]. The number of Phastcons elements and
UCEs (and the number of bases) that overlapped all
nonexonic sequences, including intergenic sequences, up to
50 kb upstream and downstream of each human 1-1-1-1-1
ortholog was tabulated using custom Perl scripts. The
proportion of Phastcons and UCE bases covered in non-
coding regions was calculated as the number of bases out of
50 kb of flanking bases upstream and downstream of each
gene with coding regions masked out.
DDeeffiinniittiioonn aanndd ccaallccuullaattiioonn ooff ootthheerr ggeennee ffeeaattuurreess aanndd
ssttaattiissttiiccaall ccoommppaarriissoonnss ttoo eexxpprreessssiioonn ccoonnsseerrvva
attiioonn
A measure of protein sequence conservation between two
species was derived by performing pairwise BLASTP [68]
between the protein-coding sequences (downloaded from
Ensembl EnsMart [70]) of an orthologous gene pair and
retaining the bit score. The median bit score was taken as a
measure of protein sequence conservation over all species.
Average and maximum expression level and the expression
rank within tissues were calculated in the expected manner
for each gene across the ten common tissues. The number of
bases in an aligned conserved element (aligned as described
below) was obtained by summing the number of bases in
each species within a five-way gapped alignment between
all species. The total number of aligned bases in an aligned
conserved element is the sum of counts in each species. TF
genes within the set of unique orthologs were defined by
the presence of a DNA-binding domain in the mouse
protein sequence in the Pfam database [75]. Our list of TF
genes is given in Additional data file 11. Conservation of
expression was measured by either our binary or Pearson
measures, both of which yield a real value (an integer
between zero and six in the case of the binary method).
With the exception of GO annotations and TF identities, all
measures for each gene are compiled in Additional data
file 7; TFs are listed separately in Additional data file 11.
Comparisons of properties with real values were made by
Spearman p-value, and these are also given in Additional
data file 7 and shown graphically in Additional data file 12.
Comparisons of categorical properties were made by WMW
p-value and are given in Additional data file 8.
MMuullttiippllee sseeqquueennccee aalliiggnnmmeenntt aallggoorriitthhmm
All repeat-masked intronic, 3’ untranslated region and inter-
genic non-coding sequence upstream and downstream of
protein-coding sequences in orthologous groups that we
have identified using the Inparanoid algorithm [47] were
downloaded from Ensembl v37 [64]. Using LAGAN [76],
we built a multiple global alignment across all of the
genomic sequences within each set of unique orthologs to
identify conserved non-coding elements in all species. We
used up to 50 kb of upstream and downstream sequence,
up to the point that the transcript of another annotated
gene was encountered.
We initially applied a conservation cutoff of 55% in a 50
nucleotide window to search for conserved regions between
the human and the orthologous genomes. After removing
conserved elements that were annotated as exonic, we
extracted each sequence element in the alignment that was
conserved only in a subset of the genomes and built the
most parsimonious ancestral reconstruction of each of the
sequences using Fitch’s algorithm, treating the gap character
as a fifth symbol. This was then used to search against the
other orthologous genome(s) using the CHAOS aligner [77]
with very sensitive parameters. The Smith-Waterman
threshold was varied between 40 and 60 (60 is the default
conservation setting for the BLASTZ [78] alignment
program; this setting is both relatively sensitive and very
specific, and thus almost all hits above this threshold will
be real). This homology filtering step was used to identify
non-collinear conserved sequences that may have changed
position and orientation relative to exons over evolutionary
time. In contrast to the method used by Sanges et al. [35],
we tried using both the mouse and the chicken sequence as
the homology filter. By using the chicken as the base
organism we were able to significantly lower the false
positive rate (only one decoy (i.e. permuted gene identity)
sequence with a score above 45), while our true positive rate
was unchanged (all of the human/frog and
human/pufferfish conserved regions recovered with mouse
as the base were also recovered with pufferfish (Tetraodon)
as the base).
Through the procedure described above, our approach takes
advantage of the conservation of order of the conserved
elements when no rearrangements have taken place, and the
33.14
Journal of Biology
2009, Volume 8, Article 33 Chan
et al.
/>Journal of Biology
2009,
88::
33
flexibility of aligning less conserved regions that have been
shuffled around in the genome. By running Fitch’s algo-
rithm on the aligned sequences (unlike the Sanges et al. [35]
approach of simply using the mouse sequence as input to
CHAOS) we increased the sensitivity of our alignment
technique. In particular, it was easier to align Tetraodon
sequence to the common ancestor of human and chicken
genomes than to either genome individually.
EEnnhhaanncceerr EElleemmeenntt LLooccaattoorr
We scanned the nonexonic sequence associated (as defined
for the multiple sequence alignment algorithm) with 4,804
human/fish ortholog pairs for conserved TF binding sites by
applying EEL [51] using the default parameters to perform a
local pairwise TF binding site alignment. We did not
attempt to align the 94 (of 4,898) ortholog pairs for which
one of the orthologs appears in the intron of another gene.
The motif models input into EEL were the 138 models
returned by JASPAR webserver [52] on 27 February 2009.
The score of only the best alignment from each orthologous
gene group was captured and was used to construct a
distribution of 4,804 gene group alignment scores. We also
constructed a shuffled (negative control) distribution of EEL
scores by attempting to align the TF binding sites between
the human non-coding sequences in each of the ortholog
pairs and those of six non-orthologous Tetraodon genes.
These genes were selected among the other 4,803 non-
orthologous paired Tetraodon genes to be the six with the
most similar amount of non-coding sequence as the proper
ortholog, under the constraint that three of the genes had to
have less non-coding sequence and three had to have more
non-coding sequence. As evidence that the EEL analysis is
detecting some very limited degree of conservation, we note
that the distribution of EEL scores is slightly higher in real
than in randomly assigned orthologs starting around an EEL
score of 175; in particular, we estimate that 1.3% (63 of
4,084) of all EEL scores are non-random by subtracting the
proportion of random scores above 175 (39.8%) from the
proportion of real scores above 175 (41.1%).
AAddddiittiioonnaall ddaattaa ffiilleess
The following additional data files are available. Additional
data file 1: Tissues analyzed in this study. The tissues at the
top, highlighted in color, are those considered to be among
the ten common tissue types. Those with identical coloring
were combined (by averaging normalized intensities) for
the analysis of conservation of gene expression among the
ten common tissues. Additional data file 2: Microarray gene
expression data obtained in this study. Clustergrams show
the microarray datasets in chicken, frog and pufferfish,
displayed as relative expression ratio (see Materials and
methods) of each gene within each of the 20 tissues
profiled. Rows and columns were ordered independently
for each dataset, and high-level branches broken and
rearranged to obtain a diagonal appearance as described in
[44]. Additional data file 3: Dendrogram of correlations
among ten common tissues, using 1 - Pearson correlation
and average linkage over 3,074 genes. Additional data file 4:
Gene Ontology categories that tend to be expressed highly
in each of the ten common tissues. Selected GO biological
process categories enriched amongst genes highly expressed
within each of the ten common tissues in each species are
shown. The tissue and GO category order were manually
arranged in the heat map. (A full matrix of WMW scores is
given in Additional data file 13.) Additional data file 5:
Binary matrix of genes classified as having fully conserved
expression events, based on ranked microarray spot
intensity, at five different thresholds (1/6, 1/5, 1/4, 1/3,
1/2). Additional data file 6: Cumulative distributions
summarizing pairwise comparisons of conservation of gene
expression using the Pearson correlation measure. The
cumulative distributions show the proportion of all 3,074
genes with Pearson r (normalized intensities) below the
value shown on the horizontal axis, for real orthologs
(green) and randomly matched genes (blue). Additional
data file 7: Feature matrix used to compare conservation of
expression measures to other attributes of individual genes,
with Spearman correlations and p-values. Additional data
file 8: WMW p-values for categorical gene attributes, with
ranks determined by relative conservation of gene
expression by median Pearson correlation for each species
against Tetraodon. Additional data file 9: Cumulative
distribution of EEL scores for real and permuted orthology
between human and pufferfish. Additional data file 10:
Breakdown of the proportion of all genes in each species
that are expressed within each tissue. Additional data file
11: List of genes classified as TFs on the basis of containing
a known DNA binding domain. Additional data file 12:
Clustergrams showing Spearman correlations and p-values
for comparisons of gene expression conservation versus
other gene properties. Additional data file 13: WMW
enrichment p-values of genes associated with GO biological
process annotations expressed within each tissue of each
species (full matrix used to create Additional data file 4).
AAcckknnoowwlleeddggeemmeennttss
We thank Rick Winterbottom, Norm White, Lloyd Berger, Usha Bhar-
gava and Michael Rennie for their assistance with the animal husbandry
and dissections and Peter Roy, Martha Bulyk and Anthony Phillipakis for
helpful conversations. This work was supported by grants from the
Howard Hughes Medical Institute, the Canadian Foundation for Innova-
tion, and the Ontario Research Fund to TRH, NSERC Discovery grants
to QDM and MB, an NCIC grant to AW, and NIH grant R01-GM1080
to MB.
/>Journal of Biology
2009, Volume 8, Article 33 Chan
et al.
33.15
Journal of Biology
2009,
88::
33
RReeffeerreenncceess
1. International Chicken Genome Sequencing Consortium:
SSeeqquueennccee
aanndd ccoommppaarraattiivvee aannaallyyssiiss ooff tthhee cchhiicckkeenn ggeennoommee pprroovviiddee uunniiqquuee
ppeerrssppeeccttiivveess oonn vveerrtteebbrraattee e
evvoolluuttiioonn
Nature
2004,
443322::
695-716.
2. International Human Genome Sequencing Consortium:
FFiinniisshhiinngg
tthhee eeuucchhrroommaattiicc sseeqquueennccee ooff tthhee hhuummaann ggeennoommee
Nature
2004,
443311::
931-945.
3. Jaillon O, Aury JM, Brunet F, Petit JL, Stange-Thomann N, Mauceli
E, Bouneau L, Fischer C, Ozouf-Costaz C, Bernot A, Nicaud S,
Jaffe D, Fisher S, Lutfalla G, Dossat C, Segurens B, Dasilva C,
Salanoubat M, Levy M, Boudet N, Castellano S, Anthouard V, Jubin
C, Castelli V, Katinka M, Vacherie B, Biémont C, Skalli Z, Cattolico
L, Poulain J,
et al
:
GGeennoommee dduupplliiccaattiioonn iinn tthhee tteelleeoosstt ffiisshh
TTeettrraaooddoonn nniiggrroovviirriiddiiss rreevveeaallss tthhee eeaarrllyy vveerrtteebbrraattee pprroottoo kkaarryy
oottyyppee
Nature
2004,
443311::
946-957.
4. Mouse Genome Sequencing Consortium, Waterston RH, Lind-
blad-Toh K, Birney E, Rogers J, Abril JF, Agarwal P, Agarwala R,
Ainscough R, Alexandersson M, An P, Antonarakis SE, Attwood J,
Baertsch R, Bailey J, Barlow K, Beck S, Berry E, Birren B, Bloom T,
Bork P, Botcherby M, Bray N, Brent MR, Brown DG, Brown SD,
Bult C, Burton J, Butler J, Campbell RD,
et al
:
IInniittiiaall sseeqquueenncciinngg aanndd
ccoommppaarraattiivvee aannaallyyssiiss ooff tthhee mmoouussee ggeennoommee
Nature
2002,
442200::
520-
562.
5. King MC, Wilson AC:
EEvvoolluuttiioonn aatt ttwwoo lleevveellss iinn hhuummaannss aanndd cchhiimm
ppaannzzeeeess
Science
1975,
118888::
107-116.
6. Cooper TF, Rozen DE, Lenski RE:
PPaarraalllleell cchhaannggeess iinn ggeennee eexxpprreess
ssiioonn aafftteerr 2200,,000000 ggeenneerraattiioonnss ooff eevvoolluuttiioonn iinn
EEsscchheerriicchhiiaa ccoollii
Proc
Natl Acad Sci USA
2003,
110000::
1072-1077.
7. Ferea TL, Botstein D, Brown PO, Rosenzweig RF:
SSyysstteemmaattiicc
cchhaannggeess iinn ggeennee eexxpprreessssiioonn ppaatttteerrnnss ffoolllloowwiinngg aaddaappttiivvee eevvoolluuttiioonn
iinn yyeeaasstt
Proc Natl Acad Sci USA
1999,
9966::
9721-9726.
8. Gompel N, Prud’homme B, Wittkopp PJ, Kassner VA, Carroll SB:
CChhaannccee ccaauugghhtt oonn tthhee wwiinngg::
cciiss
rreegguullaattoorryy eevvoolluuttiioonn aanndd tthhee oorriiggiinn
ooff ppiiggmmeenntt ppaatttteerrnnss iinn
DDrroossoopphhiillaa
Nature
2005,
443333::
481-487.
9. Miller CT, Beleza S, Pollen AA, Schluter D, Kittles RA, Shriver MD,
Kingsley DM:
cciiss
RReegguullaattoorryy cchhaannggeess iinn KKiitt lliiggaanndd eexxpprreessssiioonn aanndd
ppaarraalllleell eevvoolluuttiioonn ooff ppiiggmmeennttaattiioonn iinn ssttiicckklleebbaacckkss aanndd hhuummaannss
Cell
2007,
113311::
1179-1189.
10. Prud’homme B, Gompel N, Rokas A, Kassner VA, Williams TM,
Yeh SD, True JR, Carroll SB:
RReeppeeaatteedd mmoorrpphhoollooggiiccaall eevvoolluuttiioonn
tthhrroouugghh
cciiss
rreegguullaattoorryy cchhaannggeess iinn aa pplleeiioottrrooppiicc ggeennee
Nature
2006,
444400::
1050-1053.
11. Shapiro MD, Marks ME, Peichel CL, Blackman BK, Nereng KS,
Jonsson B, Schluter D, Kingsley DM:
GGeenneettiicc aanndd ddeevveellooppmmeennttaall
bbaassiiss ooff eevvoolluuttiioonnaarryy ppeellvviicc rreedduuccttiioonn iinn tthhrreeeessppiinnee ssttiicckklleebbaacckkss
Nature
2004,
442288::
717-723.
12. Wittkopp PJ, Haerum BK, Clark AG:
EEvvoolluuttiioonnaarryy cchhaannggeess iinn
cciiss
aanndd
ttrraannss
ggeennee rreegguullaattiioonn
Nature
2004,
443300::
85-88.
13. Wray GA:
TTrraannssccrriippttiioonnaall rreegguullaattiioonn aanndd tthhee eevvoolluuttiioonn ooff ddeevveelloopp
mmeenntt
Int J Dev Biol
2003,
4477::
675-684.
14. Hammock EA, Young LJ:
MMiiccrroossaatteelllliittee iinnssttaabbiilliittyy ggeenneerraatteess ddiivveerr
ssiittyy iinn bbrraaiinn aanndd ssoocciioobbeehhaavviioorraall ttrraaiittss
Science
2005,
330088::
1630-
1634.
15. Lim MM, Wang Z, Olazabal DE, Ren X, Terwilliger EF, Young LJ:
EEnnhhaanncceedd ppaarrttnneerr pprreeffeerreennccee iinn aa pprroommiissccuuoouuss ssppeecciieess bbyy mmaanniippuu
llaattiinngg tthhee eexxpprreessssiioonn ooff aa ssiinnggllee ggeennee
Nature
2004,
442299::
754-757.
16. Anand S, Wang WC, Powell DR, Bolanowski SA, Zhang J, Ledje C,
Pawashe AB, Amemiya CT, Shashikant CS:
DDiivveerrggeennccee ooff HHooxxcc88
eeaarrllyy eennhhaanncceerr ppaarraalllleellss ddiivveerrggeedd aaxxiiaall mmoorrpphhoollooggiieess bbeettwweeeenn
mmaammmmaallss aanndd ffiisshheess
Proc Natl Acad Sci USA
2003,
110000::
15666-
15669.
17. Khaitovich P, Weiss G, Lachmann M, Hellmann I, Enard W,
Muetzel B, Wirkner U, Ansorge W, Paabo S:
AA nneeuuttrraall mmooddeell ooff
ttrraannssccrriippttoommee eevvoolluuttiioonn
PLoS Biol
2004,
22::
E132.
18. Zhang Y, Sturgill D, Parisi M, Kumar S, Oliver B:
CCoonnssttrraaiinntt aanndd
ttuurrnnoovveerr iinn sseexx bbiiaasseedd ggeennee eexxpprreessssiioonn iinn tthhee ggeennuuss
DDrroossoopphhiillaa
Nature
2007,
445500::
233-237.
19. Yanai I, Graur D, Ophir R:
IInnccoonnggrruueenntt eexxpprreessssiioonn pprrooffiilleess
bbeettwweeeenn hhuummaann aanndd mmoouussee oorrtthhoollooggoouuss ggeenneess ssuuggggeesstt wwiiddeesspprreeaadd
nneeuuttrraall eevvoolluuttiioonn ooff ttrraannssccrriippttiioonn ccoonnttrrooll
OMICS
2004,
88::
15-24.
20. ENCODE Project Consortium, Birney E, Stamatoyannopoulos JA,
Dutta A, Guigó R, Gingeras TR, Margulies EH, Weng Z, Snyder M,
Dermitzakis ET, Thurman RE, Kuehn MS, Taylor CM, Neph S,
Koch CM, Asthana S, Malhotra A, Adzhubei I, Greenbaum JA,
Andrews RM, Flicek P, Boyle PJ, Cao H, Carter NP, Clelland GK,
Davis S, Day N, Dhami P, Dillon SC, Dorschner MO,
et al.
:
IIddeennttii
ffiiccaattiioonn aanndd aannaallyyssiiss ooff ffuunnccttiioonnaall eelleemmeennttss iinn 11%% ooff tthhee hhuummaann
ggeennoommee bbyy tthhee EENNCCOODDEE ppiilloott pprroojjeecctt
Nature
2007,
444477::
799-816.
21. Yan W, Ma L, Zilinski CA, Matzuk MM:
IIddeennttiiffiiccaattiioonn aanndd cchhaarraacctteerrii
zzaattiioonn ooff eevvoolluuttiioonnaarriillyy ccoonnsseerrvveedd ppuuffffeerrffiisshh,, zzeebbrraaffiisshh,, aanndd ffrroogg
oorrtthhoollooggss ooff GGAASSZZ
Biol Reprod
2004,
7700::
1619-1625.
22. Chervenak AP, Basu P, Shin M, Redmond LC, Sheng G, Lloyd JA:
IIddeennttiiffiiccaattiioonn,, cchhaarraacctteerriizzaattiioonn,, aanndd eexxpprreessssiioonn ppaatttteerrnn ooff tthhee
cchhiicckkeenn EEKKLLFF ggeennee
Dev Dyn
2006,
223355::
1933-1940.
23. Shi X, Bosenko DV, Zinkevich NS, Foley S, Hyde DR, Semina EV,
Vihtelic TS:
ZZeebbrraaffiisshh ppiittxx33 iiss nneecceessssaarryy ffoorr nnoorrmmaall lleennss aanndd rreettiinnaall
ddeevveellooppmmeenntt
Mech Dev
2005,
112222::
513-527.
24. Marza E, Barthe C, Andre M, Villeneuve L, Helou C, Babin PJ:
DDeevveellooppmmeennttaall eexxpprreessssiioonn aanndd nnuuttrriittiioonnaall rreegguullaattiioonn ooff aa zzeebbrraaffiisshh
ggeennee hhoommoollooggoouuss ttoo mmaammmmaalliiaann mmiiccrroossoommaall ttrriiggllyycceerriiddee ttrraannssffeerr
pprrootteeiinn llaarrggee ssuubbuunniitt
Dev Dyn
2005,
223322::
506-518.
25. Wray GA:
TThhee eevvoolluuttiioonnaarryy ssiiggnniiffiiccaannccee ooff
cciiss
rreegguullaattoorryy mmuuttaa
ttiioonnss
Nat Rev Genet
2007,
88::
206-216.
26. Bejerano G, Pheasant M, Makunin I, Stephen S, Kent WJ, Mattick
JS, Haussler D:
UUllttrraaccoonnsseerrvveedd eelleemmeennttss iinn tthhee hhuummaann ggeennoommee
Science
2004,
330044::
1321-1325.
27. Pennacchio LA, Ahituv N, Moses AM, Prabhakar S, Nobrega MA,
Shoukry M, Minovitsky S, Dubchak I, Holt A, Lewis KD, Plajzer-
Frick I, Akiyama J, De Val S, Afzal V, Black BL, Couronne O, Eisen
MB, Visel A, Rubin EM:
IInn vviivvoo
eennhhaanncceerr aannaallyyssiiss ooff hhuummaann ccoonn
sseerrvveedd nnoonn ccooddiinngg sseeqquueenncceess
Nature
2006,
444444::
499-502.
28. Siepel A, Bejerano G, Pedersen JS, Hinrichs AS, Hou M, Rosen-
bloom K, Clawson H, Spieth J, Hillier LW, Richards S, Weinstock
GM, Wilson RK, Gibbs RA, Kent WJ, Miller W, Haussler D:
EEvvoolluu
ttiioonnaarriillyy ccoonnsseerrvveedd eelleemmeennttss iinn vveerrtteebbrraattee,, iinnsseecctt,, wwoorrmm,, aanndd
yyeeaasstt ggeennoommeess
Genome Res
2005,
1155::
1034-1050.
29. Woolfe A, Goodson M, Goode DK, Snell P, McEwen GK, Vavouri
T, Smith SF, North P, Callaway H, Kelly K, Walter K, Abnizova I,
Gilks W, Edwards YJ, Cooke JE, Elgar G:
HHiigghhllyy ccoonnsseerrvveedd nnoonn
ccooddiinngg sseeqquueenncceess aarree aassssoocciiaatteedd wwiitthh vveerrtteebbrraattee ddeevveellooppmmeenntt
PLoS Biol
2005,
33::
e7.
30. Prabhakar S, Poulin F, Shoukry M, Afzal V, Rubin EM, Couronne O,
Pennacchio LA:
CClloossee sseeqquueennccee ccoommppaarriissoonnss aarree ssuuffffiicciieenntt ttoo iiddeenn
ttiiffyy hhuummaann
cciiss
rreegguullaattoorryy eelleemmeennttss
Genome Res
2006,
1166::
855-
863.
31. Thomas JW, Touchman JW, Blakesley RW, Bouffard GG, Beck-
strom-Sternberg SM, Margulies EH, Blanchette M, Siepel AC,
Thomas PJ, McDowell JC, Maskeri B, Hansen NF, Schwartz MS,
Weber RJ, Kent WJ, Karolchik D, Bruen TC, Bevan R, Cutler DJ,
Schwartz S, Elnitski L, Idol JR, Prasad AB, Lee-Lin SQ, Maduro VV,
Summers TJ, Portnoy ME, Dietrich NL, Akhter N, Ayele K,
et al.
:
CCoommppaarraattiivvee aannaallyysseess ooff mmuullttii ssppeecciieess sseeqquueenncceess ffrroomm ttaarrggeetteedd
ggeennoommiicc rreeggiioonnss
Nature
2003,
442244::
788-793.
32. Dermitzakis ET, Clark AG:
EEvvoolluuttiioonn ooff ttrraannssccrriippttiioonn ffaaccttoorr
bbiinnddiinngg ssiitteess iinn mmaammmmaalliiaann ggeennee rreegguullaattoorryy rreeggiioonnss:: ccoonnsseerrvvaattiioonn
aanndd ttuurrnnoovveerr
Mol Biol Evol
2002,
1199::
1114-1121.
33. Odom DT, Dowell RD, Jacobsen ES, Gordon W, Danford TW,
MacIsaac KD, Rolfe PA, Conboy CM, Gifford DK, Fraenkel E:
TTiissssuuee ssppeecciiffiicc ttrraannssccrriippttiioonnaall rreegguullaattiioonn hhaass ddiivveerrggeedd ssiiggnniiffiiccaannttllyy
bbeettwweeeenn hhuummaann aanndd mmoouussee
Nat Genet
2007,
3399::
730-732.
34. Oda-Ishii I, Bertrand V, Matsuo I, Lemaire P, Saiga H:
MMaakkiinngg vveerryy
ssiimmiillaarr eemmbbrryyooss wwiitthh ddiivveerrggeenntt ggeennoommeess:: ccoonnsseerrvvaattiioonn ooff rreegguullaa
ttoorryy mmeecchhaanniissmmss ooff OOttxx bbeettwweeeenn tthhee aasscciiddiiaannss
HHaallooccyynntthhiiaa rroorreettzzii
aanndd
CCiioonnaa iinntteessttiinnaalliiss
Development
2005,
113322::
1663-1674.
35. Sanges R, Kalmar E, Claudiani P, D’Amato M, Muller F, Stupka E:
SShhuufffflliinngg ooff
cciiss
rreegguullaattoorryy eelleemmeennttss iiss aa ppeerrvvaassiivvee ffeeaattuurree ooff tthhee
vveerrtteebbrraattee lliinneeaaggee
Genome Biol
2006,
77::
R56.
36. Huntley S, Baggott DM, Hamilton AT, Tran-Gyamfi M, Yang S, Kim
J, Gordon L, Branscomb E, Stubbs L:
AA ccoommpprreehheennssiivvee ccaattaalloogg ooff
hhuummaann KKRRAABB aassssoocciiaatteedd zziinncc ffiinnggeerr ggeenneess:: iinnssiigghhttss iinnttoo
27
tthhee eevvoo
l
luuttiioonnaarryy hhiissttoorryy ooff aa llaarrggee ffaammiillyy ooff ttrraannssccrriippttiioonnaall rreepprreessssoorrss
Genome Res
2006,
1166::
669-677.
37. Blekhman R, Oshlack A, Chabot AE, Smyth GK, Gilad Y:
GGeennee rreegg
uullaattiioonn iinn pprriimmaatteess eevvoollvveess uunnddeerr ttiissssuuee ssppeecciiffiicc sseelleeccttiioonn pprreess
ssuurreess
PLoS Genet
2008,
44::
e1000271.
33.16
Journal of Biology
2009, Volume 8, Article 33 Chan
et al.
/>Journal of Biology
2009,
88::
33
38. Gilad Y, Oshlack A, Smyth GK, Speed TP, White KP:
EExxpprreessssiioonn
pprrooffiilliinngg iinn pprriimmaatteess rreevveeaallss aa rraappiidd eevvoolluuttiioonn ooff hhuummaann ttrraannssccrriipp
ttiioonn ffaaccttoorrss
Nature
2006,
444400::
242-245.
39. Wagner GP, Lynch VJ:
TThhee ggeennee rreegguullaattoorryy llooggiicc ooff ttrraannssccrriippttiioonn
ffaaccttoorr eevvoolluuttiioonn
Trends Ecol Evol
2008,
2233::
377-385.
40. Rifkin SA, Kim J, White KP:
EEvvoolluuttiioonn ooff ggeennee eexxpprreessssiioonn iinn tthhee
DDrroossoopphhiillaa mmeellaannooggaasstteerr
ssuubbggrroouupp
Nat Genet
2003,
3333::
138-144.
41. Venkatesh B, Yap WH:
CCoommppaarraattiivvee ggeennoommiiccss uussiinngg ffuugguu:: aa ttooooll
ffoorr tthhee iiddeennttiiffiiccaattiioonn ooff ccoonnsseerrvveedd vveerrtteebbrraattee
cciiss
rreegguullaattoorryy eellee
mmeennttss
Bioessays
2005,
2277::
100-107.
42. Fisher S, Grice EA, Vinton RM, Bessling SL, McCallion AS:
CCoonnsseerr
vvaattiioonn ooff RREETT rreegguullaattoorryy ffuunnccttiioonn ffrroomm hhuummaann ttoo zzeebbrraaffiisshh wwiitthhoouutt
sseeqquueennccee ssiimmiillaarriittyy
Science
2006,
331122::
276-279.
43. Schadt EE, Edwards SW, GuhaThakurta D, Holder D, Ying L,
Svetnik V, Leonardson A, Hart KW, Russell A, Li G, Cavet G,
Castle J, McDonagh P, Kan Z, Chen R, Kasarskis A, Margarint M,
Caceres RM, Johnson JM, Armour CD, Garrett-Engele PW, Tsi-
noremas NF, Shoemaker DD:
AA ccoommpprreehheennssiivvee ttrraannssccrriipptt iinnddeexx ooff
tthhee hhuummaann ggeennoommee ggeenneerraatteedd uussiinngg mmiiccrrooaarrrraayyss aanndd ccoommppuuttaa
ttiioonnaall aapppprrooaacchheess
Genome Biol
2004,
55::
R73.
44. Zhang W, Morris QD, Chang R, Shai O, Bakowski MA, Mitsakakis
N, Mohammad N, Robinson MD, Zirngibl R, Somogyi E, Laurin N,
Eftekharpour E, Sat E, Grigull J, Pan Q, Peng WT, Krogan N,
Greenblatt J, Fehlings M, van der Kooy D, Aubin J, Bruneau BG,
Rossant J, Blencowe BJ, Frey BJ, Hughes TR:
TThhee ffuunnccttiioonnaall llaanndd
ssccaappee ooff mmoouussee ggeennee eexxpprreessssiioonn
J Biol
2004,
33::
21.
45. Chung WY, Albert R, Albert I, Nekrutenko A, Makova KD:
RRaappiidd
aanndd aassyymmmmeettrriicc ddiivveerrggeennccee ooff dduupplliiccaattee ggeenneess iinn tthhee hhuummaann ggeennee
ccooeexxpprreessssiioonn nneettwwoorrkk
BMC Bioinformatics
2006,
77::
46.
46. Gu X, Zhang Z, Huang W:
RRaappiidd eevvoolluuttiioonn ooff eexxpprreessssiioonn aanndd rreegguu
llaattoorryy ddiivveerrggeenncceess aafftteerr yyeeaasstt ggeennee dduupplliiccaattiioonn
Proc Natl Acad Sci
USA
2005,
110022::
707-712.
47. Remm M, Storm CE, Sonnhammer EL:
AAuuttoommaattiicc cclluusstteerriinngg ooff
oorrtthhoollooggss aanndd iinn ppaarraallooggss ffrroomm ppaaiirrwwiissee ssppeecciieess ccoommppaarriissoonnss
J
Mol Biol
2001,
331144::
1041-1052.
48. Hedges SB:
TThhee oorriiggiinn aanndd eevvoolluuttiioonn ooff mmooddeell oorrggaanniissmmss
Nat Rev
Genet
2002,
33::
838-849.
49. Khaitovich P, Hellmann I, Enard W, Nowick K, Leinweber M, Franz
H, Weiss G, Lachmann M, Paabo S:
PPaarraalllleell ppaatttteerrnnss ooff eevvoolluuttiioonn iinn
tthhee ggeennoommeess aanndd ttrraannssccrriippttoommeess ooff hhuummaannss aanndd cchhiimmppaannzzeeeess
Science
2005,
330099::
1850-1854.
50. Khaitovich P, Enard W, Lachmann M, Paabo S:
EEvvoolluuttiioonn ooff
pprriimmaattee ggeennee eexxpprreessssiioonn
Nat Rev Genet
2006,
77::
693-702.
51. Hallikas O, Palin K, Sinjushina N, Rautiainen R, Partanen J,
Ukkonen E, Taipale J:
GGeennoommee wwiiddee pprreeddiiccttiioonn ooff mmaammmmaalliiaann
eennhhaanncceerrss bbaasseedd oonn aannaallyyssiiss ooff ttrraannssccrriippttiioonn ffaaccttoorr bbiinnddiinngg aaffffiinniittyy
Cell
2006,
112244::
47-59.
52. Sandelin A, Alkema W, Engstrom P, Wasserman WW, Lenhard B:
JJAASSPPAARR:: aann ooppeenn aacccceessss ddaattaabbaassee ffoorr eeuukkaarryyoottiicc ttrraannssccrriippttiioonn
ffaaccttoorr bbiinnddiinngg pprrooffiilleess
Nucleic Acids Res
2004,
3322::
D91-D94.
53. Whitehead A, Crawford DL:
VVaarriiaattiioonn wwiitthhiinn aanndd aammoonngg ssppeecciieess iinn ggeennee
eexxpprreessssiioonn:: rraaww mmaatteerriiaall ffoorr eevvoolluuttiioonn
Mol Ecol
2006,
1155::
1197-1211.
54. Stuart JM, Segal E, Koller D, Kim SK:
AA ggeennee ccooeexxpprreessssiioonn
nneettwwoorrkk ffoorr gglloobbaall ddiissccoovveerryy ooff ccoonnsseerrvveedd ggeenneettiicc mmoodduulleess
Science
2003,
330022::
249-255.
55. Meiklejohn CD, Parsch J, Ranz JM, Hartl DL:
RRaappiidd eevvoolluuttiioonn ooff
mmaallee bbiiaasseedd ggeennee eexxpprreessssiioonn iinn
DDrroossoopphhiillaa
Proc Natl Acad Sci
USA
2003,
110000::
9894-9899.
56. Zapata A, Diez B, Cejalvo T, Gutierrez-de Frias C, Cortes A:
OOnnttooggeennyy ooff tthhee iimmmmuunnee ssyysstteemm ooff ffiisshh
Fish Shellfish Immunol
2006,
2200::
126-136.
57. Wilson MD, Barbosa-Morais NL, Schmidt D, Conboy CM, Vanes
L, Tybulewicz VL, Fisher EM, Tavare S, Odom DT:
SSppeecciieess ssppeecciiffiicc
ttrraannssccrriippttiioonn iinn mmiiccee ccaarrrryyiinngg hhuummaann cchhrroommoossoommee 2211
Science
2008,
332222::
434-438.
58. Bustamante CD, Fledel-Alon A, Williamson S, Nielsen R, Hubisz
MT, Glanowski S, Tanenbaum DM, White TJ, Sninsky JJ, Hernan-
dez RD, Civello D, Adams MD, Cargill M, Clark AG:
NNaattuurraall sseelleecc
ttiioonn oonn pprrootteeiinn ccooddiinngg ggeenneess iinn tthhee hhuummaann ggeennoommee
Nature
2005,
443377::
1153-1157.
59. Lopez-Bigas N, De S, Teichmann SA:
FFuunnccttiioonnaall pprrootteeiinn ddiivveerrggeennccee
iinn tthhee eevvoolluuttiioonn ooff
HHoommoo ssaappiieennss
Genome Biol
2008,
99::
R33.
60. Berger MF, Badis G, Gehrke AR, Talukder S, Philippakis AA, Pena-
Castillo L, Alleyne TM, Mnaimneh S, Botvinnik OB, Chan ET,
Khalid F, Zhang W, Newburger D, Jaeger SA, Morris QD, Bulyk
ML, Hughes TR:
VVaarriiaattiioonn iinn hhoommeeooddoommaaiinn DDNNAA bbiinnddiinngg rreevveeaalleedd
bbyy hhiigghh rreessoolluuttiioonn aannaallyyssiiss ooff sseeqquueennccee pprreeffeerreenncceess
Cell
2008,
113333::
1266-1276.
61. Luscombe NM, Thornton JM:
PPrrootteeiinn DDNNAA iinntteerraaccttiioonnss:: aammiinnoo
aacciidd ccoonnsseerrvvaattiioonn aanndd tthhee eeffffeeccttss ooff mmuuttaattiioonnss oonn bbiinnddiinngg ssppeeccii
ffiicciittyy
J Mol Biol
2002,
332200::
991-1009.
62. Segal E, Raveh-Sadka T, Schroeder M, Unnerstall U, Gaul U:
PPrree
ddiiccttiinngg eexxpprreessssiioonn ppaatttteerrnnss ffrroomm rreegguullaattoorryy sseeqquueennccee iinn
DDrroossoopphhiillaa
sseeggmmeennttaattiioonn
Nature
2008,
445511::
535-540.
63.
CCoonnsseerrvvaattiioonn ooff CCoorree GGeennee EExxpprreessssiioonn iinn VVeerrtteebbrraattee TTiissssuueess::
SSuupppplleemmeennttaarryy DDaattaa
[ />tary-data/vertebrate_expression]
64. Hubbard TJ, Aken BL, Beal K, Ballester B, Caccamo M, Chen Y,
Clarke L, Coates G, Cunningham F, Cutts T, Down T, Dyer SC,
Fitzgerald S, Fernandez-Banet J, Graf S, Haider S, Hammond M,
Herrero J, Holland R, Howe K, Howe K, Johnson N, Kahari A,
Keefe D, Kokocinski F, Kulesha E, Lawson D, Longden I, Melsopp
C, Megy K,
et al.
:
EEnnsseemmbbll 22000077
Nucleic Acids Res
2007,
3355::
D610-D617.
65. Su AI, Wiltshire T, Batalov S, Lapp H, Ching KA, Block D, Zhang J,
Soden R, Hayakawa M, Kreiman G, Cooke MP, Walker JR,
Hogenesch JB:
AA ggeennee aattllaass ooff tthhee mmoouussee aanndd hhuummaann pprrootteeiinn
eennccooddiinngg ttrraannssccrriippttoommeess
Proc Natl Acad Sci USA
2004,
110011::
6062-
6067.
66. Kent WJ:
BBLLAATT——tthhee BBLLAASSTT lliikkee aalliiggnnmmeenntt ttooooll
Genome Res
2002,
1122::
656-664.
67. O’Brien KP, Remm M, Sonnhammer EL:
IInnppaarraannooiidd:: aa ccoommpprreehheenn
ssiivvee ddaattaabbaassee ooff eeuukkaarryyoottiicc oorrtthhoollooggss
Nucleic Acids Res
2005,
3333::
D476-D480.
68. Altschul SF, Gish W, Miller W, Myers EW, Lipman DJ:
BBaassiicc llooccaall
aalliiggnnmmeenntt sseeaarrcchh ttooooll
J Mol Biol
1990,
221155::
403-410.
69. Alexeyenko A, Tamas I, Liu G, Sonnhammer EL:
AAuuttoommaattiicc cclluuss
tteerriinngg ooff oorrtthhoollooggss aanndd iinnppaarraallooggss sshhaarreedd bbyy mmuullttiippllee pprrootteeoommeess
Bioinformatics
2006,
2222::
e9-e15.
70. Kasprzyk A, Keefe D, Smedley D, London D, Spooner W, Melsopp
C, Hammond M, Rocca-Serra P, Cox T, Birney E:
EEnnssMMaarrtt:: aa
ggeenneerriicc ssyysstteemm ffoorr ffaasstt aanndd fflleexxiibbllee aacccceessss ttoo bbiioollooggiiccaall ddaattaa
Genome Res
2004,
1144::
160-169.
71. Huber W, von Heydebreck A, Sultmann H, Poustka A, Vingron M:
VVaarriiaannccee ssttaabbiilliizzaattiioonn aapppplliieedd ttoo mmiiccrrooaarrrraayy ddaattaa ccaalliibbrraattiioonn aanndd ttoo
tthhee qquuaannttiiffiiccaattiioonn ooff ddiiffffeerreennttiiaall eexxpprreessssiioonn
Bioinformatics
2002,
1188 ((SSuuppppll 11))::
S96-S104.
72. Schug J, Schuller WP, Kappen C, Salbaum JM, Bucan M, Stoeckert
CJ, Jr:
PPrroommootteerr ffeeaattuurreess rreellaatteedd ttoo ttiissssuuee ssppeecciiffiicciittyy aass mmeeaassuurreedd
bbyy SShhaannnnoonn eennttrrooppyy
Genome Biol
2005,
66::
R33.
73.
UUCCSSCC GGeennoommee BBiiooiinnffoorrmmaattiiccss
[]
74.
EElleeccttrroonniicc SSuupppplleemmeenntt:: UUllttrraaccoonnsseerrvveedd EElleemmeennttss iinn tthhee HHuummaann
GGeennoommee
[ />75. Finn RD, Tate J, Mistry J, Coggill PC, Sammut SJ, Hotz HR, Ceric
G, Forslund K, Eddy SR, Sonnhammer EL, Bateman A:
TThhee PPffaamm
pprrootteeiinn ffaammiilliieess ddaattaabbaassee
Nucleic Acids Res
2008,
3366::
D281-
D288.
76. Brudno M, Do CB, Cooper GM, Kim MF, Davydov E, Green ED,
Sidow A, Batzoglou S:
LLAAGGAANN aanndd MMuullttii LLAAGGAANN:: eeffffiicciieenntt ttoooollss
ffoorr llaarrggee ssccaallee mmuullttiippllee aalliiggnnmmeenntt ooff ggeennoommiicc DDNNAA
Genome Res
2003,
1133::
721-731.
77. Brudno M, Malde S, Poliakov A, Do CB, Couronne O, Dubchak I,
Batzoglou S:
GGllooccaall aalliiggnnmmeenntt:: ffiinnddiinngg rreeaarrrraannggeemmeennttss dduurriinngg aalliiggnn
mmeenntt
Bioinformatics
2003,
1199 ((SSuuppppll 11))::
i54-i62.
78. Schwartz S, Kent WJ, Smit A, Zhang Z, Baertsch R, Hardison RC,
Haussler D, Miller W:
HHuummaann mmoouussee aalliiggnnmmeennttss wwiitthh BBLLAASSTTZZ
Genome Res
2003,
1133::
103-107.
/>Journal of Biology
2009, Volume 8, Article 33 Chan
et al.
33.17
Journal of Biology
2009,
88::
33