Báo cáo lâm nghiệp: "Changes in air quality in different phases of forest management process in a sub-mountain beech ecosystem (West Carpathian Mts.)" pdf
Bạn đang xem bản rút gọn của tài liệu. Xem và tải ngay bản đầy đủ của tài liệu tại đây (316.62 KB, 8 trang )
368 J. FOR. SCI., 55, 2009 (8): 368–375
JOURNAL OF FOREST SCIENCE, 55, 2009 (8): 368–375
Forest ecosystems are damaged by a range of
harmful agents acting synergically. Among the an-
thropogenic ones, airborne pollutants (immissions)
are considered the most important.
In the first half of the 1990s, the developmental
trends in emission and immission conditions in Slo-
vakia were positive, then a stagnation followed – up
to the end of the century (S et al. 2003).
Towards the beginning of the new millennium, the
situation began to change – with certain indicators
manifesting an increase again. e contemporary
causes, however, are different from those in the past.
Today it is nitrogen dioxide, particulate matter and
ozone (V, S 2000; SHMÚ 2006). e
decrease in NO
x
was not as steep as in SO
2
emissions
(F et al. 2005), which is associated with an
increasing number of mobile sources. Stagnation or
worsening in the case of ozone is due to long-range
transport of airborne pollutants (H et
al. 2004), and due to the meteorological situation,
Supported by the Scientific Grant Agency VEGA of the Ministry of Education of the Slovak Republic and the Slovak Academy
of Sciences, Projects No. 2/7162/7, 2/7185/27, 2/0045/08, and by the Slovak Research and Development Agency, Contract No.
APVV-0102-06.
Changes in air quality in different phases of forest
management process in a sub-mountain beech
ecosystem (West Carpathian Mts.)
D. K
Institute of Forest Ecology, Slovak Academy of Sciences, Zvolen, Slovakia
ABSTRACT: We studied air quality in a sub-mountain beech ecosystem in the Kremnické vrchy Mts., Central Slo-
vakia. We chose the method of passive sampling. e amounts of airborne pollutants (H
+
and
O
3
) were determined at
regular time intervals, covering the whole vegetation period, on four plots with different stocking. e original stand
was subjected to two cuts with a purpose to simulate the phases of a common silvicultural process. e first research
period (1999–2003) started 10 years after the first cutting, the second (2004–2006) was launched immediately after the
second cut. Ten years after applying the first cut, the differences in the proton load input were getting smaller – with the
dynamically changing crown canopy. e largest difference in proton load (H
+
) was found between plots C and I after
the second intervention, when the correlation coefficient value was 0.15. e differences in proton load input between
the plots were influenced by the cut, especially in the first three years after its application. No significant differences
in ground level ozone concentrations between plots I (intensive cut), Me (medium intensive), Mo (moderate) and C
(control) were revealed either after the first or after the second cutting intervention. Differences in ozone concentra-
tions are not significant, and they indicate that the stocking density does not play an important role in association with
ozone affecting the stands. e increase in ozone concentrations after the second intervention was evident on all plots
– indicating the absence of connection with the individual phases of forest management process, but at the same time
indicating the presence of climate change. In the studied sub-mountain beech ecosystem in the Kremnické vrchy Mts.,
an important role of episodes with high ozone concentrations is evident.
Keywords: ground level ozone; hydrogen ion; cutting phases; sub-mountain beech stands; passive samplers
J. FOR. SCI., 55, 2009 (8): 368–375 369
especially high temperatures in the case of anti-cy-
clones with many sunny days without precipitation
(Š et al. 2007).
e intensity of direct impact of airborne pollut-
ants on forest stands is getting lower, forest soil acidi-
fication is, however, still present. ere also persist
consequences of the climate change. e resulting
persistent damage to forests requires devoting more
attention to research. In this context, our research
on the studied sub-mountain beech ecosystem was
focussed on effects of pollutants in the particular
phases of forest management process. e research
was conducted at the Beech Ecological Experimental
Site (BEES) Kremnické vrchy Mts., West Carpathian
Mts. e individual phases of silvicultural process
were simulated through regeneration cutting inter-
ventions.
MATERIAL AND METHODS
e basic idea of our research was to find out dif-
ferences in amounts of airborne pollutants entering
the stands with very similar growth conditions but
different stocking densities. e density was changed
according to the common forest management
practice. e first cut was applied in February 1989
(G 1987) with the aim to obtain the required
stocking density. e original forest cover at the
site was a mixed stand consisting of beech (76%),
fir (15%), oak (4%), and hornbeam (5%). Applying a
series of cuts with scaled intensities, four plots were
obtained: I with intensive intervention, Me with
medium-intensive intervention, Mo with moderate
intervention and control C, representing the original
stand without intervention. After the regeneration
cut done in spring 1989, the dominant woody plant
was beech (94.7% on plot C). At the time of the first
cutting intervention, the stand age was 80–90 years.
In the following years, the stand density was adjusted
by B (2000). e second cut was applied in
spring 2004 (B 2004). e stand density values
after the first and the second intervention are shown
in Table 1.
e research locality, the Beech Ecological Experi-
mental Site (BEES), is situated in Central Slovakia,
in the SE territory of the Kremnické vrchy Mts., at
altitudes ranging from 470 to 510 m (φ = 48°38'N,
λ = 19°04'E). e slope is west-oriented, from 30%
to 36%.
As for the climate, the territory of BEES belongs to
the moderate warm and moderate wet region. e
long-term annual mean of air temperature is 8.2°C,
in vegetation period 14.9°C. e annual precipita-
tion totals vary from 510 mm to 1,040 mm (annual),
in vegetation period 160–530 mm (K,
D 2002; J 2006).
As for airborne pollutants, the research plots are
situated in a locality outside the direct impact of pol
-
luting materials and outside the extreme influence
of long-range pollution transport. e nearby Zvo-
lenská kotlina basin, however, with three stationary
power units, dense network of motorways and large
railway junction can influence the situation on plots
under “favourable” meteorological conditions.
Our research on air quality was oriented locally.
We monitored pollution in the ground layer in the fo-
rested territory sufficiently distant from the local and
urban sources. At elevations where we carried out
our research, the industrial pollutants were dispersed
throughout the environment and their levels were in
general lower than in industrial agglomerations.
e possibilities of monitoring airborne pollutants
in sub-mountain conditions are limited, the data are
supplemented with figures obtained by statistical
processing or with information obtained by using
passive samplers. e equipment is neither cost-de-
manding nor does it require the presence of a power
source, and it is easy to operate. e passive samplers
Table 1. Stand density at the BEES Kremnické vrchy Mts. (West Carpathians)
Phase of management process
I Me Mo C
intensive
intervention
medium
intervention
moderate
intervention
control
1989 (after the first intervention) 0.3 0.5 0.7 0.9
1996 0.4 0.6 0.8 0.9
2004 (before the second intervention) 0.5 0.7 0.9 1.0
2004 (after the second intervention) 0.0* 0.3 0.5 1.0
*From the viewpoint of the original parent stand, the plot I (intensive intervention) is not a clear-cut any more, at present
it is covered with a natural thin-pole stand
370 J. FOR. SCI., 55, 2009 (8): 368–375
enable to precisely delineate the risk territories from
the viewpoint of potential damage to ecosystems as
well as to measure pollution levels in the individual
phases of forest management process. ey are used
not only in Slovakia (Š, B 1995;
V, B 1999; M 2000)
but also abroad (H et al. 1989; C 2003;
B et al. 2004). e methods are progres-
sively improved, getting simpler, and the obtained
results can be compared with the results obtained
with continual analyzers (G et al. 2001). eir
shortcoming is that they do not enable to monitor the
circadian concentration dynamics.
To measure the long-term influence of pollutant
load on forest ecosystems and the differences be-
tween seasonal and inter-annual concentrations it
is recommended to use the method determining the
proton load (H
+
) according to O (1989) and deter-
mining the ground level ozone (O
3
) concentrations
by the sorption-accumulation method (W
1991). e amounts of airborne substances were
determined at regular time intervals over the whole
growing season (April–September). A more detailed
description of the method is in K et al.
(1997) and K (2002).
The results were evaluated by mathematical and
statistical methods provided by the software MS
Excel 2007 in MS Windows XP. In our study Pear-
son’s correlation coefficient (r) was used measur-
ing the linear dependence between two random
variables.
RESULTS AND DISCUSSION
In 1999, ten years after the first cut, resulting on
four plots in the required phases of the forest man-
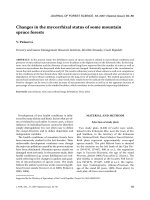
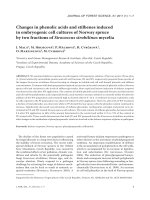
Fig. 1. Variability and trends of proton load (PL) in mmol H
+
day/m
2
(warm half of the year: spring, summer, autumn) on plots
C (control), I (intensive cut), Me (medium intensive), Mo (moderate) at the BEES Kremnické vrchy Mts.: A – after the first
cutting intervention (1999–2003), B – after the second cut (2004–2006)
(B)
A
0
10
20
30
40
50
S 99 S 99 A 99 S 00 S 00 A 00 S 01 S 01 A 01 S 02 A 02 S 03 S 03 A 03
PL
C I Me Mo
linear (C) linear (I) linear (Me) linear (Mo)
(A)
A
0
10
20
30
40
50
S 99 S 99 A 99 S 00 S 00 A 00 S 01 S 01 A 01 S 02 A 02 S 03 S 03 A 03
PL
C I Me Mo
linear (C) linear (I) linear (Me) linear (Mo)
B
0
10
20
30
40
50
S 04 S 04 A 04 S 05 S 05 A 05 S 06 S 06 A 06
PL
C I Me Mo
linear (C) linear (I) linear (Me) linear (Mo)
J. FOR. SCI., 55, 2009 (8): 368–375 371
agement process, all the plots (I – intensive interven-
tion, Me – medium-intensive intervention and Mo
– moderate intensive intervention) were covered
with a natural forest stand in the phase of thin pole.
e control plot (C) has maintained its former char-
acter – without understorey.
In 1999–2003, the quantity of proton load was
relatively uniform on all the plots (Fig. 1A). e most
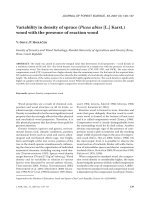
pronounced difference was detected between plots
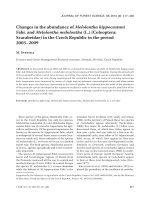
C and I, which is also documented by the correlation
coefficient value of 0.6 (Fig. 2A). ese facts cor-
responded to the natural and supposed proton flow
in forest stands. e protons are intercepted by tree
crowns fulfilling their role of filters for precipitation
and for gases (B, D 2003; D,
B 2006), depending on the stand and canopy
density. In comparison with plot I, the stand density
values on Me and Mo were more similar to the con
-
trol plot (Table 1). Higher similarity between plots
C-Me (0.9) and C-Mo (0.7) is also evident on the
related correlation coefficients.
e second cut was done in 2004, when all the
remaining trees were removed from plot I. The
stand density values were also changed on plots
Me and Mo (Table 1), and so also the crown struc
-
ture and canopy on these plots. is cut resulted
in enhanced differences in proton load amounts
between the plots (Fig. 1B). e largest difference
was between plots C and I again, with the corre
-
lation coefficient value being 0.15 only (Fig. 2B).
e value of correlation coefficient between plots
C and Me after the second cut was 0.2, in the case
of plots C and Mo it was 0.4. It follows that the dif
-
ferent amounts of proton load of the particular plots
were influenced by the cutting, the differences were,
however, most pronounced in the first three years
following the cut.
Besides the spatial trends, we also evaluated tem-
poral trends and input dynamics of the proton load.
Evaluating the annual means we can see (Fig. 1) that
the trend of proton load (H
+
) was increasing on all
the studied plots. It is probably associated, apart
from other factors, with nitrogen oxides (NO
x
), the
decrease of which does not reach the rate of sulphur
dioxide. At present the study area is noticeably in-
fluenced by developing industry and more and more
dense traffic. In this context, the research on ground-
level ozone is evidently important.
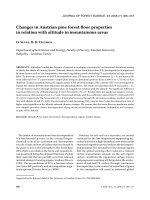
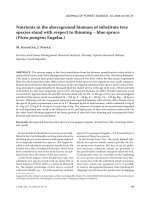
No significant differences in ground-level ozone
concentrations were identified among plots I, S, M,
C – either after the first or after the second cutting
intervention (Fig. 3).
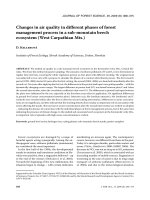
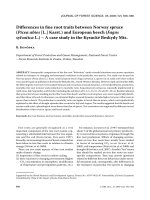
e correlation coefficients between plots C-I,
C-Me and C-Mo ranged from 0.7 to 0.9 (Figs. 4A,B).
e largest difference was detected between control
plot and plot I again, both after the first and the
second intervention when the calculated correlation
coefficient was 0.7. We can see that the differences
in ozone concentrations are not significant – which
manifests that the role of stand density is not impor-
tant in this case.
The Central-European sub-mountain areas are,
however, similar to the high-mountain ones charac-
terized by two concentration maxima per year. e
first maximum is usually reached in spring (April), the
second in summer (August). ere are mostly short-
lasting episodes with high concentrations that are in
general considered more harmful to woody plants
than long-term exposures to lower concentrations
(M et al. 1995). In events of high concen-
A
I R=0,55
Me R=0,85
Mo R=0,7
0
10
20
30
40
0 10 20 30
(PL) C
(PL) I, Me, Mo
I Me Mo
B
I R = 0,15
Me R = 0,2
Mo R = 0,39
0
10
20
30
40
0 10 20 30
(PL) C
(PL) I, Me, Mo
I Me Mo
Fig. 2. Average values of proton load (PL) in mmol H
+
day/m
2
on control plot (C) related to plots I, ∆ Me, × Mo, and their
linear dependence: A – after the first cut, B – after the second cut
(A) (B)
Me R = 0.85
I R = 0.55
Mo R = 0.7
Me R = 0.2
I R = 0.15
Mo R = 0.39
372 J. FOR. SCI., 55, 2009 (8): 368–375
trations, the vegetation can be damaged within a few
hours. During the episodes, the former established
threshold value for ozone concentration – 65 µg/m
3
(32.5 ppb) is exceeded. e immission level for forest
ecosystems and vegetation (92/72/EC) was set by the
European Union in 1992 as the 24-hour mean value.
e ozone concentration values measured on the plots
in the Kremnické vrchy Mts. were calculated for one
day; consequently, the comparison with the above-
mentioned limit is possible. On the experimental
plots, the daily critical limit of 65 µg/m
3
was exceeded
11 times in 1999–2003 and 10 times in 2004–2006
(see Figs. 3A,B). In contradiction with the fact that
recently the number of ozone episodes in Central Eu-
rope has been decreasing (V, S 2000);
their adverse impact is still effective. e impact of
episodes is in general extensive; consequently, the dif-
ferences between the plots are not noticeable.
e episodes of high ozone concentrations prima-
rily depend on locally and regionally emitted ozone
precursors, on meteorological conditions, and in
our case also on long-range transported pollution
(Z et al. 2001; L et al. 2006; Z,
C 2007). e local ozone production rep-
resents about 10% of the total amount; the major
part is associated with advection. e main local
sources are transport, solid fuel heating of houses
and agriculture.
e trend of ozone concentrations in 1999–2003
showed a moderate decrease, which was reasonable
to expect in the context of an overall decrease in
human-produced airborne pollutants in the Slovak
territory. After the second cut, however, the trend of
ozone concentrations showed an increase (Fig. 3
B).
e mean ozone concentration (56 µg/m
3
) in 2005
was one and a half times higher than the value ob-
Fig. 3. Variability and trends of ozone concentrations (µg/m
3
) (warm half of the year: April – September) on plots C, I, Me, Mo
at the BEES Kremnické vrchy Mts.: A – after the first cutting intervention (1999–2003), B – after the second cut (2004–2006)
(A)
(B)
B
0
20
40
60
80
100
120
J 04 A 04 A 05 M 05 J 05 J 05 A 05 S 05 A 06 M 06 J 06 J 06 A 06 S 06
O
3
C I Me Mo
linear (C) linear (I) linear (Me) linear (Mo)
B
0
20
40
60
80
100
120
J 04 A 04 A 05 M 05 J 05 J 05 A 05 S 05 A 06 M 06 J 06 J 06 A 06 S 06
O
3
C I Me Mo
linear (C) linear (I) linear (Me) linear (Mo)
A
0
20
40
60
80
100
120
A 99
A 99
A 00
J 00
A 00
A 01
J 01
A 01
A 02
J 02
A 02
A 03
J 03
A 03
O
3
C I Me Mo
linear (C) linear (I) linear (Me) linear (Mo)
J. FOR. SCI., 55, 2009 (8): 368–375 373
tained in 2004 (38 µg/m
3
). e year 2005 was very
warm and dry at the same time. e mean tempera-
ture in the growing season in the Zvolenská kotlina
basin is 14.8°C (1961–1990), in 2004 it was 14.3°C,
but in 2005 it was 15.1°C. e increase in ozone con-
centration after the second cutting intervention was
evident on all plots – manifesting the independence
of conditions associated with the individual phases
of silvicultural process, on the other hand, pointing
out the presence of climate change.
In the case of small areal units, passive sampling
is a method well-fitted for evaluating the data in
terms of potential damage to forest stands by pol-
lutants, and for definition of the risk area bounda-
ries. Parallelly we used the same method in a beech
stand (stand density 0.7) in the surroundings of
the aluminium plant in Žiar nad Hronom, and we
compared the two localities. e average value of
proton load on all plots in the Kremnické vrchy Mts.
10 years after the first cut was 13.9, after the second
cut it was 17.9 mmol H
+
day/m
2
. e average value
over the years 1999–2003 was 12.9, over the period
2004–2006 it was 13.1 mmol H
+
day/m
2
. e beech
stand Žiar nad Hronom was not subjected to cutting,
consequently, the amounts of pollutants entering the
stand were lower.
The average value of ozone concentration on
Kremnické vrchy Mts. plots after the first cut was 42,
after the second cut it was 49 µg/m
3
. e mean value
calculated for growing periods 1999–2003 in Žiar
nad Hronom (urban environment) was 84 µg/m
3
(H et al. 2004).
Our research results reveal that the direct impact
of polluted air on the forest stands in the Kremnické
vrchy Mts. is not getting weaker. On the other hand,
the buffering capacity of soils in this area is good,
and the soil is fairly resistant to the changing acidity.
e increasing ozone concentration is a serious risk
factor in this sub-mountain area, in spite of the fact
that it does not reach the extreme values measured
in the surroundings of Žiar nad Hronom. e con-
sequences of the persistent negative impact of ozone
may impair the health of forest stands in some cases
they may even initialize their decomposition, which
could have a significant influence on the ecosystem
stability.
CONCLUSIONS
Our research, conducted in the growing seasons
1999–2006, was focussed on the identification and
analysis of the impact of proton load (H
+
)
and ground
level ozone (O
3
) on beech stands differentiated by
the intensity of the applied cut. e modelled phases
corresponded to the phases of a common silvicul-
tural process.
Ten years after the first cut, the crown canopy was
changing dynamically, and the differences in proton
load input between the plots were getting smaller. It
was evident that the closed stand canopy performed
as a filter for precipitation and gases, and through
their retention capacity, the stands favourably influ-
enced the air quality in their interior. Significant dif-
ferences in the values of proton load were observed
between beech stands I (intensive), Me (medium
intensive), Mo (moderate) and C (control plot) after
the second intervention, especially in the first years
following the cut: 2004–2006.
Fig. 4. Average values of ozone (O
3
) concentration (µg/m
3
) on control plot (C) related to plots I, ∆ Me, × Mo, and their linear
dependence: A – after the first cut, B – after the second cut
A
I R = 0,7
Me R = 0,8
Mo R = 0,9
0
20
40
60
80
100
120
0 20 40 60 80 100 120
(O
3
) C
(O
3
) I, Me, Mo
I Me Mo
B
I R = 0,8
Me R = 0,9
Mo R = 0,9
0
20
40
60
80
100
120
0 20 40 60 80 100 120
(O
3
) C
(O
3
) I, Me, Mo
I Me Mo
(A) (B)
Me R = 0.9
Mo R = 0.9
I R = 0.8
Me R = 0.8
I R = 0.7
Mo R = 0.9
374 J. FOR. SCI., 55, 2009 (8): 368–375
No significant differences were found in ground
level ozone concentrations between the plots with
different stocking values. is fact reveals that the
stocking value has no influence. Conditions neces-
sary for ozone creation are dependent on the mete-
orological situation – governing over large areas if
it is an anticyclone and if other synergically acting
agents are present. An important risk factor has been
recognized in increasing ozone concentrations in
sub-mountain beech forests, especially in the case
of extreme ozone episodes.
e obtained information on the air quality and
on pollutants entering the environment provides
a contribution for defining conditions for natural
regeneration in beech ecosystems and for applying
regeneration cuts, including the system of forest
management methods in contemporary unfavour-
able ecological conditions.
R e f er e nc e s
BARNA
M., 2000. Impact of shelterwood cutting on twig
growth in predominant beech trees (Fagus sylvatica L.).
Ekológia (Bratislava), 19: 314–353.
BARNA M
., 2004. Adaptation of European beech (Fagus
sylvatica L.) to different ecological conditions: leaf size
variation. Polish Journal of Ecology, 52: 35–45.
BUBLINEC E., DUBOVÁ M.
, 2003. Bulk deposition in beech
ecosystem. Folia Oecologica, 30: 163–168.
BYTNEROWICZ A., GODZIK B., GRODZINSKA K.,
FRĄCZEK W., MUSSELMAN R., MANNING W., BADEA
O., POPESCU F., FLEISCHER P.
, 2004. Ambient ozone in
forest of Central Eastern European mountains. Environ-
mental Pollution, 130: 5–16.
COX R.M
., 2003. e use of passive sampling to monitor forest
exposure to O
3
, NO
2
, SO
2
: a review and some case studies.
Environmental Pollution, 126: 301–311.
DUBOVÁ M., BUBLINEC E.
, 2006. Evaluation of sulphur and
nitrate-nitrogen deposition to forest ecosystem. Ekológia
(Bratislava), 25: 366–376.
FLEISCHER P., GODZIK B., BIČÁROVÁ S., BYTNERO
WICZ A
., 2005. Effects of air pollution and climate change of
forests of Tatra Mountains, Central Europe. In: OMASA K.,
NOUCHI I., DE KOK L.J. (eds), Plant Responses to Air Pollu-
tion and Global Change. Tokyo, Springer-Verlag: 111–121.
GEROSA G., MAZZALI C., BALLARINDENTI A
., 2001.
Techniques of ozone monitoring in a mountain forest
region: passive and continuous sampling, vertical and
canopy profiles. In: Proceedings of the International Sym-
posium on Passive Sampling of Gaseous Air Pollutants in
Ecological Effects Research. e Scientific World Journal,
1: 1612–1626.
GREGUŠ C., 1987. Vybrané lesné ekosystémy v SR, ich
produktivita, stabilita, ochrana a podrobné metodické
postupy zakladania trvalých výskumných plôch. Zvolen,
ÚEL SAV: 104.
HANGARTNER M., BURRI P., MONN C
., 1989. Passive
sampling of nitrogen dioxide, sulphur dioxide and ozone
ambient air. In: BRASSER L.J., MULDER W.C. (eds), Pro-
ceedings of the 8
th
World Clean Air Congress. Man and
His Ecosystem. Amsterdam, New York, Elsevier: 681–686.
HROUZKOVÁ E., KREMLER M., SOJÁKOVÁ M., ZÁVOD
SKÝ D.
, 2004. Ground level ozone in Slovakia in 2003. Me-
teorologický časopis – Meteorological Journal, 7: 17–24.
JANÍK R
., 2006. Characteristic of air temperature in beech
ecosystem. Silva Balcanica, 7: 69–75.
KELLEROVÁ D.
, 2002. Surface ozone at the beech ecologi-
cal experimental station Kremnické vrchy Mts. Ekológia
(Bratislava), 21: 26–32.
KELLEROVÁ D., DUBOVÁ M.
, 2002. e hydrogen ion
deposition and proton load of the Kremnické vrchy Mts.
Ekológia (Bratislava), 21: 423–430.
KELLEROVÁ D., BUBLINEC E., JANÍK R.
, 1997. Expeditive
method measurements of proton load and its utilisation in
beech ecosystems. Ekológia (Bratislava), 16: 17–22.
LIU X., CHANCE K., SIORIS CH.E., KUROSU T.P., SPURR
R.J.D., MARTIN R.V., FU T.M., LOGAN J.A., JACOB
D.J., PALMER P.I., NEWCGURCH M.J., MEGRETSKAIA
I.A., CARFIELD R.B.
, 2006. First directly retrieved global
distribution of tropospheric column ozone from GOME:
Comparison with the GEOS-CHEM model. Journal of
Geophysical Research, 111: 1–17.
MOLNÁROVÁ H
., 2000. Vertical gradient of tropospheric
ozone concentrations in region of Poľana Mts. and Zvolen
basin. Meteorologický časopis – Meteorological Journal,
3: 25–32.
MORTENSEN N., BASTRUPBIRK A., ROPOULSEN H.,
1995. Critical levels of O
3
for wood production of European
beech (Fagus sylvatica L.). Water, Air, and Soil Pollution,
85: 1349–1354.
OBR F.
, 1989. Technológia prípravy pôdy pre zabezpečenie
prirodzenej obnovy v lesoch pod vplyvom imisií. [Závereč
-
ná správa.] Zvolen, LVÚ: 104.
SHMÚ, 2006. Hodnotenie kvality ovzdušia v Slovenskej re-
publike 2005. Bratislava, Slovenský hydrometeorologický
ústav: 72.
SPIŠÁKOVÁ K., SAJTÁKOVÁ E., ZÁVODSKÝ D.
, 2003.
Emission of air pollutions in the Slovak Republic. Meteoro-
logický časopis – Meteorological Journal, 6: 11–15.
ŠABLATÚROVÁ E., BIČÁROVÁ S
., 1995. Integral methods
of ozone determination in forest ecosystem. Lesnícky
časopis – Forestry Journal, 41: 97–103.
ŠEC K., SKÁCEL F., MALEC L., TEKÁČ V.
, 2007. Studium
faktorů ovlivňujících vznik a zánik troposférického ozonu.
Chemické listy, 101: 1051–1057.
VÁŇA M., SMRČKOVÁ V
., 2000. Surface ozone at the GAW
and EMEP stations in the Czech Republic. Meteorologický
časopis – Meteorological Journal, 3: 9–18.
J. FOR. SCI., 55, 2009 (8): 368–375 375
VARŠAVOVÁ M., BARANČOK P., 1999. Sledovanie tro-
posférického ozónu na vybraných lokalitách Západných
Karpát. V. Bioklimatologické pracovné dni 1999. Zvolen,
TU: 267–272.
WERNER H
., 1991. Methodische Details für das Ozonmo-
nitoring mit Indigopapieren. II Workshop zum ema
Integrale Messmethoden. Salzburg, AGRE ALP, AGRE
ALPEN-ADRIA: 1–110.
ZAPLETAL M., CHROUST P
., 2007. Depoziční tok ozonu
do lesních ekosystémů na území ČR. Ochrana ovzduší,
3: 20–26.
ZÁVODSKÝ D., MEDVEĎ M., ĎUREC F
., 2001. Atmospheric
chemistry and air pollution modelling. Banská Bystrica,
Matej Bel University: 127.
Received for publication December 2, 2008
Accepted after corrections February 19, 2009
Corresponding author:
Ing. D K, Ph.D., Ústav ekológie lesa Slovenskej akadémie vied, Štúrova 2, 960 53 Zvolen, Slovensko
tel.: + 421 455 320 313, fax: + 421 455 479 485, e-mail:
Zmeny kvality ovzdušia v rozličných fázach obhospodarovacieho procesu
v podhorskej bučine (Západné Karpaty)
ABSTRAKT: Kvalitu ovzdušia sme skúmali v podhorskej bučine v Kremnických vrchoch na strednom Slovensku.
Zvolili sme metódu pasívnych zberačov. Kvantita imisných látok (H
+
a
O
3
) sa zisťovala v pravidelných časových inter-
valoch na plochách s rozličným zakmenením počas vegetačných období. V pôvodnom poraste boli dvakrát zámerne
nasimulované fázy obhospodarovacieho procesu lesa. Prvá výskumná perióda (1999–2003) začala 10 rokov po prvom
zásahu, druhá (2004–2006) bezprostredne po druhom zásahu. Desať rokov po prvej ťažbe sa rozdiely inputu pro-
tónovej záťaže medzi plochami vyrovnávali s dynamicky sa meniacim zápojom korún. Najväčší rozdiel protónovej
záťaže (H
+
) bol medzi plochami C a I po druhom zásahu, kedy bola hodnota korelačného koeficientu 0,15. Diferencie
vstupu protónovej záťaže na jednotlivé plochy boli ovplyvnené ťažbovým zásahom prevažne v prvých troch rokoch
po ťažbe. Podstatné rozdiely v koncentrácii prízemného ozónu medzi výskumnými plochami I (intenzívny zásah),
Me (stredne intenzívny), Mo (mierny zásah) a C (kontrolná plocha) sa nepreukázali ani po prvom, ani po druhom
ťažbovom zásahu. Diferencie v koncentráciách ozónu sú nevýrazné, z čoho vyplýva, že rozličné zakmenenie, v prí-
pade pôsobenia ozónu na porasty, nezohráva významnú úlohu. Nárast koncentrácií ozónu po druhom zásahu bol
na všetkých plochách, čo nepoukazuje na súvislosť s ťažbovými fázami obhospodarovacieho procesu, ale na zmenu
klimatických podmienok. V podhorskej bučine Kremnických vrchov zohrávajú významnú úlohu epizódy s vysokými
koncentráciami ozónu.
Kľúčové slová: prízemný ozón; vodíkový ión; fázy obhospodarovania; podhorská bučina; pasívne zberače