Báo cáo lâm nghiệp: "Moisture effect on carbon and nitrogen mineralization in topsoil of Changbai Mountain, Northeast China" pptx
Bạn đang xem bản rút gọn của tài liệu. Xem và tải ngay bản đầy đủ của tài liệu tại đây (399.68 KB, 9 trang )
340 J. FOR. SCI., 57, 2011 (8): 340–348
JOURNAL OF FOREST SCIENCE, 57, 2011 (8): 340–348
A great deal of attention has been paid to soil
respiration and soil carbon (C) mineralization for
their significant impact on the global carbon cycle
and terrestrial ecosystem (IPCC 2007; J
et al. 1991). Soil respiration is one of the largest
carbon flux components within terrestrial eco-
systems (H, W 1989; R,
S 1992), as well as the second largest
C flux between the atmosphere and the terrestrial
biosphere (S, A 2000). e
amount of carbon dioxide (CO
2
) released from
soils is 10times higher than that from the fossil fuel
combustion (R, P 1995). As the global
temperature rises, the soil C pool will be stimulat-
ed to decompose and soil-to-atmosphere CO
2
will
increase, especially in the high northern latitudes
(L et al. 2006), due to the existence of terrestrial
C sequestration of 1–2 Pg C per year in the North-
ern Hemisphere (P et al. 2001).
Soil nitrogen (N) availability has significant influ-
ences on plant growth, thus limiting net primary
productivity (C et al. 2008) through altering the
efficiency of plant N use (A et al. 1994), chang-
ing the composition of soil microbial communities,
and affecting the biomass of microbial organisms
and roots (H et al. 2001; B et al. 2006).
However, N availability is mainly determined by
Nmineralization through transforming organic N
to inorganic form (Z et al. 2009). As the uptake
of inorganic N by plants and soil microorganisms is
significant for the net primary productivity in ter-
restrial ecosystems (J et al. 1999), N miner-
Moisture effect on carbon and nitrogen mineralization
intopsoil of Changbai Mountain, Northeast China
G. Q
1,2
, Q. W
1
, W. Z
1
, H. D
1
, X. W
1,2
, L. Q
1,2
, Y. W
1,2
,
S.L
1,2
, L. D
1
1
Institute of Applied Ecology, Chinese Academy of Sciences, Shenyang, P.R. China
2
Graduate University of Chinese Academy of Sciences, Beijing, P.R. China
ABSTRACT: Changbai Mountain Natural Reserve (1,985 km
2
and 2,734 m a.s.l.) of Northeast China is a typical
ecosystem representing the temperate biosphere. The vegetation is vertically divided into 4 dominant zones: broad-
leaved Korean pine forest (annual temperature 2.32°, annual precipitation 703.62 mm), dark coniferous forest (annual
temperature –1.78°C, annual precipitation 933.67 mm), Erman’s birch forest (annual temperature –2.80°C, annual
precipitation 1,002.09 mm) and Alpine tundra (annual temperature –3.82°C, annual precipitation 1,075.53 mm). Stud-
ies of soil carbon (C) and nitrogen (N) mineralization have attracted wide attention in the context of global climate
change. Based on the data of a 42-day laboratory incubation experiment, this paper investigated the relationship
between soil moisture and mineralization of C and N in soils with different vegetation types on the northern slope
of the Natural Reserve Zone of Changbai Mountain. The elevation influence on soil C and N mineralization was also
discussed. The results indicated that for the given vegetation type of Changbai Mountain the C and Nmineralization
rate, potential mineralizable C (C
0
) and potential rate of initial C mineralization (C
0
k) all increased as the soil moisture
rose. The elevation or vegetation type partially affected the soil C and N mineralization but without a clear pattern.
The moisture-elevation interaction significantly affected soil C and NO
3
–
-N mineralization, but the effect on NH
4
+
-N
mineralization was not significant. The complex mechanism of their impact on the soil C and Nmineralization of
Changbai Mountain remains to be studied further based on data of field measurements in the future.
Keywords: soil moisture; soil C and N mineralization; incubation experiment; Changbai Mountain; Northeast China
Supported by National Natural Science Foundation of China, Grants No. 30800139, 40873067 and 30900208, and The
Knowledge Innovation Program of the CAS, Project No. KZCX2-YW-Q1-0501.
J. FOR. SCI., 57, 2011 (8): 340–348 341
alization is usually considered as a key process in
these ecosystems (R et al. 2004).
Previous studies indicated that soil C and N min-
eralization was regulated by several environmental
factors, such as temperature, moisture and oxygen
content in soils (W et al. 2006; X et al. 2007).
In recent decades, both field measurements and
laboratory incubation data have been employed to
illuminate relationships between soil C or N min-
eralization and soil moisture in different types of
land use (B et al. 2009; Z et al. 2009).
Although studies regarding climate changes have
focused on arctic, boreal or temperate ecosystems
(C et al. 1995; D, J 2010; D
et al. 2010; L, L 2010), our knowledge of
the effects of soil moisture on soil C and N miner-
alization in forests on Changbai Mountain, North-
east China is limited.
e primary objective of this paper was to deter-
mine the effect of soil moisture on mineralization
of topsoil C and N. Secondly, we estimated poten-
tial mineralizable C in the surface layer of soils with
different moisture levels in forests and tundra on
Changbai Mountain.
METHODS
Study area
e study area is the Changbai Mountain Natu-
ral Reserve which is located on the border between
China and North Korea (41°41'–42°51'N; 127°43' to
128°16'E). e area of the reserve is about 1,985km
2
and the highest elevation is 2,734 m a.s.l e re-
serve, established in 1960, is a typical ecosystem
representing the temperate biosphere. e vegeta-
tion cover displays a vertical pattern and is divided
into 4 dominant zones along the elevation gradient,
and soils change with altitude accordingly (Table 1).
A broadleaved Korean pine forest underlain by
Alfisols is situated at elevations of 500–1,000 m
a.s.l. It is primarily dominated by Pinus koraiensis,
Quercus mongolica, Acer mono, Tilia amurensis,
Tilia manshurica, Ulmus propinqua, Fraxinus man-
dshurica, Abies holophylla and Betula costata; the
dominant shrub species are Corylus mandshurica,
Philadelphus schrenkii, Deutzia amurensis and
Eleutherococcus senticosus; the dominant herbage
species are Brachybotrys paridiformis, Cimicifuga
simplex, Phryma leptostachya, and Impatiens noli-
tangere (Y, X 2003; G et al. 2006).
A dark coniferous forest on Andosols is situ-
ated at elevations of 1,100–1,700 m, dominated by
the tree species Picea jezoensis, Picea koraiensis
and Abies nephrolepis; the dominant shrub spe-
cies are Acer ukurunduense, Lonicera edulis and
Evonymus pauciflorus; and the dominant herbage
species are Maianthemum bifolium, Carex callit-
richos, Solidago virgaaurea var. dahurica and Lin-
naea borealis.
An Erman’s birch forest underlain by Andosols is
situated at elevations of 1,700–2,000 m, dominated
by mountain birch (Betula ermanii). e dominant
shrub species are Lonicera edulis, Rhododendron
chrysanthum, Vaccinium uliginosum, and Phyl-
lodoce caerulen. e dominant herbage species
are Cacalia auriculata and Sanguisorda tenuifolia
(W et al. 2004; G et al. 2006).
e Alpine tundra on Changbai Mountain on
Andosols is situated across elevations of 1,950 to
2,700 m. It is dominated by Vaccinium uligino-
sum, Vaccinium koreanum and Papaver radicatum
var. pseudo-radicatum (D et al. 2002; G et al.
2006). e physico-chemical properties of soils at
the above four sites are shown in Table 1.
Table 1. e properties of soils on Changbai Mountain, NE China (C et al. 1981; C et al. 1981; Z et al.
1984; C 1986; Z et al. 1992; Z et al. 2001; W et al. 2005; Z 2010)
Eleva-
tion
(m)
Vegetation
type for soil
sample
Soil Annual
C:N
ratio
(g·g
–1
)
Base
saturation
(%)
Res-
piratory
quotient
Topsoil
water
content
(%)
pH
Organic
matter
(%)
Total N
type texture
tempera-
ture (°C)
precipita-
tion (mm)
(g·kg
–1
) (%)
800
Broadleaved
Korean pine
forest
Alfisols
Loam
clay
2.32 703.62 11.5 68.17 1.27 60.60 6.70 8.79 1.25 0.075
1,600
Dark conifer-
ous forest
Andosols
Silt
loam
–1.78 933.67 16.7 34.87 1.18 60.30 5.80 8.50 0.93 0.063
1,800
Erman’s birch
forest
Andosols
Sandy
loam
–2.80 1002.09 15.5 32.70 1.05 122.9 4.90 10.50 3.00 0.057
2,000
Alpine tun-
dra
Andosols
Sandy
loam
–3.82 1075.53 15.9 12.21 1.06 114.62 4.96 10.00 2.80 0.038
342 J. FOR. SCI., 57, 2011 (8): 340–348
Soil incubation experiment
Soil samples were collected from the upper 0.2m
of the topsoil. At each site we took six randomly
selected soil samples (approximately 100 g) and
mixed them respectively to yield 4 final samples
representing soils at different elevations and associ-
ated vegetation types. Soils were air dried, crushed,
and sieved through a 2-mm sieve to remove small
rocks, handpicked to remove fine roots, ground on
a ball mill and finally adjusted to different water
contents (20%, 40% and 60%, g water·g
–1
soil) for an
incubation experiment.
Soil C mineralization rates were measured by the
method of G et al. (1999). Soils with different
water contents equivalent to 20 g of air-dried soil
were aerobically incubated in 500 ml flasks (with
covers) at 20°C for 42 days. We also set up 3 air-
dried soil controls during the incubation period.
A CO
2
trap with 10 ml of 0.1mol·l
–1
NaOH was
placed in each flask. At day 1, 2, 4, 7, 14, 21, 28, 35
and 42 of incubation, the evolved CO
2
trapped in
NaOH was measured by titration with 0.05 mol·l
–1
HCl after adding 2 ml of 0.25 mol·l
–1
BaCl
2
. e air
in the flask was renewed with CO
2
-free air before
the CO
2
traps were replaced inside the flasks. Fi-
nally, the released CO
2
(mg·kg
–1
) was calculated by
the equation (1):
CO
2
= (V
0
– V) × C × 0.0222 × 10
9
/M (1)
where:
V
0
– volume of HCl consumed by air-dried soil controls
(ml),
V – volume of HCl consumed by soil samples with dif-
ferent moisture levels (ml),
C – concentration of hydrochloric acid standard solu-
tion (mol·l
–1
),
M – weight of air-dried soil (20 g in this study) (g).
e soil accumulative C mineralization quantity
equalled the sum of soil released CO
2
-C (g·air-dried
soil
–1
). e first-order decay model was used to sim-
ulate the relationship between the accumulative C
mineralization quantity and incubation time (2):
C
m
= C
0
(1 – Exp (–kt)) (2)
where:
C
m
(CO
2
-C mg·kg
–1
soil) – quantity of CO
2
-C released in
time (days),
C
0
(CO
2
-C mg·kg
–1
soil) – quantity of soil potential mine-
ralizable C,
k (day
–1
) – constant of C mineralization rate,
C
0
k – potential rate of initial C mineralization.
NO
3
–
-N was measured by the method of ultravio-
let spectrophotometry and NH
4
+
-N by the indophe-
nol blue method. Indexes of N mineralization were
calculated as follows (3)–(7):
R
n
= R
1
+ R
2
(3)
R
1
= c
m
(NO
3
–
-N)/d (4)
R
2
= c
m
(NH
4
+
-N)/d (5)
c
m
(NO
3
–
-N) = c
1
(NO
3
–
-N) – c
0
(NO
3
–
-N) (6)
c
m
(NH
4
+
-N) = c
1
(NH
4
+
-N) – c
0
(NH
4
+
-N) (7)
where:
R
n
– net N mineralization rate (mg g
–1
·day
–1
),
R
1
– net nitrification rate (mg·g
–1
·day
–1
),
R
2
– net ammonification rate (mg·g
–1
·day
–1
),
d – incubation time (days),
c
m
(NO
3
–
-N) – quantity of mineralized NH
4
+
-N (mg·g
–1
),
c
1
(NO
3
–
-N), c
0
(NO
3
–
-N) – content of NH
4
+
-N (mg·g
–1
)
after and before incubation,
c
m
(NH
4
+
-N) – quantity of mineralized NH
4
+
-N (mg·g
–1
),
c
1
(NH
4
+
-N), c
0
(NH
4
+
-N) – content of NH
4
+
-N (mg·g
–1
)
after and before incubation.
e two-way ANOVA followed by multiple com-
parisons (Duncan’s test) was used to compare the
differences in C and N mineralization indexes
among different moisture and elevation levels, and
the effects of interactions among different factors
were also analysed. e one-way ANOVA followed
by multiple comparisons (Duncan’s) was employed
to compare the differences in soil accumulative
mineralized C of all the 12 treatments. e results
were considered significant when P < 0.05. All data
analyses and equation simulations were performed
using SPSS 16.0 and Origin 8.0.
RESULTS
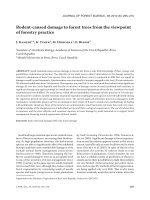
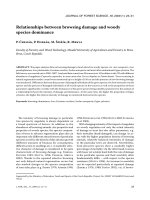
Soil C mineralization rate
Soil C mineralization rates of 6-week incubation
were represented as soil CO
2
released every day
(Fig. 1). During the second day of incubation, a CO
2
flux maximum was observed, and then the soil C
mineralization rates decreased and finally reached
a steady state for all treatments.
e significant values of ANOVA analysis (uni-
variate analysis of GLM program) showed that on
all days of incubation both the soil moisture and
elevation significantly affected the rates of soil C
mineralization during the period of incubation
J. FOR. SCI., 57, 2011 (8): 340–348 343
experiment, the interaction existed only between
moisture and elevation (Table 2).
e results of two-way ANOVA showed that the
differences among 3 moisture levels were significant
every day, whereas those among 4 elevation levels
were significant just at day 1, 2, 7, 14 and 28, and
the moisture-elevation interaction existed only at
day 7, 14, 28 and 35. GLM results also showed that
soil moisture was the most effective factor for daily
rates of soil C mineralization, followed by eleva-
tion, while the moisture-elevation interaction was
the least effective (not shown in this paper). Soil
C mineralization rates increased as soil moisture
rose within soil water contents of 20–60% (g·g
–1
).
CO
2
flux curves for soil moisture treatments of the
same elevation did not cross each other (Fig. 1).
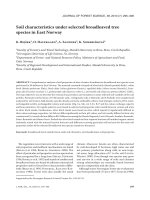
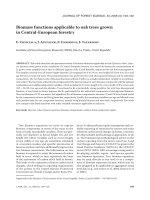
Soil accumulative C mineralization quantity
e results of one-way ANOVA showed that the
differences in the quantity of soil accumulative C min-
eralization among all the 12 treatments were signifi-
cant. In our incubation experiment, moisture was the
key factor controlling soil C mineralization (Fig.2).
For each of the four soils at different elevations
(with their corresponding vegetation types), the
treatments with 60% soil water content (g·g
–1
) ac-
50
100
150
200
250
300
350
400
450
1 2 4 7 14 21 28 35 42
0
50
100
150
200
250
300
350
400
1247 14 21 28 35 42
C*
Ca*
C
Ca*
Ca*
CCa
Ca
B
B*
Ba*
B
Ba*
Ba*
B
Ba
Ba
A
A*
Aa*
A
Aa*
Aa*
A
Aa
800 – 20%
800 – 40%
800 – 60%
Aa
A
B
CC*Cbc*
C
Cb*
Cb*
C
Cb
Cb
B
B*
Bbc*
B
Bb*
Bb*
B
Bb
Bb
A
A*
Abc*
A
Ab*
Ab*
A
Ab
Ab
1,600 – 20%
1,600 – 40%
1,600 – 60%
C
CC*
Cb*
C
Cbc*
Cb*
C
Cb
Cc
C
B
B*
Bb*
B
Bbc*
Bb*
B
Bb
Bc
A
A*
Ab*
A
Abc*
Ab*
A
Ab
Ac
Soil C mineralization (CO
2
mg·kg
–1
·day
–1
)
Days of incubation
1,800 – 20%
1,800 – 40%
1,800 – 60%
D
C
C*
Cc*
Cc
C
Cc*
Cc*
C
Cc
B
B*
Bc*
B
Bc*
Bc*
B
Bc
Bc
A
A*
Ac*
A
Ac*
Ac*
A
Ac
Ac
Days of incubation
2,000 – 20%
2,000 – 40%
2,000 – 60%
0
Fig. 1. e effect of soil moisture on rates of soil C mineralization by elevation and soil moisture level on Changbai
Mountain in NE China
Elevation (m): A: 800; B: 1,600; C: 1,800; D: 2,000; Soil moisture levels: 20%; 40%; 60%
e error bars represent the standard deviation values of three replications for each treatment; capital letter values are
Duncan groups of the factor elevation; small letter values are Duncan groups of the factor soil moisture; the symbol ”*”
means that the moisture-elevation interaction is significant
Table 2. Significance of the values of ANOVA analysis for C mineralization
Day Moisture Elevation Day × Moisture Day × Elevation Moisture × Elevation Day × Moisture × Elevation
* * * ns ns * ns
ns – not significant; *significant
344 J. FOR. SCI., 57, 2011 (8): 340–348
cumulated more mineralized C than the others,
while those with 20% soil water content (g·g
-1
) ac-
cumulated the lowest quantity of mineralized C
(Fig. 2). However the trend was not consistent at
each moisture level. At soil moisture of 40% (g·g
–1
)
and 60% (g·g
–1
), C mineralization quantities of
soils from 800 m were higher than those of soils
form 2,000 m. But it was not the case when the soil
moisture was very low [20% (g·g
–1
)]. e accumula-
tive C mineralization curves of soils form 1,600 m
and 1,800 m overlapped partially at moisture levels
of 20% (g·g
–1
) and 40% (g·g
–1
), whereas they were
clearly separated at soil moisture of 60% (g·g
–1
).
Soil C mineralization simulation
For a given elevation and its associated vegeta-
tion type, potential mineralizable C (C
0
) increased
with an increase in soil water content (Table 3).
To some extent, C
0
was also affected by the eleva-
tion or vegetation type. For example, C
0
decreased
as the elevation increased at soil water content of
40%, while the C
0
difference of soils at the elevation
of 1,600 m and 1,800 m was not significant. How-
ever, this trend was not suitable for C
0
at water con-
tents of 20% and 60%. At 20% water content, as the
elevation increased, C
0
increased initially, then it
0 7 14 21 28 35 42 49
0
200
400
600
800
1,000
1,200
1,400
1,600
e
de
de
de
de
cd
c
bc
ab
ab
a
Soil accumulative mineralized C (CO
2
-C mg·kg
–1
)
Days of incubation
200,020
180,020
160,020
80,020
200,040
180,040
160,040
80,040
200,060
180,060
160,060
80,060
a
Fig. 2. e effect of soil moisture on the
quantities of soil accumulative mineral-
ized C
The error bars represent the standard
deviation values of three replications for
each treatment; the letters behind each
curve are Duncan groups of all the 12 soil
accumulative mineralized C curves
Table 3. Results of soil C mineralization simulations
Elevation (m) – soil
water content (%)
C
0
k C
0
k R
2
800 – 20 317.03 ± 15.29
Aa
* 0.052 ± 0.009
a
* 16.51 ± 3.45
Aa
* 0.994 ± 0.003
800 – 40 961.40 ± 16.97
Ba
* 0.071 ± 0.005
a
* 68.55 ± 3.66
Ba
* 0.999 ± 0.001
800 – 60 1,377.17 ± 49.39
Ca
* 0.063 ± 0.002
a
* 89.98 ± 10.01
Ca
* 0.997 ± 0.003
1,600 – 20 396.88 ± 20.57
Ab
* 0.063 ± 0.008
a
* 25.03 ± 2.06
Ab
* 0.997 ± 0.002
1,600 – 40 729.73 ± 60.35
Bb
* 0.060 ± 0.011
a
* 43.82 ± 11.46
Bb
* 0.998 ± 0.001
1,600 – 60 1,293.54 ± 45.24
Cb
* 0.060 ± 0.002
a
* 78.04 ± 0.89
Cb
* 0.995 ± 0.003
1,800 – 20 396.94 ± 11.34
Ac
* 0.058 ± 0.011
a
* 23.11 ± 4.85
Ab
* 0.997 ± 0.0001
1,800 – 40 712.92 ± 14.11
Bc
* 0.068 ± 0.011
a
* 48.91 ± 8.58
Bb
* 0.999 ± 0.001
1,800 – 60 1,124.75 ± 28.17
Cc
* 0.053 ± 0.002
a
* 59.37 ± 3.97
Cb
* 0.997 ± 0.001
2,000 – 20 272.88 ± 11.05
Ac
* 0.057 ± 0.008
b
* 15.40 ± 1.60
Ac
* 0.993 ± 0.001
2,000 – 40 633.74 ± 48.25
Bc
* 0.044 ± 0.007
b
* 27.72 ± 2.99
Bc
* 0.995 ± 0.004
2,000 – 60 1,335.65 ± 26.47
Cc
* 0.048 ± 0.005
b
* 63.71 ± 4.91
Cc
* 0.997 ± 0.001
e values behind “±” are the standard deviations of three replications for each treatment; capital letter values are Duncan
groups of the factor elevation (the same values represent a Duncan group ); small letter values are Duncan groups of the
factor soil moisture (the same values represent a Duncan group ); the symbol “*” means that the moisture-elevation inter-
action is significant
J. FOR. SCI., 57, 2011 (8): 340–348 345
kept stable and finally it decreased at the elevation
of 2,000 m. At 60% water content, the trend was a
decrease at first, then it kept stable and increased
at the elevation of 2,000 m. Elevations of 800 and
2,000 were the source of differences in C
0
, k and
C
0
k (Table 3).
e change of the potential rate of initial C min-
eralization (C
0
k) was similar to C
0
, which is con-
trolled by soil moisture, and affected by elevation
or vegetation type to some extent. Although the
moisture significantly affected C
0
and C
0
k, its ef-
fect on the constant of C mineralization rate (k)
was not significant, while differences among 4 el-
evations were significant. C mineralization rates
of soils with low moisture changed less than those
with high moisture. Based on their effects on k and
C
0
k, the 4 elevation levels could be divided into
3groups, i.e. 800 m, 1,600–1,800 m, and 2,000 m.
e moisture-elevation interaction existed in C
0
, k
and C
0
k, but its effects were smaller than those of
moisture or elevation except for k (Table 3).
Soil N mineralization rate
Net N, NH
4
+
-N and NO
3
–
-N increased as a result of
the incubation experiment, which agreed with the
results of L et al. (1995). Generally, both quanti-
ties and rates of NH
4
+
-N mineralization were higher
than those of NO
3
–
-N for each treatment. Soil mois-
ture affected N mineralization significantly. For a
given vegetation type, both quantities and rates of
soil net N, NH
4
+
-N and NO
3
–
-N increased as the soil
moisture increased (Table 4).
DISCUSSION AND CONCLUSION
Soil C mineralization
e CO
2
flux maximums on the second day of
the incubation period agree with the results of in-
cubation experiment in a study of CO
2
emissions
from Ultisol in mid-subtropical China (I et
al. 2009). Considering the existence of active and
slow pools for soil organic carbon (SOC) (Z
et al. 2007), we prudently attributed the rapidly re-
leased CO
2
of the early incubation stages to the ac-
tive SOC pool. C mineralization gradually slowed
down to the point of a virtual steady state, because
the slow SOC pool dominated the mineralization
process as the active one was exhausted.
e relationship between soil moisture and C
mineralization was reflected in an increase in the
Table 4. e Effect of soil moisture on soil N mineralization
Elevation (m) – soil
water content (%)
c
m
(NO
3
–
-N) c
m
(NH
4
+
-N) R
1
R
2
R
n
(mg·g
–1
) (mg·g
–1
·day
–1
)
800–20 0.033 ± 0.00082
Aa
* 1.941 ± 0.038
Aa
0.00076 ± 1.91E-5
Aa
* 0.046 ± 0.0009
Aa
0.046 ± 0.00086
Aa
800–40 0.054 ± 0.00046
Ba
* 2.956 ± 0.152
Ba
0.0012 ± 1.07E-5
Ba
* 0.067 ± 0.0035
Ba
0.070 ± 0.0035
Ba
800–60 0.097 ± 0.00464
Ca
* 4.164 ± 0.252
Ca
0.0023 ± 0.00011
Ca
* 0.097 ± 0.0059
Ca
0.099 ± 0.0058
Ca
1600–20 0.026 ± 0.0075
Ab
* 1.985 ± 0.30
Aa
0.00060 ± 0.00017
Ab
* 0.051 ± 0.0070
Aa
0.047 ± 0.0068
Aa
1600–40 0.047 ± 0.0033
Bb
* 2.870 ± 0.21
Ba
0.0011 ± 7.88E-5
Bb
* 0.065 ± 0.0049
Ba
0.068 ± 0.0048
Ba
1600–60 0.079 ± 0.0023
Cb
* 4.170 ± 0.49
Ca
0.0018 ± 5.44E-5
Cb
* 0.096 ± 0.0023
Ca
0.099 ± 0.011
Ca
1800–20 0.026 ± 0.0036
Ac
* 2.207 ± 0.039
Aa
0.00060 ± 8.34E-5
Ac
* 0.029 ± 0.0009
Aa
0.052 ± 0.00082
Aa
1800–40 0.032 ± 0.00015
Bc
* 2.782 ± 0.013
Ba
0.00075 ± 3.40E-6
Bc
* 0.039 ± 0.0003
Ba
0.065 ± 0.00030
Ba
1800–60 0.054 ± 0.0020
Cc
* 4.149 ± 0.44
Ca
0.0012 ± 4.59E-5
Cc
* 0.063 ± 0.010
Ca
0.098 ± 0.010
Ca
2000–20 0.037 ± 0.0014
Aa
* 1.257 ± 0.076
Ab
0.00085 ± 3.31E-5
Aa
* 0.045 ± 0.0018
Ab
0.030 ± 0.0018
Ab
2000–40 0.055 ± 0.0011
Ba
* 1.680 ± 0.0082
Bb
0.0013 ± 2.66E-5
Ba
* 0.069 ± 0.00020
Bb
0.040 ± 0.00022
Bb
2000–60 0.090 ± 0.0059
Ca
* 2.724 ± 0.037
Cb
0.0021 ± 0.00014
Ca
* 0.097 ± 0.00086
Cb
0.065 ± 0.00073
Cb
R
1
– net nitrification rate; R
2
– net ammonification rate; R
3
– net N mineralization rate
e values behind “±” are the standard deviations of three replications for each treatment; capital letter values are Duncan
groups of the factor elevation (the same values represent a Duncan group); small letter values are Duncan groups of the
factor soil moisture (the same values represent a Duncan group); the symbol “*” means that the moisture-elevation inter-
action is significant
346 J. FOR. SCI., 57, 2011 (8): 340–348
rate of the latter as the water content rose within
a specific moisture range, whereas higher or lower
soil moisture levels would inhibit C mineralization
(W et al. 2003).
e average field water content of soils on Chang-
bai Mountain was found to be 60% (Z, O-
2001), and the inhibition water content level
was approximately 20% (L, F 1997). Our data
showed that within this moderate moisture regime,
both the rate and the quantity of soil C mineraliza-
tion increased with increasing moisture for soils of
a given elevation/vegetation type. (Figs. 1 and 2).
is agrees with W et al. (2003). Since a 20%
moisture level was closer to the inhibition level,
treatments with 20% water content did not change
very much during the 42-day incubation period.
Elevation and associated vegetation type partially
influenced soil C mineralization, since the latter
was strongly regulated by the activity of soil mi-
crobial activity, which was affected by soil pH, soil
texture and other factors influencing the soil nutri-
ent status (G, G 2002). Generally, low pH
contributed to lower C mineralization. Our data
showed a similar trend (Table 1, Figs. 1 and 2). But
the relationship between soil C mineralization and
elevation was not exact, suggesting that the regu-
lation process of C mineralization is complex and
might be co-regulated by other factors such as SOC
and total N content of soils (G, G 2002).
At the end of the incubation experiment, the quan-
tities of accumulative C mineralization varied from
229.52 to 1358.39 CO
2
-C mg·kg
–1
(Fig.2), which is
within the previously reported ranges (Z et
al. 2005; W et al. 2007). Potential mineralizable
C (C
0
) and potential rate of initial C mineralization
(C
0
k) were also controlled by soil moisture for a giv-
en elevation/vegetation type in this study. is may
be due to the fact that the soil water content could
alter microbial conditions and ultimately affect C
0
and C
0
k. According to the effect on k and C
0
k, we
divided the 4 elevation levels into 3 groups 800 m,
1,600–1,800 m and 2,000 m, which was similar to the
groups of soil organic matter of those 4 elevations
(Table 1). e partial influence of elevation and as-
sociated vegetation type and the effect of moisture-
elevation interaction on C
0
and C
0
k indicated that
the environmental effect on C
0
and C
0
k was complex
and deserves further study in the future.
Soil N mineralization
Most of the previous studies showed that NH
4
+
-N
and NO
3
–
-N increased during the incubation pe-
riod (L et al. 1995; Z, O 2001). Our
data agreed with those results. Comparatively,
the quantities of mineralized NH
4
+
-N were higher
than those of NO
3
–
-N in this paper (Table 4), which
agreed with the studies of Z et al. (2001), who
indicated that the main source of inorganic N was
NH
4
+
-N for forests on Changbai Mountain. Our
data showed a positive correlation between soil
moisture and soil N mineralization, which agreed
with most of the previous studies that soil N min-
eralization was determined by soil moisture (L et
al. 1995; Z, O 2001).
Some previous reports argued that the soil N
mineralization rate increased as the elevation rose
(H, P et al. 1995; Z et al. 2008).
However, those studies were mainly limited in field
research and the temperature of different elevations
often dominated the mineralization process in those
studies. Our data of laboratory studies showed that
the elevation partially affected N mineralization but
without a clear pattern, because instead of the tem-
perature the soil moisture became a dominant fac-
tor for N mineralization in this paper. On the other
hand, soil N mineralization was related to soil pH,
since the optimum pH for nitrification microbes was
about 8.0 (R 1963). Net N mineralization
rates generally decreased as the elevation increased
and soil pH decreased. e moisture-elevation in-
teraction affected mainly NO
3
–
-N mineralization
rate, maybe NO
3
–
-N was more sensitive to environ-
mental factors. However, the difference in N miner-
alization between forests and Alpine tundra demon-
strated that plants, especially trees, may indirectly
influence soil N mineralization. Z and O
(2001) found that within water content of 46–54%,
the N mineralization rates increased as moistures
rose for two types of soils on Changbai Mountain.
Z et al. (2008) reported that N mineraliza-
tion quantities increased as elevations rose for soils
on Tatachia, Taiwan. erefore, soil moisture and
elevation might influence the soil N mineralization
significantly. However, our study showed that soil N
mineralization was determined by soil moisture, and
elevation was an indirect factor that might impact
soil N mineralization through different moisture
and pH levels.
Our experiment demonstrated that soil C and N
mineralization is strongly impacted by soil mois-
ture during the 42-day incubation experiment
while temperature is maintained at 20°C. For the
given vegetation type of Changbai Mountain, soil C
and N mineralization rate, potential mineralizable
C (C
0
) and potential rate of initial C mineralization
(C
0
k) all increased as the soil moisture rose. Both
J. FOR. SCI., 57, 2011 (8): 340–348 347
NH
4
+
-N and NO
3
–
-N increased after the incubation
experiment. Comparably, both quantities and rates
of NH
4
+
-N mineralization were higher than those of
NO
3
–
-N for each soil moisture treatment. Elevation or
vegetation type partially affected rates of soil C and N
mineralization. According to the effect on k and C
0
k,
the 4 elevation levels could be divided into 3 groups,
i.e. 800 m, 1,600–1,800 m, and 2,000 m. By the effect
on net N mineralization rate, the 4 elevation levels
could be divided into 2 groups, i.e. forests (elevation
800–1,800 m) and Alpine tundra (elevation 2,000 m).
e moisture-elevation interaction significantly af-
fected soil C and NO
3
–
-N mineralization, but the ef-
fect on NH
4
+
-N mineralization was not significant.
e complex mechanisms of soil C and N mineraliza-
tion of Changbai Mountain should be investigated by
our continued studies in the future.
Acknowledgements
We would like to thank Dr. B J. L at
University of Missouri for editing assistance.
Reference
A R., D H. (1994): Nitrogen use efficiency of
Carex species in relation to nitrogen supply. Ecology, 75:
2362–2372.
B F., H J.S., S K., K P., S T.
(2009): Pedogenesis, permafrost, and soil moisture as con-
trolling factors for soil nitrogen and carbon contents across
the Tibetan Plateau. Global Change Biology, 15: 3001–3017.
B K., D R.A., K J. (2006): Increased N
availability in grassland soils modifies their microbial com-
munities and decreases the abundance of arbuscular myc-
orrhizal fungi. Soil Biology & Biochemistry, 38: 1583–1595.
C F.S., S G.R., G A.E., N
K.J., L J.A. (1995): Responses of arctic tundra to
experimental and observed changes in climate. Ecology,
76: 694–711.
C Z.W., Z F.S., L X.Y. (1981): e primary study on
water-heat conditions of forest ecosystem on northern
slope of Changbai Mountain. Research of Forest Ecosystem,
2: 167–177. (in Chinese)
C B.R., X G.S., D G.F., Z Y.H. (1981): e
main soil groups and their properties of the natural reserve
on northern slope of Changbai Mountain. Research of For-
est Ecosystem, 2: 196–206. (in Chinese)
C L., B S.M., B R.D. (2008): Influence
of disturbance and nitrogen addition on plant and soil
animal diversity in grassland. Soil Biology & Biochemistry,
40: 505–514.
C Z.D. (1986): Ecological distribution of soil protozoa
under coniferous-broad leaved mixed forest in northern
slope of Changbai Mountain. Chinese Journal of Ecology,
5: 3–7. (in Chinese)
D L.M., WU G., Z J.Z., K H.M., S G.F., D
H.B. (2002): Carbon cycling of alpine tundra ecosystems on
Changbai Mountain and its comparison with arctic tundra.
Science in China (Series D), 45: 903–910.
D C. J G.W. (2010): Old-growth forests, carbon
and climate change: Functions and management for tall
open-forests in two hotspots of temperate Australia. Plant
Biosystems, 144: 180–193.
D Q., Z G., L J., L S., D H., Z D. (2010):
Responses of soil respiration to elevated carbon dioxide and
nitrogen addition in young subtropical forest ecosystems
in China. Biogeosciences, 7: 315–328.
G S., C K., M M.C., K K.K. (1999):
Influence of inorganic fertilizer sand organic amendments
on soil organic matter and soil microbial properties un-
der tropical conditions. Biology and Fertility of Soils, 29:
196–120.
G L.B., G R.M. (2002): Soil carbon stocks and
land use change: a meta analysis. Global Chang Biology,
8: 345–360.
G Z.L., Z J.P., M Y.D., L Q.K., Y G.R., H S.J.,
F C.N., L W.D. (2006): Researches on litterfall decom-
position rates and model simulating of main species in
various forest vegetations of Changbai Mountains, China.
Acta Ecologica Sinica, 26: 1037–1046.
H S.C., P D.A. (1995): Transferring soils from high-to
low-elevation forests in greases nitrogen cycling rates: Cli-
mate change implication. Global Change Biology, 5: 23–32.
H R.A., W G.M. (1989): Global climatic
change. Scientific American, 260: 36–44.
H S., C F.S., F M.K., F C.B., C-
N.R. (2001): Nitrogen limitation of microbial de-
composition in a grassland under elevated CO
2
. Nature,
409: 188–191.
IPCC (2007): Summary for Policymaker. In: Climate Change
2007: e Physical Science Basis. e 4
th
Assessment Re-
port of the Intergovernmental Panel on Climate Change.
Cambridge University Press, Cambridge and New York.
I J., H R.G., L S., A B., F M.L. (2009):
Carbon dioxide emissions from Ultisol under different land
uses in mid-subtropical China. Geoderma, 152: 63–73.
J C.H., M R.K., F M.C., Schmidt S.K. (1999):
Seasonal partitioning of nitrogen by plants and soil micro-
organisms in an alpine ecosystem. Ecology, 80: 1883–1891.
J D.S., A D.E., W A. (1991): Model es-
timates of CO
2
emissions from soil in response to global
warming. Nature, 351: 304–306.
L B., L S. (2010): Age-structure, urbanization, and
climate change in developed countries: revisiting STIRPAT
for disaggregated population and consumption-related
348 J. FOR. SCI., 57, 2011 (8): 340–348
environmental impacts. Population and Environment,
31: 317–343.
L M.S., M W.H., K H. (2006): Soil respiration of
forest ecosystems in Japan and global implications. Ecologi-
cal Research, 21: 828–839.
L S.H., F J.Y. (1997): Effect factors of soil respiration and
the temperature’s effects on soil respiration in the global
scale. Acta Ecologica Sinica, 17: 469–476. (in Chinese)
L Z.A., W H., Y Z.Y. (1995): e impact of human activi-
ties on the soil nitrogen mineralization in artificial forests.
Chinese Bulletin of Botany, 12: 142–148. (in Chinese)
P S.W., H G.C., B D., P P., H
R.A., B R.A., H L., S E.T., S
R.F., C P. (2001): Consistent land and atmosphere based
U.S. carbon sink estimates. Science, 292: 2316–2320.
R J.W., S W.H. (1992): e global carbon
dioxide flux in soil respiration and its relationship to veg-
etation and climate. Tellus, 44B: 81–99.
R J.W., P C.S. (1995): Global patterns of carbon
dioxide emissions from soils. Global Biogeochemical Cy-
cles, 9: 23–36.
R J.B. (1963): Nitrification in a New Zealand grass-
land soil. Plant and Soil, 19: 173–183.
R D.S., L G.B., F G. (2004): Minerali-
zation and nitrification patterns at eight northeastern USA
forested research sites. Forest Ecology and Management,
188: 317–335.
S W.H., A J.A. (2000): Soil respiration
and the global carbon cycle. Biogeochemistry, 48(1): 7–20.
W M., J L.Z., L Q.R., L Y.Q. (2003): Effects of soil
temperature and moisture on soil respiration in different
forest types in Changbai Mountain. Chinese Journal of
Applied Ecology, 14: 1234–1238. (in Chinese)
W M., LI Q.R., X D.M., D B.L. (2004): Effects of
soil temperature and soil water content on soil respiration
in three forest types in Changbai Mountain. Journal of
Forestry Research, 15: 113–118.
W C.H., W S.Q., X X.R., Z L., H X.G.
(2006): Temperature and soil moisture interactively affected
soil net N mineralization in temperate grassland in Northern
China. Soil Biology & Biochemistry, 38: 1101–1110.
W Q.K., W S.L., Y X.J., Z J., L Y.X. (2007):
Soil carbon mineralization potential and its effect on soil
active organic carbon in evergreen broadleaved forest and
Chinese fir plantation. Chinese Journal of Ecology, 26:
1918–1923. (in Chinese)
W J., D H.B., W G., H Y.J. (2005): e distribution
of soil carbon and nutrients in alpine tundra ecosystem
on the northern slope of Changbai Mountains. Chinese
Journal of Soil Science, 36: 840–845. (in Chinese)
X Y.Q., L L.H., W Q.B., C Q.S., C W.X. (2007):
e pattern between nitrogen mineralization and grazing
intensities in an Inner Mongolian typical steppe. Plant and
Soil, 300: 289–300.
Y X., X M. (2003): Biodiversity conservation in Chang-
bai Mountain Biosphere Reserve, northeastern China:
status, problem, and strategy. Biodiversity and Conserva-
tion, 12: 883–903.
Z X.H., L L.Q., P G.X. (2007): Topsoil organic
carbon mineralization and CO
2
evolution of three paddy
soils from South China and the temperature dependence.
Journal of Environmental Sciences, 19: 319–326.
Z L.P., Y X.M., D G.Y., J Y. (1992): Funda-
mental characteristics of andisols in Changbai Mountain
and Wudalianchi. Journal of Jilin Agricultural University,
14: 47–54. (in Chinese)
Z H.Y., Z D.S., Z L.D. (1984): Studies on
the biochemical properties of forest soil on northern slope
of Changbai Mountain. Research of Forest Ecosystem, 4:
127–138. (in Chinese)
Z C.P., O H. (2001): Influence of temperature
and moisture on soil nitrogen mineralization under two
types of forest in Changbai Mountain. Chinese Journal of
Applied Ecology, 12: 505–508. (in Chinese)
Z L.S., H J.H., L F.M., H X.G. (2009): Effects of
prescribed burning and seasonal and interannual climate
variation on nitrogen mineralization in a typical steppe in
Inner Mongolia. Soil Biology & Biochemistry, 41: 796–803.
Z S.Y., L G.Q., X M.J., W M.G. (2008): Nitro-
gen mineralization in forest soils varying in elevation. Acta
Pedologica Sinica, 45: 1194–1198. (in Chinese)
Z Y.P., Z X.D., L Q. (2005): Effect of long-term
fertilization on respiration process of mollisols. Chinese
Journal of Applied Ecology, 36: 391–394. ( in Chinese)
Z S.W. (2010): Comparative study on soil properties in
different size forest gaps in broad-leaved Pinus Koriensis
forest of Changbai Mountain. Northeast Normal Univer-
sity, Haerbin. (in Chinese)
Received for publication June 3, 2010
Accepted after corrections May 17, 2011
Corresponding author:
Dr. L D, Institute of Applied Ecology, Chinese Academy of Sciences, 72 Wenhua Road, Shenyang,
110016, P.R. China
e-mail: