Sybex OCA Oracle 10g Administration I Study Guide phần 8 pdf
Bạn đang xem bản rút gọn của tài liệu. Xem và tải ngay bản đầy đủ của tài liệu tại đây (2.96 MB, 60 trang )
418
Chapter 8
Managing Consistency and Concurrency
In the following example, you lock the EMPLOYEES and DEPARTMENTS tables at the highest
possible level, EXCLUSIVE:
SQL> lock table hr.employees, hr.departments
2 in exclusive mode;
Table(s) Locked.
Until the transaction with the LOCK statement either commits or rolls back, only queries are
allowed on the EMPLOYEES or DEPARTMENTS tables.
In the sections that follow, we will review the lock modes, as well as show you how to
avoid the lock enqueue process and terminate the command if the requested resource is
already locked.
Lock Modes
Lock modes provide a way for you to specify how much and what kinds of access other users
have on tables that you are using in DML commands. In Table 8.2, you can see the types of
locks that can be obtained at the table level.
Manual lock requests wait in the same queue as implicit locks and are satisfied in a first in,
first out (FIFO) manner as each request releases the lock with either an implicit or explicit
COMMIT or ROLLBACK.
TABLE 8.2 Table Lock Modes
Table Lock Mode Description
ROW SHARE Permits concurrent access to the locked table, but prohibits other
users from locking the entire table for exclusive access.
ROW EXCLUSIVE Same as ROW SHARE, but also prohibits locking in SHARE mode. This type
of lock is obtained automatically with standard DML commands such
as UPDATE, INSERT, or DELETE.
SHARE Permits concurrent queries but prohibits updates to the table; this
mode is required to create an index on a table and is automatically
obtained when using the CREATE INDEX statement.
SHARE ROW EXCLUSIVE Used to query a whole table and to allow other users to query the
table, but to prevent other users from locking the table in SHARE mode
or updating rows.
EXCLUSIVE The most restrictive locking mode; permits queries on the locked table
but prohibits any DML by any other users. This mode is required to
drop the table and is automatically obtained when using the DROP
TABLE statement.
4367.book Page 418 Monday, October 4, 2004 2:19 PM
Monitoring Locking and Resolving Lock Conflicts
419
You can explicitly obtain locks on individual rows by using the SELECT … FOR UPDATE state-
ment, as you can see in the following example:
SQL> select * from hr.employees
2 where manager_id = 100
3 for update;
This query not only shows the rows that satisfy the query conditions, it also locks the selected
rows and prevents other transactions from locking or updating these rows until a COMMIT or a
ROLLBACK occurs.
NOWAIT Mode
Using NOWAIT in a LOCK TABLE statement returns control to the user immediately if any locks
already exist on the requested resource, as you can see in the following example:
SQL> lock table hr.employees
2 in share row exclusive mode
3 nowait;
lock table hr.employees
*
ERROR at line 1:
ORA-00054: resource busy and acquire with NOWAIT specified
SQL>
This is especially useful in a PL/SQL application if an alternate execution path can be fol-
lowed if the requested resource is not yet available. NOWAIT can also be used in the SELECT … FOR
UPDATE statement.
Detecting and Resolving Lock Conflicts
Although locks are a common and sometimes unavoidable occurrence in many databases, they
are usually resolved by waiting in the queue. In some cases, you may need to resolve the lock
problem manually (for example, if a user makes an update at 4:59
P.M. and does not perform
a COMMIT before leaving for the day).
In the next few sections, we will describe in more detail some of the reasons that lock con-
flicts occur and how to detect lock conflicts and discuss a more specific and serious type of lock
conflict: a deadlock.
Understanding Lock Conflicts
In addition to the proverbial user who makes a change at 4:59 P.M. and forgets to perform a COMMIT
before leaving for the day, other more typical lock conflicts are caused by long-running transactions
that perform hundreds, thousands, or even hundreds of thousands of DML commands in the
4367.book Page 419 Monday, October 4, 2004 2:19 PM
420
Chapter 8
Managing Consistency and Concurrency
overnight batch run but are not finished updating the tables when the normal business day starts.
The uncommitted transactions from the overnight batch jobs may lock tables that need to be
updated by clerical staff during the business day, causing a lock conflict.
Another typical cause of lock conflicts is using unnecessarily high locking levels. In the side-
bar “Packaged Applications and Locking” earlier in this chapter, we described a third-party
application that routinely locked resources at the table level instead of at the row level to be
compatible with every SQL-based database on the market. Developers may unnecessarily code
updates to tables with higher locking levels than required by Oracle 10g.
Detecting Lock Conflicts
Detecting locks in Oracle 10g using the EM Database Control makes your job easy; no need to
query against V$SESSION, V$TRANSACTION, V$LOCK, and V$LOCKED_OBJECT to see who is lock-
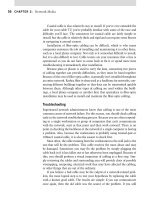
ing what resource. In Figure 8.5, you can see the tables locked by the user SCOTT after executing
the following statement:
SQL> lock table hr.employees, hr.departments
2 in exclusive mode;
Table(s) Locked.
FIGURE 8.5 The Database Locks screen in EM Database Control
4367.book Page 420 Monday, October 4, 2004 2:19 PM
Monitoring Locking and Resolving Lock Conflicts
421
SCOTT has an EXCLUSIVE lock on both the EMPLOYEES and DEPARTMENTS table. You can drill
down on the locked object by clicking one of the links in the Object Name column; similarly,
you can review other information about SCOTT’s session by clicking one of the links in the Ses-
sion ID column.
Understanding and Resolving Deadlocks
Resolving a lock conflict, the user can either COMMIT or ROLLBACK the current transaction. If you
cannot contact the user and it is an emergency, you can select the session holding the lock, and
click the Kill Session button in the Database Locks screen of the EM Database Control (refer to
Figure 8.5, earlier in this chapter). The next time the user whose session has been killed tries
to execute a command, the error message ORA-00028: Your session has been killed is
returned. Again, this is an option of last resort: all the statements executed in the session since the
last COMMIT are lost.
User Education, Locking, and Error Messages
Some of our users who updated their tables using the SQL> command prompt instead of the appli-
cation would come back from lunch, try to continue their work, and find that they had received an
ORA-00028: Your session has been killed error message, which usually initiated a heated dis-
cussion with the DBA about lost work due to their session being canceled without notice.
At first, the users thought that the DBA group was either cleaning up unused connections man-
ually or that a new automatic resource management policy was in place, because the details for
this error message did not explain why the session was cancelled:
Cause A privileged user has killed your session and you are no longer logged on to the database.
Action Log in again if you want to continue working.
As it turns out, the users were not always performing a COMMIT before they left for lunch; the other
users who were trying to finish their work could not complete their updates because the rows of
the tables were still locked in a transaction that had not yet been committed. They called the DBA,
who identified the locking sessions and canceled them, generating the ORA-0002 message for
the canceled session.
Oracle error messages are not always clear, and the detailed description of the error message
doesn’t always help, but at least it provides a starting point for investigating a problem. Make sure
that the users can access the Oracle error messages, either via the Internet at www.oracle.com or via
an internal shared directory containing all the Oracle documentation for the installation options at
your site.
4367.book Page 421 Monday, October 4, 2004 2:19 PM
422
Chapter 8
Managing Consistency and Concurrency
A more serious type of lock conflict is a deadlock. A deadlock is a special type of lock con-
flict in which two or more users are waiting for a resource locked by the other users. As a
result, neither transaction can complete without some kind of intervention: the session that
first detects a deadlock rolls back the statement waiting on the resource with the error mes-
sage ORA-00060: Deadlock detected while waiting for resource.
In Table 8.3, two sessions are attempting to update a row locked by the other session.
After the error message is issued at 11:45, the second UPDATE for Session 1 does not succeed;
however, the second UPDATE for Session 2 completes, and the user in Session 2 can now submit
another DML statement or issue a COMMIT or ROLLBACK. The user in Session 1 will have to re-
issue the second UPDATE.
Summary
In this chapter, we presented the undo tablespace and its importance for the two types of database
users: those who want to query a table and receive consistent results, and those who want to make
changes to a table and have the option to roll back the data to its state when the transaction
started. The undo tablespace provides undo information, or the value of rows in a table before
changes were made, for both classes of users. More specifically, undo data facilitates rollback
operations, read consistency, certain database recovery operations, and several types of flashback
features, some of which were introduced in Oracle9i and greatly expanded in Oracle 10g.
An undo tablespace can be configured with a handful of initialization parameters: UNDO_
MANAGEMENT to define the mode in which undo is managed, with values of either MANUAL or AUTO.
The UNDO_TABLESPACE parameter identifies the current undo tablespace, which can be switched
while the database is open to users; however, only one undo tablespace can be active at a time.
You can use the EM Database Control to both proactively monitor and resize the undo
tablespace, before you get the phone call from the user whose transactions are failing or SELECT
statements are not completing. For databases whose long-running queries have priority over
successful DML transactions, you can specify that an undo tablespace retain expired undo
information at the expense of failed transactions.
TABLE 8.3 Deadlock Scenario
Session 1 Time Session 2
update employees set salary = salary *
1.2 where employee_id = 102;
11:29 update employees set manager = 100
where employee_id = 109;
update employees set salary = salary *
1.2 where employee_id = 109;
11:44 update employees set manager = 100
where employee_id = 102;
ORA-00060: Deadlock detected while
waiting for resource
11:45 Control returns to user
4367.book Page 422 Monday, October 4, 2004 2:19 PM
Exam Essentials
423
In the second part of the chapter, we showed you how to monitor resource locks within a
transaction, both at the row level and the table level. Although Oracle usually manages locks at
the minimum level to ensure that two sessions do not try to simultaneously update the same row
in a table, you can explicitly lock a table at a number of levels. In addition, you can lock a subset
of rows in a table to prevent updates or locks from other transactions with the FOR UPDATE
clause in the SELECT statement.
Finally, we presented some reasons that lock conflicts occur and how to resolve them; a spe-
cial kind of lock conflict, called a deadlock, occurs when two users are waiting on a resource
locked by the other user. Deadlocks, unlike other types of lock conflicts, are resolved quickly
and automatically by Oracle long before any manual lock resolution is attempted.
Exam Essentials
Know the purpose of the Undo Advisor. Optimize the UNDO_RETENTION parameter as well
as the size of the undo tablespace by using Undo Advisor. Use the graph on the Undo Advisor
screen to perform what-if analyses given the undo retention requirements.
Be able to monitor locking and resolve lock conflicts. Identify the reasons for database lock
conflicts, and explain how to resolve them. Show an example of a more serious type of lock con-
flict, a deadlock.
List the features supported by undo data in an undo tablespace. Enumerate the four primary
uses for undo data: rollback, read consistency, database recovery, and flashback operations.
Show how the rollback requirements for users that perform long transactions can interfere with
read consistency required for query users. Be able to identify and use the method to preserve
expired undo at the expense of transactions.
Summarize the steps for monitoring, configuring, and administering the undo tablespace. Set the
initialization parameters required to use an undo tablespace. Be able to review the status of the undo
tablespace using EM Database Control, and use the Undo Advisor to resize the undo tablespace
when conditions warrant it. Alter the initialization parameter UNDO_RETENTION to configure how
long undo information needs to be retained for long-running queries.
List the types of lock modes available when locking a table. Identify the locks available,
from least restrictive to most restrictive. Be able to request a lock with either a LOCK or SELECT
statement and return immediately if the lock is not available.
4367.book Page 423 Monday, October 4, 2004 2:19 PM
424
Chapter 8
Managing Consistency and Concurrency
Review Questions
1. What will be the salary of employee number 189 at the completion of the following SQL statements?
update emp set salary = 1000 where employee_num = 189;
savepoint save_1;
update emp set salary = salary * 1.1 where employee_num = 189;
savepoint save_2;
update emp set salary = salary * 1.1 where employee_num = 189;
savepoint save_3;
rollback to savepoint save_2;
commit;
update emp set salary = 1500 where employee_num = 189;
savepoint save_4;
rollback to save_4;
commit;
A. 1000
B. 1100
C. 1111
D. 1500
2. Which of the following commands returns an error if the transaction starts with SET TRANSACTION
READ ONLY?
A. ALTER SYSTEM
B. SELECT
C. ALTER USER
D. SET ROLE
3. Which of the following commands is most likely to generate an error message? (Choose two.)
A. ALTER SYSTEM SET UNDO_MANAGEMENT=AUTO SCOPE=MEMORY;
B. ALTER SYSTEM SET UNDO_MANAGEMENT=AUTO SCOPE=SPFILE;
C. ALTER SYSTEM SET UNDO_MANAGEMENT=MANUAL SCOPE=MEMORY;
D. ALTER SYSTEM SET UNDO_MANAGEMENT=MANUAL SCOPE=SPFILE;
E. ALTER SYSTEM SET UNDO_TABLESPACE=RBS1 SCOPE=BOTH;
4. Guaranteed undo retention can be specified for which of the following objects?
A. A tablespace
B. A table
C. The database
D. A transaction
E. The instance
4367.book Page 424 Monday, October 4, 2004 2:19 PM
Review Questions
425
5. Which dynamic performance view can help you adjust the size of an undo tablespace?
A. V$UNDOSTAT
B. V$ROLLSTAT
C. V$SESSION
D. V$ROLLNAME
6. Which of the following lock modes permits concurrent queries on a table but prohibits updates
to the locked table?
A. ROW SHARE
B. ROW EXCLUSIVE
C. EXCLUSIVE
D. SHARE ROW EXCLUSIVE
E. SHARE
7. The highest level at which a user can request a lock is the ________ level.
A. Schema
B. Table
C. Row
D. Block
8. In the following scenario, two different transactions are updating rows in the same table. What
happens at 11:45? (Choose the best answer.)
A. One of the users calls the DBA who immediately kills one of the sessions holding the lock.
B. The transactions in both Session 1 and Session 2 are both rolled back after both sessions
receive an ORA-00060: Deadlock detected while waiting for resource message, and
the statements in both transactions must be re-executed, but no other work is lost.
C. Both Session 1 and Session 2 are killed by Oracle with an ORA-00028: Your session has
been killed message and must redo all other statements executed since the last COMMIT.
D. Session 1 generates an ORA-00060: Deadlock detected while waiting for resource
message and rolls back the transaction. The user in Session 2 is then free to roll back or com-
mit their transaction.
Session 1 Time Session 2
update employees set salary =
salary * 1.2 where employee_id
= 102;
11:29 update employees set manager =
100 where employee_id = 109;
update employees set salary =
salary * 1.2 where employee_id
= 109;
11:44 update employees set manager =
100 where employee_id = 102;
? 11:45 ?
4367.book Page 425 Monday, October 4, 2004 2:19 PM
426
Chapter 8
Managing Consistency and Concurrency
9. To retrieve the rollback segment name assigned to a transaction, you can join the dynamic per-
formance view V$TRANSACTION to which other dynamic performance view?
A. V$ROLLSTAT
B. V$ROLLNAME
C. V$UNDOSTAT
D. V$TRANSACTION_ENQUEUE
10. Select the statement that is not true regarding undo tablespaces.
A. Undo tablespaces will not be created if they are not specified in the CREATE DATABASE command.
B. Two undo tablespaces can be active if a new undo tablespace was specified and the old one
contains pending transactions.
C. You can switch from one undo tablespace to another while the database is online.
D. UNDO_MANAGEMENT cannot be changed dynamically while the instance is running.
11. To resolve a lock conflict, which of the following methods can you use? (Choose two.)
A. Oracle automatically resolves the lock after a short but predefined time period by killing the
session that is holding the lock.
B. The DBA can kill the session holding the lock.
C. The user can either roll back or commit the transaction that is holding the lock.
D. Oracle automatically resolves the lock after a short but predefined period by killing the ses-
sion that is requesting the lock.
12. If all extents in an undo segment fill up, which of the following occurs next? (Choose all that apply.)
A. A new extent is allocated in the undo segment if all existing extents still contain active trans-
action data.
B. Other transactions using the segment are moved to another existing segment with enough
free space.
C. A new undo segment is created, and the transaction that filled up the undo segment is moved
in its entirety to another undo segment.
D. The first extent in the segment is reused if the undo data in the first extent is not needed.
E. The transaction that filled up the undo segment spills over to another undo segment.
13. Which of the following commands returns control to the user immediately if a table is already
locked by another user?
A. LOCK TABLE HR.EMPLOYEES IN EXCLUSIVE MODE WAIT DEFERRED;
B. LOCK TABLE HR.EMPLOYEES IN SHARE MODE NOWAIT;
C. LOCK TABLE HR.EMPLOYEES IN SHARE MODE WAIT DISABLED;
D. LOCK TABLE HR.EMPLOYEES IN EXCLUSIVE MODE NOWAIT DEFERRED;
4367.book Page 426 Monday, October 4, 2004 2:19 PM
Review Questions
427
14. Two transactions occur at the wall clock times in the following table. What happens at 10:05?
A. Session 2 will wait for Session 1 to commit or roll back.
B. Session 1 will wait for Session 2 to commit or roll back.
C. A deadlock will occur, and both sessions will hang unless one of the users cancels their state-
ment or the DBA kills one of the sessions.
D. A deadlock will occur, and Oracle will cancel one of the statements.
E. Neither session is updating the same column, so no waiting or deadlock will occur.
15. Undo information falls into all the following categories except for which of the following?
A. Uncommitted undo information
B. Undo information required in case an instance crash requires a roll forward operation when
the instance is restarted
C. Committed undo information required to satisfy the undo retention interval
D. Expired undo information that is no longer needed to support a running transaction
16. Undo segments are owned by which user?
A. SYSTEM
B. The user that initiated the transaction
C. SYS
D. The user that owns the object changed by the transaction
Session 1 Time Session 2
update customer set region = ‘H’
where state=’WI’ and
county=’GRANT’;
9:51
9:59 update customer set mgr=201
where state=’IA’ and
county=’JOHNSON’;
update customer set region=’H’
where state=’IA’ and
county=’JOHNSON’;
10:01
10:05 update customer set mgr=201
where state=’WI’ and
county=’GRANT’;
4367.book Page 427 Monday, October 4, 2004 2:19 PM
428
Chapter 8
Managing Consistency and Concurrency
17. Undo data in an undo tablespace is not used for which of the following purposes?
A. Providing users with read-consistent queries
B. Rolling forward after an instance failure
C. Flashback queries
D. Recovering from a failed transaction
E. Restoring original data when a ROLLBACK is issued
18. Which dynamic performance view shows which transactions are assigned to which undo seg-
ment in the undo tablespace?
A. V$TRANSACTION
B. V$ROLLSTAT
C. V$SESSION
D. V$UNDOSTAT
19. The user SCOTT runs a query at 8:25
A.M. that receives an ORA-01555: Snapshot too old error
after running for 15 minutes. An alert is sent to the DBA that the undo tablespace is incorrectly
sized. At 10:15
A.M., the DBA checks the initialization parameter UNDO_RETENTION, and its value
is 3600; the parameter is sized correctly. The DBA doubles the size of the undo tablespace by add-
ing a second datafile. At 1:15
P.M., the user SCOTT runs the same query and once again receives an
ORA-01555: Snapshot too old error. What happens next? (Choose the best answer.)
A. The DBA receives another alert indicating that the undo tablespace is still undersized.
B. The user SCOTT calls the DBA to report that the query is still failing.
C. The second datafile autoextends so that future queries will have enough undo to complete
when there is concurrent DML activity.
D. Resumable Space Allocation suspends the query until the DBA adds another datafile to the
undo tablespace, and then the query runs to completion.
20. The EM Database Control Undo Advisor screen uses ___________ to recommend the new size
of the undo tablespace.
A. The value of the parameter UNDO_RETENTION
B. The number of Snapshot too old errors
C. The current size of the undo tablespace
D. The desired amount of time to retain undo data
E. The most recent undo generation rate
4367.book Page 428 Monday, October 4, 2004 2:19 PM
Answers to Review Questions
429
Answers to Review Questions
1. D. The last ROLLBACK statement rolls back all DML statements since SAVEPOINT SAVE_4; the
last UPDATE was executed before the SAVEPOINT to SAVE_4, therefore the change made by
the last UPDATE is unchanged, and the salary remains 1500.
2. C. The ALTER USER command changes data, even though it resides in the data dictionary; no
data in a table can be changed in a READ ONLY transaction.
3. A, C. You cannot dynamically change the parameter UNDO_MANAGEMENT after the instance has
started. You can, however, change the UNDO_TABLESPACE parameter to switch to another undo
tablespace while the instance is up and running.
4. A. Guaranteed undo retention can be set at the tablespace level by using the RETENTION
GUARANTEE clause with either the CREATE TABLESPACE or ALTER TABLESPACE command. Only
undo tablespaces can have this attribute.
5. A. When database activity is at its peak, the V$UNDOSTAT view, in conjunction with the value for
UNDO_RETENTION and DB_BLOCK_SIZE, can be used to calculate an optimal undo tablespace
size. Also, the Undo Advisor in the EM Database Control can provide the same optimal
tablespace size in a GUI environment.
6. E. SHARE mode permits concurrent queries but prohibits updates to the locked table. SHARE
mode is required to create an index on the table.
7. B. The highest level at which a user can request a lock is the table level; the only other lock level
available to a user is a row level lock. Users cannot lock at the block or schema level.
8. D. At 11:45, both sessions are waiting for the row locked by the other session. Within a short
but predetermined amount of time, Oracle rolls back the statement that detected the deadlock,
which could be either session and is not dependent on when each of the transactions started or
attempted to update rows locked by other users.
9. B. The column XIDUSN in the view V$TRANSACTION can be joined with the column USN in
V$ROLLNAME to retrieve the column NAME in V$ROLLNAME containing the rollback segment name.
10. A. If an undo tablespace is not explicitly created in the CREATE DATABASE command, Oracle
automatically creates one with the name SYS_UNDOTBS.
11. B, C. Locks are resolved at the user level by either committing or rolling back the transaction
holding the lock. Also, the DBA can kill the session holding the lock as a last resort.
12. A, D. If a transaction fills up an undo segment, either a new extent is allocated for the undo seg-
ment or other extents in the segment are reused if the undo data in those extents is no longer
needed by other transactions using the same undo segment. Transactions cannot cross segment
boundaries in an undo tablespace nor can they move to another segment.
13. B. Regardless of the type of lock requested, NOWAIT is required if you want the command with
the lock request to terminate immediately if a lock is already held on the table.
4367.book Page 429 Monday, October 4, 2004 2:19 PM
430
Chapter 8
Managing Consistency and Concurrency
14. D. At 10:01, Session 1 waits for Session 2. At 10:05, a deadlock will occur; Oracle detects the
deadlock and cancels one of the statements.
15. B. Undo information is required for instance recovery, but only to roll back uncommitted trans-
actions after the online redo logs roll forward.
16. C. Undo segments are always owned by SYS.
17. B. The online redo log files are used to roll forward after an instance failure; undo data is used
to roll back any uncommitted transactions.
18. A. The dynamic performance view V$TRANSACTION contains the column XIDUSN, which is the
undo segment number in the current undo tablespace.
19. B. Even if the size of the undo tablespace is adjusted after an undo space problem, only one alert
is sent for each 24-hour period. Therefore, the only way that the problem will be resolved
promptly is for SCOTT to call the DBA, as the DBA will not receive another alert until the next
day when another query fails.
20. D. The Undo Advisor screen uses the desired time period for undo data retention and analyzes
the impact of the desired undo retention setting.
4367.book Page 430 Monday, October 4, 2004 2:19 PM
Chapter
9
Proactive Database
Maintenance and
Performance
Monitoring
ORACLE DATABASE 10
G
:
ADMINISTRATION I EXAM OBJECTIVES
COVERED IN THIS CHAPTER:
Performance Monitoring
Troubleshoot invalid and unusable objects.
Gather optimizer statistics.
View performance metrics.
React to performance issues.
Proactive Maintenance
Set warning and critical alert thresholds.
Collect and use baseline metrics.
Use tuning and diagnostic advisors.
Use the Automatic Database Diagnostic Monitor (ADDM).
Manage the Automatic Workload Repository.
Describe server generated alerts.
Exam objectives are subject to change at any time
without prior notice and at Oracle’s sole discretion.
Please visit Oracle’s Training and Certification website
(
/>
)
for the most current exam objectives listing.
4367.book Page 431 Monday, October 4, 2004 2:19 PM
Successful database administrators are always on the lookout
for potential database problems that could adversely impact the
availability or performance of the systems they manage. Histori-
cally, DBAs have resorted to third-party monitoring tools, Oracle’s Enterprise Manager suite,
or home-grown SQL scripts to gather, store, and analyze database information.
In Oracle Database 10
g
(Oracle 10
g
), however, several new features allow you to easily col-
lect and analyze database performance statistics and proactively respond to problems when they
are detected in the database. These new features include the Automatic Workload Repository
(AWR), Automated Database Diagnostic Monitoring (ADDM), and the Oracle 10
g
Tuning and
Diagnostic Advisors.
In this chapter, we will look at these features in detail.
Proactive Database Maintenance
You can monitor your systems for management and performance problems in essentially two
ways: reactively and proactively.
Reactive monitoring
involves monitoring a database environment after a performance or
management issue has arisen. For example, you start gathering performance statistics using
third-party tools, Enterprise Manager, or home-grown scripts after users call to tell you that the
system is slow. Obviously, this type of monitoring leaves a lot to be desired, because a problem
has already arisen and the users of the system are already impacted. You can use the techniques
discussed in this chapter for reactive monitoring, but they are most effective when used to per-
form proactive monitoring.
Proactive monitoring
allows you to identify and respond to common database performance
and management issues before, during, or immediately after they occur. Most of the new fea-
tures in Enterprise Manager (EM) Database Control are geared toward proactive monitoring.
The monitoring tools available in EM Database Control collect their information from a
variety of sources (usually the same sources from which your existing third-party tools and
home-grown scripts collect their monitoring information): data dictionary views, dynamic per-
formance views, and the operating system. Oracle 10
g
also makes extensive use of the cost-
based optimizer statistics for its proactive monitoring. All these sources of information are
accessed by the Automatic Workload Repository feature described in the next section.
Automatic Workload Repository
Oracle 10
g
introduces two new background processes—Memory Monitor (MMON) and
Memory Monitor Light (MMNL). These processes work together to collect performance statistics
4367.book Page 432 Monday, October 4, 2004 2:19 PM
Proactive Database Maintenance
433
directly from the System Global Area (SGA). The MMON process does most of the work by
waking up every 60 minutes and gathering statistical information from the data dictionary views,
dynamic performance views, and optimizer and then storing this information in the database.
The tables that store these statistics are called the
Automatic Workload Repository (AWR)
. These
tables are owned by the user
SYSMAN
and are stored in the
SYSAUX
tablespace.
To activate the AWR feature, you must set the PFILE/SPFILE parameter
STATISTICS_LEVEL
to the appropriate value. The values assigned to this parameter determine the depth of the sta-
tistics that the MMON process gathers. Table 9.1 shows the values that can be assigned to the
STATISTICS_LEVEL
parameter.
Once gathered, the statistics are stored in the AWR for a default duration of 7 days. How-
ever, you can modify both the frequency of the snapshots and the duration for which they are
saved in the AWR. One way to modify these intervals is by using the Oracle-supplied package
DBMS_WORKLOAD_REPOSITORY
. The following SQL command shows the
DBMS_WORKLOAD_
REPOSITORY
package being used to change the AWR collection interval to 1 hour and the reten-
tion period to 30 days:
SQL> execute dbms_workload_repository.modify_snapshot_settings
(interval=>60,retention=>43200);
PL/SQL procedure successfully completed.
The 30-day retention value shown above is expressed in minutes: 60 minutes
per hour
×
24 hours per day
×
30 days = 43,200 minutes.
You can also change the AWR collection interval, retention period, and collection depth
using the EM Database Control. Choose Administration
Automatic Workload Repository
Edit on the main screen to open the Edit Settings screen shown in Figure 9.1.
TABLE 9.1
Specifying Statistics Collection Levels
Collection Level Description
BASIC
Disables the AWR and most other diagnostic monitoring and advisory
activities. Few database statistics are gathered at each collection inter-
val when operating the instance in this mode.
TYPICAL
Activates the standard level of collection activity. This is the default
value for AWR and is appropriate for most environments.
ALL
Captures all the statistics gathered by the TYPICAL collection level, plus
the execution plans and timing information from the operating system.
4367.book Page 433 Monday, October 4, 2004 2:19 PM
434
Chapter 9
Proactive Database Maintenance and Performance Monitoring
In Figure 9.1, the retention period for statistics gathered by the MMON process is set to 10 days,
and statistics are collected every 15 minutes. You can also modify the depth at which statistics are
collected by the AWR by clicking the Collection Level link. Clicking this link opens the Initialization
Parameters screen in which you can specify any of the three pre-defined collection levels shown in
Table 9.1. Figure 9.2 shows the AWR collection level being changed from
TYPICAL
to
ALL
.
FIGURE 9.1
Setting AWR statistics collection and retention using EM
FIGURE 9.2
Changing the AWR statistics collection level
4367.book Page 434 Monday, October 4, 2004 2:19 PM
Proactive Database Maintenance
435
Take care when specifying the AWR statistics collection interval. Gathering
snapshots too frequently requires additional space in the
SYSAUX
tablespace
and adds additional database overhead each time the statistics are collected.
Once AWR snapshots are taken and stored in the database, the Automatic Database Diag-
nostic feature uses the statistics as described in the next section.
Automatic Database Diagnostic Monitoring
Following each AWR statistics collection process, the
Automated Database Diagnostic Moni-
toring (ADDM)
feature automatically analyzes the gathered statistics and compares them to the
statistics gathered by the previous two AWR snapshots. By comparing the current statistics to
these two previous snapshots, the ADDM can easily identify potential database problems such
as CPU and I/O bottlenecks, resource-intensive SQL or PL/SQL, lock contention, and the utili-
zation of Oracle’s memory structures within the SGA.
Based on these findings, the ADDM may recommend possible remedies. The goal of these
recommendations is to minimize
DB Time
. DB Time is composed of two types of time measures
for non-idle database users: CPU time and wait time. This information is stored as the cumu-
lative time that all database users have spent either using CPU resources or waiting for access
to resources such as CPU, I/O, or Oracle’s memory structures. High or increasing values for DB
Time indicate that users are requesting increasingly more server resources and may also be expe-
riencing waits for those resources, which can lead to less than optimal performance. In this way,
minimizing DB Time is a much better way to measure overall database performance than
Oracle’s old ratio-based tuning methodologies.
DB Time is calculated by combining all the times from all non-idle user ses-
sions into one number. Therefore, it is possible for the DB Time value to be
larger than the total time that the instance has been running.
Once ADDM completes its comparison of the newly collected statistics to the previously col-
lected statistics, the results are stored in the AWR. You can use these statistics to establish base-
lines against which future performance will be compared, and you can use deviations from these
baseline measures to identify areas that need attention. In this manner, ADDM allows you to
not only better detect and alert yourself to potential management and performance problems in
the database, but also allows you to take corrective actions to rectify those problems quickly
and with little or no manual intervention.
The following sections introduce the interfaces, features, and functionality of ADDM and
explain how you can use this utility to monitor and manage database storage, security, and per-
formance. We’ll begin by examining the EM Database Control tools that you can use to view
the results of ADDM analysis.
Baselines are discussed later in this chapter in the section “ADDM Alerts.”
4367.book Page 435 Monday, October 4, 2004 2:19 PM
436
Chapter 9
Proactive Database Maintenance and Performance Monitoring
Using EM Database Control to View ADDM Analysis
EM Database Control graphically displays the results of the ADDM analysis on several screens,
including:
The Performance Findings link under the Diagnostic Summary section of the EM Database
Control main screen
The Performance tab of the EM Database Control main screen
The ADDM screen located by clicking the Advisor Central link at the bottom of the EM
Database Control main screen
Sample output from each of the EM Database Control screens is shown in the following sections.
The EM Database Control Performance Findings Link
The EM Database Control main screen contains a section called Diagnostic Summary. One of
the links under this section is called Performance Findings. Figure 9.3 shows this section.
The output in Figure 9.3 shows that ADDM discovered 10 performance-related findings.
Clicking the link for these 10 performance findings displays the ADDM summary screen, at the
bottom of which is displayed the Performance Analysis section, as shown in Figure 9.4.
FIGURE 9.3
The Diagnostic Summary section of the EM Database main screen
FIGURE 9.4
The Performance Analysis section of the ADDM Summary
4367.book Page 436 Monday, October 4, 2004 2:19 PM
Proactive Database Maintenance
437
The output in Figure 9.4 shows that the greatest impact to performance is due to bottlenecks
related to disk I/O (described by ADDM as “The throughput of the I/O subsystem was signif-
icantly lower than expected”). By clicking this link, you can view ADDM’s recommendation for
correcting this problem, which is shown in Figure 9.5.
ADDM suggests three options for improving the performance of the I/O on this system:
Stripe and mirror (also known as SAME) all datafiles across multiple disk drives.
Increase the number of physical disk drives.
Consider implementing Oracle’s Automatic Storage Management feature.
The SAME, or Stripe and Mirror Everything, methodology suggested in Fig-
ure 9.5 refers to a database file configuration strategy that is described in this
white paper on the Oracle Technology Network:
/>
deploy/availability/pdf/OOW2000_same_ppt.pdf
.
Figure 9.4 also shows that a large portion of our I/O problems are related to specific database
tables or indexes: “Individual database segments responsible for significant physical I/O were
found.” Clicking this link displays the detailed ADDM findings shown in Figure 9.6.
ADDM has essentially identified the
SALES_HISTORY
table as the source of excessive
I/O and recommends that you run the Segment Advisor utility against this table to generate
recommendations for improving its performance. The Segment Advisor is described later in
this section.
FIGURE 9.5
The ADDM performance finding details for I/O
4367.book Page 437 Monday, October 4, 2004 2:19 PM
438
Chapter 9
Proactive Database Maintenance and Performance Monitoring
FIGURE 9.6
The ADDM performance details for high I/O segments
The EM Database Control Performance Tab
You can also click the Performance tab on the EM Database Control main screen to view per-
formance data collected by AWR and analyzed by ADDM. ADDM uses its findings to populate
the Sessions: Waiting And Working section of the Performance screen, as shown in Figure 9.7.
Using this section of the Performance screen, you can drill down into detailed information in
11 areas that have been identified as having an impact on performance, from User I/O thorough
CPU Used. By clicking the User I/O link, you can drill down into detailed information about
user I/O, as shown in Figure 9.8.
The graph in Figure 9.8 shows the times at which the snapshots were taken along its X axis.
The lines on the graph show which of the events in the graph’s legend experienced the most
activity during that snapshot period. The graph output indicates that most of the user I/O activ-
ity is experiencing waits for the database event “db file scattered read.” This event is caused by
the I/O activity that occurs when Oracle experiences a wait while performing a sequential disk
read of contiguous blocks from a datafile into the buffer cache—usually when a table is being
accessed using a full table scan or fast full index scan.
FIGURE 9.7 Sessions: Waiting And Working section of the Performance screen
4367.book Page 438 Monday, October 4, 2004 2:19 PM
Proactive Database Maintenance
439
FIGURE 9.8 Detailed user I/O information
For a complete listing and description of all database wait events, see Appen-
dix C: Oracle Wait Events of Oracle Database Reference 10g Release 1 (10.1),
Part No. B10755-01.
The Performance screen, shown in Figure 9.9, also contains a Performance Overview section
near the bottom that summarizes, in pie graphs, the top SQL and top session wait events iden-
tified by ADDM.
Clicking the links in the boxes next to either of these graphs displays details about that item.
For example, clicking the link for the SQL statement that experienced the most wait time
(35 percent on the graph) shows the output in Figure 9.10.
The output in Figure 9.10 shows that ADDM identified the SQL statement SELECT
count(*) FROM SALES_HISTORY as experiencing the most waits during processing. Click-
ing the link at the bottom of this same screen allows you to view the execution plan for this
statement.
FIGURE 9.9 The Performance Overview section of the Performance screen
4367.book Page 439 Monday, October 4, 2004 2:19 PM
440
Chapter 9
Proactive Database Maintenance and Performance Monitoring
FIGURE 9.10 Drilling down into the Top Waiting SQL
If the execution plan for this query shows that a full table scan of the 900,000+ row SALES_
HISTORY table is occurring, then you can see how it might experience I/O waits while retrieving
its rows. To view the tuning recommendations that ADDM has generated for this statement,
click the Run SQL Tuning Advisor button at the bottom of the screen.
The SQL Tuning Advisor is described later in this chapter.
The Advisor Central Screen
The Advisor Central screen also contains ADDM findings. The link for the Advisor Central
screen is at the bottom of the EM Database Control main screen. Click this link to display the
Advisor Central screen, the top portion of which is shown in Figure 9.11.
FIGURE 9.11 The Advisor Central screen
4367.book Page 440 Monday, October 4, 2004 2:19 PM
Proactive Database Maintenance
441
Click the ADDM link in the Advisors section of this screen to display a graph, shown in
Figure 9.12, that shows all the recent AWR snapshots taken by the MMON process.
As stated earlier, the ADDM automatically compares the most recent AWR snapshot with
the last two AWR snapshots when formulating its recommendations. However, you can use this
Create ADDM Task screen to manually select any two AWR snapshot times and formulate
ADDM recommendations for activity that occurred between those two points in time. To start
this process, click the Period Start Time radio button and then select a start date and time by
clicking the point in the graph’s timeline that corresponds to the beginning period that you want
to use. Repeat this process to specify the end process time stamp. Figure 9.13 shows that the
start and end time for ADDM analysis have been specified so that they correspond to the two
points in time that surround the spike shown in the graph.
FIGURE 9.12 The Create ADDM Task screen
FIGURE 9.13 Manually setting the ADDM analysis period
4367.book Page 441 Monday, October 4, 2004 2:19 PM
442
Chapter 9
Proactive Database Maintenance and Performance Monitoring
Click OK to analyze the database for possible performance problems between the two spec-
ified points in time.
You can also manually perform an ADDM analysis without the use of EM Data-
base Control by using the addmrpt.sql script located in $ORACLE_HOME/rdbms/
admin on Unix systems and %ORACLE_HOME%\rdbms\admin on Windows systems.
See Chapter 6 of Oracle Database Performance Tuning Guide 10g Release 1
(10.1), Part Number B10752-01, for details on how to use this script.
The results of this analysis is displayed at the bottom of the ADDM screen that is displayed
when the analysis is complete. Figure 9.14 shows an example of the ADDM results for the time
interval we chose.
Notice that these findings are similar in nature to the ones displayed by the EM Findings
link shown earlier in Figure 9.4. The difference between the two ADDM results is that those
in Figure 9.4 are for the last three AWR collection periods as they existed when that page was
viewed, whereas the results in Figure 9.14 are for our manually specified time frame. By man-
ually specifying the ADDM analysis period in this way, you can “go back in time” and review
previous spikes in performance that may have been missed with real-time monitoring like that
shown on the EM Findings link.
Although using EM Database Control to view ADDM results is by far the simplest way to
review ADDM recommendations, you can also query the ADDM data dictionary views directly
as well. Some of these data dictionary views are discussed in the following section.
Using Data Dictionary Views to View ADDM Analysis
You can use more than 20 data dictionary views to examine the results of ADDM’s activities.
Four commonly used ADDM views that store the recommendation information we saw in the
EM Database Control pages are described in Table 9.2.
FIGURE 9.14 The results of a manually specified ADDM analysis
4367.book Page 442 Monday, October 4, 2004 2:19 PM