Reservoir Formation Damage Episode 1 Part 3 docx
Bạn đang xem bản rút gọn của tài liệu. Xem và tải ngay bản đầy đủ của tài liệu tại đây (1.27 MB, 25 trang )
32
Reservoir
Formation
Damage
(2-13)
V and
V
w
are the
volumes
of the
solid
and the
water absorbed,
respectively.
Ohen
and
Civan (1991) used
the
expression given
by
Nayak
and
Christensen
(1970)
for the
swelling coefficient:
(2-14)
in
which
c is the
water concentration
in the
solid
and
CI
is the
plasticity
index.
<;,
and
q
t
are
some empirical
coefficients,
m is an
exponent.
Chang
and
Civan
(1997)
used
the
expression given
by
Seed
et
al.
(1962):
c
-
10)
244
(2-15)
where
C
c
is the
clay content
of
porous rock
as
weight percent,
PI is the
plasticity index,
and k' is an
empirical constant.
Water Content During Clay Swelling
The
rate
of
water retainment
of
clay minerals
is
assumed proportional
with
the
water absorption rate,
5,
and the
deviation
of the
instantaneous
water content
from
the
saturation water content
as:
=
k
w
S(w
t
-w)
subject
to the
initial condition
(2-16)
(2-17)
where
k
w
is a
water retainment rate
constant,
w
denotes
the
weight
per-
cent
of
water
in
clay
and the
subscripts
o and t
refer
to the
initial
(t = 0)
and
terminal
(t
-»
°o)
conditions, respectively.
An
analytical solution
of
Eqs.
2-16
and 17
yields:
=
w
t
-(w
t
-w
0
)
exp
(-k
w
S)
(2-1
8)
Osisanya
and
Chenevert
(1996)
measured
the
variation
of the
water
content
of the
Wellington
shale
exposed
to
deionized
water.
Figure
2-20
Mineralogy
and
Mineral
Sensitivity
of
Petroleum-Bearing
Formations
33
10
15
1
1
«
(hr
•
Osisanya
and
Chenevert Gage
1
data
Correlation
of the
Gage
1
data
%
Osisanya
and
Chenevert Gage
2
data
Correlation
of the
Gage
2
data
X
Osisanya
and
Chenevert Gage
3
data
Correlation
of the
Gage
3
data
Figure
2-20.
Correlation
of
water
pickup
during
swelling
(after
Civan,
©1999
SPE;
reprinted
by
permission
of the
Society
of
Petroleum
Engineers).
shows
the
correlation
of
their data with
Eq.
2-18
using
Eq.
2-6.
The
best
fits
were obtained using
w
0
=
2.7
wt.%,
w
t
=
3.27
wt.%,
A =
k
w
(c
{
-
c
0
)/
h
=
0.26
and
h-Jo
= \ for
their
Gage
1
data,
w
0
=
2.77
wt.%,
w
t
=
3.28
wt.%,
A =
0.06
and
h^D
= 0.8 for
their Gage
2
data,
and
w
0
=
2.77 wt.%,
w
t
=
3.28
wt.%,
A =
0.035
and
h-^j~D
= 0.8 for
their Gage
3
data.
Brownell
(1976)
reports
the
data
of the
moisture content
of a
dried
clay
piece containing
montmorillonite
soaked
in
water. Figure
2-21
shows
a
correlation
of the
data with
Eq.
2-18
using
Eq.
2-6.
The
best
fit was
obtained using
w
0
= 0%,
w
t
=
14.2
wt.%,
A = 0.2 and
Time-Dependent
Clay
Expansion
Coefficient
By
contact with water
the
swelling clay particles absorb water
and ex-
pand.
The
rate
of
volume
increase
is
assumed
proportional
to the
water
absorption rate,
5,
and the
deviation
of the
instantaneous volume
from
the
terminal swollen volume that will
be
achieved
at
saturation,
(V
t
- V).
Therefore,
the
rate equation
is
written
as:
34
Reservoir
Formation
Damage
e \3
o
1 S
n
t\
.
ft .
•
Brown
Brown
x"
^
*
en
data
tion
of the
eO
data
,
/
;
X
lx
»
468
t
1/2
(hr
in
)
10
12
Figure
2-21.
Correlation
of
water pickup during swelling (after Civan, ©1999
SPE;
reprinted
by
permission
of the
Society
of
Petroleum Engineers).
=
k
a
s(v
t
-v)
subject
to
(2-19)
(2-20)
A:
is a
rate constant. Thus, solving
Eqs. 2-19
and 20
yields:
V
=
V
t
-(V
t
-V
0
)exp(-k
a
S)
(2-21)
from
which
the
expansion coefficient
of a
unit clay volume
is
determined
as:
(2-22)
where
a
t
is the
terminal expansion coefficient
at
saturation.
k
a
is the
rate
coefficient
of
expansion.
Seed
et
al.
(1962), Blomquist
and
Portigo (1962),
Chenevert
(1970),
and
Wild
et al.
(1996)
measured
the
rates
of
expansion
of the
samples
of
compacted sandy clay, hydrogen soil, typical shales,
and
lime-stabi-
lized kaolinite cylinders containing gypsum
and
ground granulated blast
furnace
slag, respectively. Figures
2-22
and
2-23
show
the
correlation
of
their data with
Eq.
2-22
using
Eq.
2-6.
The
best matches
of the
data
Mineralogy
and
Mineral Sensitivity
of
Petroleum-Bearing
Formations
35
25
2
.
1
*i
•J
.
0 5
n
>
U
I
C
:
!
.,&
f
t
•
I
1
;*/
\/S+
£#
F
i
i
f
^
4
\S^
/-
\s^
S
5
10 15 20
2f
t
ira
(day
1
«)
+
A
X
Seed
et
al
data
Correlation
of
Seed
et al
data
Bfomqutet
and
Fbrtigo
data
Correlation
of
Btomquist
and
Portigo
data
Chenevert
data
Correlation
of
Chenevert data
Figure
2-22.
Correlation
of
volume change during swelling
(after
Civan,
©1999
SPE;
reprinted
by
permission
of the
Society
of
Petroleum Engineers).
•\
0
,
0
i.
1
1
1
1
k
^
^<
0.5 1
• Wil
CYi
.>,
Wil
Co
X
W8
fV,
X
y
/
•*>
y
/
^»
/
1.5 2 2.5 3
t
1/2
(day
in
)
d et al
Fig.5
data
rrelation
of
Wild
et al
Fig.5 data
d
et al
Fig.6
data
-relation
of Wad et al
Rg.6
data
d
et al
Rg.8
data
•relation
of
Wild
et al
Fig.8
data
Figure
2-23.
Correlation
of
volume change during swelling (after Civan,
©1999
SPE;
reprinted
by
permission
of the
Society
of
Petroleum Engineers).
36
Reservoir
Formation
Damage
shown
in
Figure
2-22
were obtained using
A =
k(c
{
-
c^lh
=
0.085,
h-\TJ5
=
0.67,
and
a
t
=
100(V,
-
V
0
}IV
0
= 3.7
vol.%
for the
Figure
2
data
of
Seed
et
al.
(1962),
A =
2.2,
h^D
=
1.1,
and a, =
(V
t
-
V
0
}IV
0
=
95/V
0
volume fraction
for the
Figure
9
data
of
Blomquist
and
Portigo (1962),
and
A =
0.4,
/zVZ)
=
1.37,
and a, =
0.55%
for the
Figure
4
(Curve
F)
data
of
Chenevert
(1970).
Note that
the
initial sample volume
V
0
is not
given
in
the
original data. However, this value
is not
required
for the
plots
of
(1
-
oc/oc,)
because
the
V
0
value cancels
out in the
ratio
of
oc/a,.
Note that
the
data
points
shown
in
Figure
2-21
are the
tick-mark readings
of the
plots
of the
original reported data.
Wild
et al.
(1996) tested lime-stabilized compacted kaolinite cylinders
containing gypsum
and
ground granulated blast furnace
slag.
After moist-
curing
for
certain periods, they soaked these samples
in
water
and
mea-
sured
the
linear expansion
of the
samples. Figure
2-23
shows
the
representation
of the
three typical data sets selected
from
their Figures
5,
6, and 8 by Eq.
2-22
using
Eq.
2-6.
The
first
set of
data
was
obtained
using
a
7-day moist-cured kaolinite containing
6%
lime
and 4%
gypsum.
The
second
set of
data
is for a
28-day moist-cured kaolinite containing
6%
lime
and 4%
gypsum.
The
third
set of
data
is for a
28-day moist-
cured kaolinite containing
2%
lime,
4%
gypsum
and 8%
ground granu-
lated blast furnace slug.
The
best
fits
of Eq.
2-22
using
Eq. 2-6 to the
first,
second,
and
third data
sets
were obtained with
A =
k(c
l
-
c
0
}lh
=1.1,
W#
= 1.0 and
a,
=
10.8
vol.%,
A = 20,
h^D
= 0.2 and
cc,
=
1.48
vol.%,
and A =
2.4,
H-jD
= 0.7 and
oc,
=
0.655
vol.%, respectively.
Ladd (1960) measured
the
volume change
and
water content
of the
compacted Vicksburg Buckshot clay samples during swelling.
For a
lin-
ear
plot
of
Ladd's data
first,
the S
term
is
eliminated between Eqs.
2-18
and
22 to
yield:
1 ^L
=
\^L-
W
w,
-w.
(2-23)
Then, inferred
by Eq.
2-23,
Ladd's data
can be
correlated
on a
log-
log
scale
by a
straightline
as
shown
in
Figure
2-24.
The
best linear
fit
of Eq.
2-23
was
obtained using
w
0
=
0.8g,
w
t
=
32g,
a,
=
13.2/V
0
and
k/k
w
=
1.907.
Note that
the
value
of
V
0
is not
given
and not
required
be-
cause
Eq.
2-23
employs
the
ratio
of
a/a
r
Porosity Reduction
by
Swelling
Based
on the
definition
of the
swelling coefficient,
Civan
and
Knapp
(1987) expressed
the
rate
of
porosity change
by
swelling
of
porous
matrix
as:
Mineralogy
and
Mineral
Sensitivity
of
Petroleum-Bearing
Formations
37
5
Figure
2-24.
Correlation
of
volume change
vs.water
pickup during swelling
(after
Civan, ©1999
SPE;
reprinted
by
permission
of the
Society
of
Petro-
leum Engineers).
(2-24)
where
§
is
porosity,
t is
time,
S
is the
rate
of
water absorbed
per
unit
bulk volume
of
porous medium.
Civan (1996) developed
an
improved equation assuming that
the
rate
of
porosity variation
by
swelling
is
proportional
to the
rate
of
water
ab-
sorption
and the
difference between
the
instantaneous
and the
terminal
or
saturation
porosities:
(2-25)
(2-26)
subject
to
Integrating
Eqs. 2-25
and 26
yields:
In
(2-27)
from
which
the
porosity variation
by
swelling
can be
expressed
by:
38
Reservoir
Formation
Damage
=
4>
-
4>
0
=
4>,
-
1
-
(2-28)
where
k
sw
is the
formation swelling rate
constant,
t is the
actual time
of
contact with water. Therefore,
the
swelling rate constant
can be
deter-
mined
by
fitting
Eq.
2-27.
However,
due to the
lack
of
experimental data,
the
application
of Eq.
2-28
could
not be
demonstrated.
It is
difficult
to
measure porosity during swelling. Permeability
can be
measured more
conveniently. Ohen
and
Civan
(1993)
used
a
permeability-porosity rela-
tionship
to
express
porosity
reduction
in
terms
of
permeability reduction.
Permeability Reduction
by
Swelling
Civan
and
Knapp (1987) assumed that
the
rate
of
permeability reduc-
tion
by
swelling
of
formation depends
on the
rate
of the
water absorp-
tion
and the
difference between
the
instantaneous permeability
and
terminal permeability that will
be
attained
at
saturation
as:
=
a
sw
S(K-K
t
)
subject
to the
initial condition
K
=
K
0
,t
=
0
where
a
sw
is a
rate constant.
Thus, solving
Eqs. 2-29
and 30
yield:
(2-29)
(2-30)
(2-31)
where
a
sw
is the
rate constant
for
permeability reduction
by
swelling,
from
which
the
permeability variation
by
swelling
is
obtained
as:
-
exp(-a
w
5)]
(2-32)
Civan
and
Knapp (1987)
and
Civan
et
al.
(1989)
have confirmed
the
validity
of Eq.
2-31
using
the
Hart
et al.
(1960)
data
for
permeability
reduction
in the
outlet region
of a
core subjected
to the
injection
of a
suspension
of
bacteria. Because bacteria
is
essentially retained
in the
inlet
side
of the
core,
the
permeability reduction
in the
near-effluent port
of
the
core
can be
attributed
to
formation swelling
by
water absorption.
The
Mineralogy
and
Mineral
Sensitivity
of
Petroleum-Bearing
Formations
39
best linear, least-squares
fit of Eq.
2-31
to
Hart
et al.
(1960) data using
Eq. 2-9 for S
yields (Civan
et
al.,
1989):
(2-33)
with
(K
t
/K
0
)
=
0.57
and B =
2a
sw
(c
l
-c
0
)Jo/n
=
QMhr~
{/2
with
a
corre-
lation
coefficient
of R
2
=
0.93
as
shown
in
Figure 2-25. However,
as
shown
in
Figure 2-25,
the
Hart
et al.
(1960)
data
can
also
be
correlated
using
Eq. 2-6 for S. In
this case,
the
best
fit is
obtained using
the pa-
rameter values
of A =
a
sw
(q
-
c
0
)/h
=
0.95,
h^D
=
1,
and
K
t
/K
0
=
0.57.
Ngwenya
et al.
(1995)
conducted core flood experiments
by
injecting
an
artificial seawater into
the
Hopeman
(Clashach)
sandstone. They
re-
port that
the
core
samples used
in
their experiments contained trace
amounts
of
clays. Therefore, they concluded that
the
effect
of
clay swell-
ing,
and
entrainment
and
deposition
of
clay particles
to
permeability
impairment
would
be
negligible. However, their Table
1
data plotted
according
to Eq.
2-31
in
Figure 2-26 indicates
a
reasonably well linear
trend. Consequently,
it can be
concluded that
the
swelling
of
some con-
stituents
of the
sandstone formation should
be
contributing
to
permeability
reduction.
The
best least-squares linear
fit of Eq.
2-31
was
obtained using
Eq.
2-9 for 5
with
the
parameter values
of B =
a
sw
(c,
-
c
0
)/h
=
0.038hr~
1/2
and
(K
t
IK
0
}
=
0.087
with
a
correlation coefficient
of
R
2
=
0.89.
The
best
3
-
•
Hart
etal
data
•
Correlation
of
Hart
et
al
data
•Linear
(Hart
et
al
data)
Figure
2-25.
Correlation
of
permeability
reduction
during
swelling
(after
Civan,
©1999
SPE;
reprinted
by
permission
of the
Society
of
Petro-
leum
Engineers).
40
Reservoir
Formation
Damage
1.2
1
?
0.8
£f
0.6
0.4
0.2
0
Ngwenyaetaldata
Correlation
of
Ngwenyaetaldata
Linear
(Ngwenyaet
al
data)
10 20
t
i*(hr
1/2
)
30
Figure
2-26.
Correlation
of
permeability
reduction
during
swelling
(after
Civan,
©1999
SPE;
reprinted
by
permission
of the
Society
of
Petro-
leum
Engineers).
fit
of Eq.
2-31
using
Eq. 2-6 for 5 was
obtained using
the
parameter
values
of A =
a
sw
(c
l
-
c
0
)/h
=
0.035,
hjD
=
1,
and
K
t
IK
0
=
0.087.
It
is
apparent
from
Figures
2-25
and 26
that
the
quality
of
both
the
Hart
et al.
(1960)
and the
Ngwenya
et al.
(1995)
experimental data
does
not
permit determining whether
Eqs.
2-6 or 9
with
Eq.
2-31
better
rep-
resents
the
data. Because
Eq. 2-6 led to
successful representation
of the
other data
correlated
in the
preceding sections,
it is
reasonable
to
assume
that
Eq. 2-6
should also represent
the
permeability reduction data equally
well. Therefore,
Eq. 2-6 may be
preferred over
Eq.
2-9.
Discussion
and
Generalization
The
preceding analyses
of the
various data indicate that
the
variation
of
the
moisture, volume,
and
permeability
of
clayey formations during
swelling
by
exposure
to
water
is
governed
by
similar rate equations,
which
can be
generalized
as
(Civan, 1999):
-d(f-f
t
)/dt
=
k
f
S(f-f
t
)
subject
to the
initial condition
(2-34)
(2-35)
Mineralogy
and
Mineral
Sensitivity
of
Petroleum-Bearing
Formations
41
Although
the
validity
of Eq.
2-34
for
porosity variation could
not be
dem-
onstrated because
of the
lack
of
experimental data, porosity variation
is
also expected
to
follow
the
same trend because
it is a
result
of
solid
ex-
pansion
by
water absorption,
for
which case
the
validity
of the
proposed
mechanism
was
confirmed with experimental
data.
Let
/
denote
the
properties
of
clayey formations that vary
by
swell-
ing, that
is
/e(w,a,(t),AT),/
0
and/,
denote
the
initial
and
final
values
of
/
over
the
swelling period,
t is
time,
k
f
is the
rate constant
for the
prop-
erty
/, and
S
is the
rate
of
water absorption controlled
by the
hindered
diffusion
of
water into
the
solid according
to Eq.
2-6.
The
analytic solution
of
Eqs. 2-34
and 35 can be
written
in the
fol-
lowing form:
In
f-f
t
(2-36)
As
demonstrated
by Eq.
2-23,
it is
also possible
to
relate
a
property
of
f£(w,a,§,K)
to
another property
of
ge(w,oc,(|>,AT)
for
f*g.
This
can
be
accomplished
by
first applying
Eq.
2-36
for g as:
(2-37)
The
quantity
S can
then
be
eliminated between
Eqs. 2-36
and 37 to
obtain:
(2-38)
Eq.
2-38
is
particularly
useful
to
correlate between
w,a,<|),and
K
with-
out
the
involvement
of the
time
variable.
For
example,
applying
Eq.
2-38,
porosity
and
permeability variations
can be
correlated
by the
power
law
equation:
K-K
(2-39)
where
k
K
and
are the
rate coefficients
for
permeability
and
porosity
reduction
by
swelling, respectively.
42
Reservoir Formation Damage
Conclusions
As
presented
in
this section,
1.
Swelling
of
clayey porous rocks
is
controlled
by
absorption
of
water
by a
water-exposed-surface hindered
diffusion
process.
2.
The
characteristics
of the
swelling clayey formation, such
as
mois-
ture content, volume,
and
permeability, vary
at
rates proportional
to
the
water absorption rate
and
their values relative
to
their
ter-
minal
values that would
be
attained
at the
saturation limit.
3. The
rate laws
of
different
properties allow
for
cross-correlation
between
these
properties.
Civan's (1999) model provides insight into
the
mechanism
of the
clay
swelling process
and a
proper means
of
interpreting
and
correlating
the
swelling-dependent characteristics
of
clayey formations.
Graphical Representation
of
Clay Content
The
distribution
of
clays
can be
conveniently
depicted
by
ternary
line
diagrams such
as
given
in
Figure
2-27
by
Lynn
and
Nasr-El-Din
(1998).
ILLITE
/
MONTMOMLLONITE
M
W
TO (0
Si
KAOLINITE
10
10
M
m
st
30
20
10
CHLORITE
Figure
2-27.
A
ternary clay distribution chart (Reprinted from Journal
of
Petroleum
Science
and
Engineering,
Vol.
21,
Lynn,
J. D., and
Nasr-El-Din,
H.
A.,
"Evaluation
of
Formation Damage
due to
Frac Stimulation
of
Saudi
Ara-
bian
Clastic
Reservoir,"
pp.
179-201,
©1998;
reprinted
with
permission
from
Elsevier Science).
Mineralogy
and
Mineral Sensitivity
of
Petroleum-Bearing Formations
43
Lynn
and
Nasr-El-Din
(1998) classified reservoir formations having less
than
1 wt. %
total
clay
and
permeability
higher than
one
Darcy
as the
high quality,
and the low
quality vice versa. Amaefule
et
al.
(1993)
mea-
sured
the
formation quality
by the
reservoir quality index defined
as:
(2-40)
Hayatdavoudi
Hydration
Index
(HHI)
The
Hayatdavoudi hydration index
(HHI=[O/OH])
is
defined
as the
ratio
of the
oxygen atoms
to
hydroxyl groups
in
clays
and it
controls
the
enthalpy
or
free
energy
of the
clays available
for the
work
of
swelling
(a)
SMECTTT
ILUTEOf
S
tf£
—
K/
E
GROUP
& VI
OUP&ATTAP
/I
/
OLJN1TEGRO
RMICOUTC-*
/
M.GITE/
~s
s
IP&CHLORTT
/
1.5
LN
"HP
SCALE
(b)
LN
"HH"
SCALE
Figure
2-28.
Hayatdavoudi clay hydration charts:
(a)
measured enthalpy
versus hydration index
and (b)
theoretical free energy versus hydration
index
for
various clays
(after
A.
Hayatdavoudi,
©1999
SPE;
reprinted
by
per-
mission
of the
Society
of
Petroleum Engineers).
44
Reservoir
Formation
Damage
by
hydration
(Hayatdavoudi,
1999,
1999). Hence, higher hydration index
is
indicative
of
more clay swelling, according
to
(Hayatdavoudi,
1999,
1999):
AG
=
A//
-
TAS
=
/mn[O/OH]
(2-41)
where
G, H, S, T, and R
denote
the
free
energy, enthalpy, entropy, abso-
lute
temperature,
and the
universal
gas
constant, respectively. Figure
2-28
by
Hayatdavoudi
(1999)
shows that
all
clays possess some degree
of the
work
of
swelling
and
therefore classification
of
different
clays
as
swell-
ing
or
non-swelling
has no
significance.
References
Amaefule,
J. O.,
Kersey,
D.
G.,
Norman,
D. L., &
Shannon,
P. M.,
"Ad-
vances
in
Formation Damage Assessment
and
Control
Strategies,"
CIM
Paper
No.
88-39-65,
Proceedings
of the
39
th
Annual Technical Meet-
ing
of
Petroleum Society
of CIM and
Canadian
Gas
Processors Asso-
ciation, Calgary, Alberta, June
12-16, 1988,
16 p.
Amaefule,
J.
O.,
Altunbay,
M.,
Tiab,
D.,
Kersey,
D.
G.,
&
Keelan,
D. K.,
"Enhanced Reservoir Description: Using Core
and Log
Data
to
Iden-
tify
Hydraulic (Flow) Units
and
Predict Permeability
in
Uncored
Intervals/Wells,"
SPE
26436 paper, Proceedings
of the
68
th
Annual
Technical Conference
and
Exhibition
of the SPE
held
in
Houston,
Texas, October
3-6, 1993,
pp.
205-220.
Ballard,
T.
J.,
Beare,
S. P., &
Lawless,
T.
A.,
"Fundamentals
of
Shale
Stabilization: Water Transport through
Shales,"
SPE
Formation Evalu-
ation, June
1994,
pp.
129-134.
Blomquist,
G. C., &
Portigo,
J.
M.,
"Moisture, Density
and
Volume
Change Relationships
of
Clay Soils Expressed
as
Constants
of
Propor-
tionality," Bull.
Highway
Res.
Board,
No.
313, 1962,
pp.
78-91.
Brownell,
W. E.,
Structural
Clay
Products,
Springer-Verlag,
New
York,
1976,
231 p.
Bucke,
D. P., &
Mankin,
C.
J.,
"Clay-Mineral Diagenesis Within
Interlaminated Shales
and
Sandstones,"
/.
Sedimentary Petrology,
Vol.
41,
No. 4,
December
1971,
pp.
971-981.
Carslaw,
H.
S.,
&
Jaeger,
J.
C.,
Conduction
of
Heat
in
Solids, Second
ed., Oxford University
Press,
1959,
510 p.
Chang,
F. F., &
Civan,
F.,
"Predictability
of
Formation Damage
by
Mod-
eling Chemical
and
Mechanical
Processes,"
SPE
23793 paper, Proceed-
ings
of the SPE
International Symposium
on
Formation Damage
Control, February
26-27, 1992,
Lafayette, Louisiana,
pp.
293-312.
Chang,
F.
F.,
&
Civan,
F.,
"Practical
Model
for
Chemically Induced
For-
mation
Damage,"
/.
of
Petroleum Science
and
Engineering,
Vol.
17,
No.
1/2,
February
1997,
pp.
123-137.
Mineralogy
and
Mineral
Sensitivity
of
Petroleum-Bearing
Formations
45
Chenevert,
M. E.,
"Shale
Alteration
by
Water Adsorption,"
JPT,
Septem-
ber
1970,
pp.
1141-1148.
Chilingarian,
G.
V.,
&
Vorabutr,
P.,
Drilling
and
Drilling Fluids, Devel-
opments
in
Petroleum Science,
11,
Elsevier Scientific Publishing
Co.,
New
York,
1981.
Civan,
R,
"Predictability
of
Formation Damage:
An
Assessment Study
and
Generalized Models," Final Report,
U.S.
DOE
Contract
No.
DE-AC22-
90BC14658, April
1994.
Civan,
F.,
"Modeling
and
Simulation
of
Formation Damage
by
Organic
Deposition," Proceedings
of the
First International Symposium
on
Col-
loid Chemistry
in Oil
Production: Asphaltenes
and Wax
Deposition,
ISCOP'95,
Rio de
Janeiro, Brazil, November
26-29, 1995,
pp.
102-107.
Civan,
F.,
"A
Multi-Purpose
Formation Damage Model,"
SPE
31101,
Pro-
ceedings
of the SPE
Formation Damage Symposium, Lafayette,
LA,
February
14-15, 1996,
pp.
311-326.
Civan,
F,
"Interactions
of the
Horizontal Wellbore Hydraulics
and
Forma-
tion
Damage,"
SPE
35213, Proceedings
of the SPE
Permian Basin
Oil &
Gas
Recovery Conf., Midland,
TX,
March
27-29, 1996,
pp.
561-569.
Civan,
F.,
"Model
for
Interpretation
and
Correlation
of
Contact Angle
Measurements,"
Jour.
Colloid
and
Interface
Science,
Vol. 192, 1997,
pp.
500-502.
Civan,
F.,
"Interpretation
and
Correlations
of
Clay Swelling Measurements,"
Paper
SPE
52134, Proceedings
of the
1999
SPE
Mid-Continent Opera-
tions
Symposium,
28-31
March
1999,
Oklahoma City,
OK.
Civan,
F.,
&
Knapp,
R.
M.,
"Effect
of
Clay Swelling
and
Fines Migration
on
Formation
Permeability,"
SPE
Paper
No.
16235, Proceedings
of the
SPE
Production Operations Symposium,
OKC, 1987,
pp.
475-483.
Civan,
F.,
Knapp,
R.
M.,
&
Ohen,
H.
A.,
"Alteration
of
Permeability
by
Fine
Particle
Processes,"
J.
Petroleum Science
and
Engineering,
Vol.
3,
Nos.
1/2,
October
1989,
pp.
65-79.
Collins,
E.
R.,
Flow
of
Fluids Through Porous Materials, Penn Well
Pub-
lishing
Co.,
Tulsa,
Oklahoma,
1961,
270 p.
Crank,
J.,
The
Mathematics
of
Diffusion,
Oxford University Press,
London,
1956,
347 p.
Degens,
E. T.,
Geochemistry
of
Sediments
(A
Brief
Survey), Prentice-Hall,
Inc., Englewood Cliffs,
New
Jersey,
1965,
342 p.
Ezzat,
A.
M.,
"Completion Fluids Design Criteria
and
Current Technol-
ogy
Weaknesses,
SPE
19434 paper,
the SPE
Formation Damage
Con-
trol
Symposium held
in
Lafayette, Louisiana, February
22-23, 1990,
pp.
255-266.
Grim,
R.
E.,
"Modern Concepts
of
Clay Minerals,"
Jour.
Geology,
Vol.
50,
No.
3,
April-May
1942,
pp.
225-275.
Grim,
R.
E.,
Clay
Mineralogy, McGraw-Hill,
New
York,
New
York,
1953,
384
p.
46
Reservoir Formation Damage
Hart,
R.
T.,
Fekete,
T.,
&
Flock,
D.
L.,
"The
Plugging
Effect
of
Bacteria
in
Sandstone Systems," Canadian Mining
and
Metallurgical
Bulletin,
Vol.
53,
1960,
pp.
495-501.
Hayatdavoudi,
A.,
"Changing Chemophysical Properties
of
Formation
and
Drilling
Fluid Enhances Penetration Rate
and Bit
Life," Paper
No. SPE
50729,
Proceedings
of the SPE
International Symposium
on Oil
Field
Chemistry
held
in
Houston, Texas,
16-19
February
1999,
pp.
273-285.
Hayatdavoudi,
A.,
private communication,
1999.
Hughes,
R.
V.,
"The
Application
of
Modern Clay Concepts
to Oil
Field
Development,"
pp.
151-167,
in
Drilling
and
Production Practice
1950,
American Petroleum Institute,
New
York,
NY,
1951,
344 p.
Khilar,
K. C.,
Fogler,
H. S.,
"Water Sensitivity
of
Sandstones,"
SPEJ,
Feb-
ruary
1983,
pp.
55-64.
Kia,
S. F.,
Fogler,
H.
S.,
&
Reed,
M. G.,
"Effect
of
Salt Composition
on
Clay
Release
in
Berea Sandstones,"
SPE
16254, February
1987.
Ladd,
C.
C.,
"Mechanisms
of
Swelling
by
Compacted
Clay,"
in
High-
way
Research Board Bulletin
245,
High Research Board, National
Re-
search Council, Publication
731,
Washington,
D.C., 1960,
pp.
10-26.
Liu,
X.,
Civan,
F, &
Evans,
R.
D.,
"Correlation
of the
Non-Darcy Flow
Coefficient,
J. of
Canadian Petroleum Technology,
Vol.
34, No. 10,
1995,
pp.
50-54.
Lynn,
J.
D.,
&
Nasr-El-Din,
H.
A.,
"Evaluation
of
Formation Damage
due
to
Frac Stimulation
of
Saudi Arabian Clastic Reservoir,"
J. of
Petro-
leum Science
and
Engineering,
Vol.
21,
Nos.
3-4,
1998,
pp.
179-201.
Mancini,
E.
A.,
"Characterization
of
Sandstone Heterogeneity
in
Carbon-
iferous
Reservoirs
for
Increased Recovery
of Oil and Gas
from
Foreland Basins," Contract
No.
FG07-90BC14448,
in
EOR-DOE/BC-
90/4
Progress
Review,
No. 64, pp.
79-83, U.S.
Department
of
Energy,
Bartlesville,
Oklahoma,
May
1991,
129 p.
Mohan,
K.
K.,
&
Fogler,
H.
S.,
"Colloidally
Induced Smecticic Fines
Mi-
gration: Existance
of
Microquakes,"
AIChE
J.,
Vol.
43, No. 3,
March
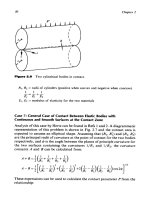
1997,
pp.
565-576.
Mondshine,
T.
C.,
"A New
Potassium Based
Mud
System," Paper
No.
SPE
4516,
48th Annual Fall Meeting
of SPE of
AIME,
October
1973.
Mondshine,
T.
C.,
"New
Technique Determines
Oil Mud
Salinity Needs
in
Shale Drilling,"
Oil and Gas
J.,
July
14,
1969.
Mungan,
N.,
"Discussion
of An
Overview
of
Formation
Damage,"
JPT,
Vol.
41, No.
11,
November
1989,
p.
1224.
Nayak,
N. V, &
Christensen,
R. W.,
"Swelling Characteristics
of
Com-
pacted Expansive
Soils,"
Clay
and
Clay Mineral,
Vol.
19, No. 4,
December
1970,
pp.
251-261.
Neasham,
J.
W.,
"The
Morphology
of
Dispersed Clay
in
Sandstone
Res-
ervoirs
and Its
Effect
on
Sandstone Shaliness, Pore Space
and
Fluid
Mineralogy
and
Mineral
Sensitivity
of
Petroleum-Bearing
Formations
47
Flow
Properties,"
SPE
6858,
Proceedings
of the
52nd Annual Fall
Technical
Conference
and
Exhibition
of the SPE of
AIME
held
in
Denver,
Colorado,
October
9-12, 1977,
pp.
184-191.
Ngwenya,
B. T.,
Elphick,
S.
C,
&
Shimmield,
G. B.,
"Reservoir Sensi-
tivity
to
Water Flooding:
An
Experimental
Study
of
Seawater Injec-
tion
in a
North
Sea
Reservoir Analog," AAPG Bulletin, Vol.
79, No.
2,
February 1995,
pp.
285-304.
Norrish,
K.,
"The Swelling
of
Montmorillonite,"
Discussions Faraday
Soc.,
Vol.
18,
1954,
p.
120.
Ohen,
H.
A.,
&
Civan,
E,
"Simulation
of
Formation Damage
in
Petro-
leum
Reservoirs,"
SPE
19420 paper, Proceedings
of the
1990
SPE
Symposium
on
Formation Damage Control, Lafayette, Louisiana, Feb-
ruary
22-23,
1990,
pp.
185-200.
Ohen,
H.
A.,
&
Civan,
F.,
"Simulation
of
Formation Damage
in
Petro-
leum Reservoirs,"
SPE
Advanced
Technology
Series, Vol.
1, No. 1, pp.
27-35,
April 1993.
Osisanya,
S. O., &
Chenevert,
M.
E.,
"Physico-Chemical
Modelling
of
Wellbore Stability
in
Shale Formations,"
J. of
Canadian Petroleum
Technology,
Vol.
35, No. 2,
February 1996,
pp.
53-63.
Pittman,
E. D., &
Thomas,
J.
B.,
"Some
Applications
of
Scanning Elec-
tron Microscopy
to the
Study
of
Reservoir
Rock,"
SPE
7550
paper,
November 1979,
pp.
1375-1380.
Reed,
M.
G.,
"Formation Permeability Damage
by
Mica Alteration
and
Carbonate
Dissolution," JPT, September 1977,
pp.
1056-1060.
Rogers, 1963.
Sahimi,
M.,
Flow
and
Transport
in
Porous Media
and
Fractured Rock,
VCR, Weinheim, 1995,
482 p.
Schechter,
R.
S.,
Oil
Well
Stimulation, Prentice Hall, Englewood
Cliffs,
New
Jersey, 1992,
602 p.
Seed,
H.
B.,
Mitchell,
J.
K.,
&
Chan,
C.
K.,
"Studies
of
Swell
and
Swell
Pressure Characteristics
of
Compacted Clays,
Bull.
Highway Res.
Board,
No.
313, 1962,
pp.
12-39.
Seed,
H.
B.,
Woodward, Jr.,
R.
J.,
&
Lundgren,
R.,
"Prediction
of
Swell-
ing
Potential
for
Compacted Clays,"
J.
Soil Mech. Found. Div., Proc.
Am.
Soc. Civ. Eng., 88(SM3), June 1962,
pp.
53-87.
Sharma,
M.
M.,
&
Yortsos,
Y.
C.,
"Fines
Migration
in
Porous Media,"
AIChE
J.,
Vol.
33, No. 10,
1987,
pp.
1654-1662.
Simpson,
J. P.,
"Drilling Fluid Filtration Under Simulated Downhole
Conditions,"
SPE
Paper
4779,
1974,
14 p.
Weaver,
C.
E.,
&
Pollard,
L.
D.,
The
Chemistry
of
Clay
Minerals,
Elsevier,
New
York, 1973,
213 p.
Welton,
J.
E.,
"SEM
Petrology Atlas," American Association
of
Petro-
leum
Geologists,
Tulsa,
Oklahoma, 1984,
237 p.
48
Reservoir
Formation
Damage
Wild,
S.,
Kinuthia,
J.
M.,
Robinson,
R.
B.,
&
Humphreys,
I.,
"Effect
of
Ground
Granulated Blast Furnace Slag (GGBS)
on the
Strength
and
Swelling
Properties
of
Lime-Stabilized Kaolinite
in the
Presence
of
Sulphates,"
Clay
Minerals,
Vol.
31,
1996,
pp.
423-433.
Wojtanowicz,
A. K.,
Krilov,
Z.,
&
Langlinais,
J. P.,
"Experimental
De-
termination
of
Formation Damage Pore Blocking Mechanisms,"
Trans,
of
the
ASME, Journal
of
Energy
Resources
Technology,
Vol.
110,
1988,
pp.
34-42.
Wojtanowicz,
A.
K.,
Krilov,
Z.,
&
Langlinais,
J. P.,
"Study
on the
Effect
of
Pore Blocking Mechanisms
on
Formation Damage," Paper
SPE
16233 presented
at
Society
of
Petroleum Engineers Symposium, Okla-
homa
City, Oklahoma, March
8-10, 1987,
pp.
449-463.
Zhou,
Z.,
"Construction
and
Application
of
Clay-Swelling Diagrams
by
Use of XRD
Methods,"
JPT,
April
1995,
p.
306.
Zhou,
Z.,
Gunter,
W. D.,
Kadatz,
B.,
&
Cameron,
S.,
"Effect
of
Clay
Swelling
on
Reservoir Quality," Paper
No.
94-54, Journal
of
Cana-
dian Petroleum
Technology,
Vol.
35,
1996,
pp.
18-23.
Zhou,
Z.,
Cameron,
S.,
Kadatz,
B.,
&
Gunter,
W.
D.,
"Clay
Swelling
Dia-
grams: Their Applications
in
Formation Damage
Control,"
SPE
Jour-
nal,
Vol.
2,
1997,
pp.
99-106.
Chapter
3
Petrography
and
Texture
of
Petroleum'
Bearing
Formations
Summary
A
review
of
petrographical characterization
of
petroleum-bearing
formations,
critical
for
formation damage analysis,
is
presented.
Introduction
In-situ
fluids
and
particles transport processes occur
in the
pore space
of
the
subsurface formations.
The
subsurface formations
can be
classified
as
following (Collins,
1961;
Kaviany, 1991):
1.
Isotropic, anisotropic (directional dependency)
2.
Homogeneous, heterogeneous (spatial dependency)
3.
Consolidated, unconsolidated (cementation)
4.
Single
or
multiple porosity, naturally
fractured,
nonfractured (pore
structure)
5.
Ordered
or
disordered (random)
Description
of
petroleum bearing formations
by
quantitative means
is a
difficult
task
and is
presented
in
this chapter.
Petrographical Characteristics
The
petrographical parameters
are
facilitated
to
quantitatively
describe
the
texture
or
appearance
of the
rock minerals
and the
pore structure.
The
fundamental
parameters used
for
this purpose
are
described
in the
following.
49
50
Reservoir
Formation
Damage
Fabric
and
Texture
Lucia
(1995) emphasizes that
"Pore
space must
be
defined
and
clas-
sified
in
terms
of
rock fabrics
and
petrophysical properties
to
integrate
geological
and
engineering information." Fabric
is the
particle orientation
in
sedimentary
rock (O'Brien
et
al.,
1994).
Defarge
et
al.
(1996) defined:
"Texture,
i.e.,
the
size, shape,
and
mutual arrangement
of the
constitutient
elements
at the
smaller scale
of
sedimentary bodies,
is a
petrological
feature
that
may
serve
to
characterize
and
compare"
them.
Petrophysical
classification
of
rock fabrics, such
as
shown
in
Figure
3-1 by
Lucia (1995),
distinguishes
between depositional
and
diagenetic textures. Lucia (1995)
points
out
that:
"The
pore-size distribution
is
controlled
by the
grain size
in
grain-dominated
packstones
and by the mud
size
in
mud-dominated pack-
stones." Lucia (1995) explains that:
"Touching-vug
pore systems
are
defined
as
pore space that
is (1)
significantly larger than
the
particle size,
and
(2)
forms
an
interconnected pore system
of
significant extent" (Figure
3-2).
Porosity
Porosity,
(j),
is a
scalar measure
of the
pore volume defined
as the
volume
fraction
of the
pore space
in the
bulk
of
porous media.
The
porous
structure
of
naturally occurring porous media
is
quite complicated.
The
simplest
of the
pore geometry
is
formed
by
packing
of
near-spherical
grains.
When
the
formation contains
different
types
of
grains
and
fractured
by
stress
and
deformation, pore structure
is
highly complicated.
For
convenience
in
analytical modeling,
the
porous structure
of a
formation
can
be
subdivided into
a
number
of
regions. Frequently,
a
gross classifica-
tion
as
micropores
and
macropores regions according
to
Whitaker
(1999)
and
Bai et al.
(1993)
can be
used
for
simplification. However,
in
some
cases,
a
more detailed composite description with multiple regions
may
be
required (Cinco-Ley,
1996;
Guo and
Evans, 1995). Such descriptions
may
accommodate
for
natural fractures
and
grain packed regions
of
different
characteristics.
The
various regions
are
considered
to
interact
with
each other
(Bai
et
al.,
1995).
Spherical Pore Space Approximation
For
simplification
and
convenience,
the
shapes
of the
pore space
and
grains
of
porous
media
are
approximated
and
idealized
as
spheres.
The
pore volume
can be
approximated
in
terms
of the
mean pore diameter,
D, as:
V
P
=
nD
3
/6
(3-D
INTERPARTICLE
PORE SPACE
to
O
DC
O
CL
O
fc
oc
LU
UJ
O
DC
UJ
CL
Particle
size
and
sorting
(Matrix
interconnection)
GRAIN-DOMINATED FABRIC
GRAINSTONE
FKCKSTONE
Grain size controls
pore
size
Grain/mud
size
controls
pore size
Limestone
Dolomite
Crystal
size
<100|im
Crystal
size
>100
•
Intergranular
pore
space
or
cement
Intergronular
pore
space
or
cement
Crystal
size controls pore size
•
Intercrystaffine
pore
space
Hole:
bar is
urn
•
IntercrystaHine
pore
space
MUD-DOMINATED FABRIC
BUCKSTONE
WACKESTONE
MUDSTONE
Mud
size controls
connecting
pore
size
Limestone
Dolomite
Dolomite
crystal size
controls
connecting pore size
Note:
bar
is
100
jim
Figure
3-1.
Geological
and
petrophysical classification
of the
carbonate rock interparticle pore structure (after
F. J.
Lucia,
AAPG
Bulletin,
Vol.
79, No. 9,
AAPG
©1995;
reprinted
by
permission
of the
American Association
of
Petroleum Geologists
whose permission
is
required
for
future
use).
O
CTQ
to
CL
X
3
o
5
l
Cd
CD
S
S
1
52
Reservoir Formation Damage
VUGGY
PORE
SPACE
SEPARATE-VUG
PORES
(VUG-TO-MATRIX-TO-VUG
CONNECTION)
TOUCHING-VUG
PORES
(VUG-TO-VUG
CONNECTION)
GRAIN-DOMINATED
FABRIC
EXAMPLE TYPES
MUD-DOMINATED
FABRIC
GRAIN-
AND
MUD-
DOMINATED
FABRICS
EXAMPLE TYPES
EXAMPLE TYPES
MoMic
pores
Moldic
Intrafossil
pores
Shelter
pores
Cavernous
Breccia
Fractures
Solution-
enlarged
fractures
Figure
3-2.
Geological
and
petrophysical classification
of the
rock vuggy pore
structure (after
F. J.
Lucia,
AAPG
Bulletin,
Vol.
79, No. 9,
AAPG
©1995;
reprinted
by
permission
of the
American Association
of
Petroleum Geologists
whose permission
is
required
for
future
use).
Then, given
the
bulk volume,
V
B
,
the
porosity
is
expressed
by:
(3-2)
(3-3)
The
specific pore surface
in
terms
of the
pore surface
per
pore volume
is
given
by:
7
6V
B
The
pore surface
is
given
by:
\
2
/3x2/3
Petrography
and
Texture
of
Petroleum-Bearing Formations
53
a
=
A/Vp
= 6/D
(3-4)
The
expressions
given above
for a
spherical shape
can be
corrected
for
irregular pore space, respectively,
as
(Civan,
1996):
V
P
=
=
C
2
D
3
A =
C
3
D
2
=
C
4
(|)
2
/
3
a
=
C
5
/D
(3-5)
(3-6)
(3-7)
(3-8)
where
C
l
,C
2
, ,C
5
are
some empirical shape factors.
Similarly,
for the
spherical idealization
of a
particle,
the
specific
surface
defined
as the
contact surface
per
volume sphere
is
given
by:
(3-9)
(3-10)
This
can be
corrected
for
irregular particle shape
as:
where
C
6
is a
shape factor.
Area Open
for
Flow
Areosity
or
areal porosity
is the
fractional area
of the
bulk porous
media open
for
flow
(Liu
and
Masliyah, 1996).
Liu and
Masliyah (1996)
point
out
that,
frequently,
the
areal porosity
has
been taken equal
to the
volumetric porosity
of
porous
media.
A
f
=*
(3-11)
They emphasize that Equation
3-11
performs well
for
models
con-
sidering
a
bundle
of
straight hydraulic
flow
pathways
and
nonconnecting
constricted pathways. Whereas,
for
isotropic porous media,
Liu et
al.
(1994) recommend that
the
areal porosity should
be
estimated
as:
(3-12)
54
Reservoir
Formation
Damage
Tortuosity
Tortuosity
is
defined
as the
ration
of the
lengths,
L
t
and
L,
of the
tortuous
fluid
pathways
and the
porous media:
T
=
L,/L
(3-13)
Liu
and
Masliyah
(1996a,
b)
recommend
the
Bruggeman (1935) equation
T
1
^
1
/
2
(3-14)
for
random packs
of
grains
of
porosity
§
> 0.2 and the
Humble equation
(Winsauer
et
al.,
1952)
1.15
(3-15)
for
consolidated porous media
of
porosity
(|)
<
0.45.
They point
out
that
the
latter
may
have
a
variable accuracy
and,
therefore, tortuosity should
be
measured.
Interconnectivity
of
Pores
Based
on
their binary images shown
in
Figure
3-3,
Davies (1990)
classified
the
pore types
in
four
groups (Davies,
1990,
p.
74):
"Pore
Type
1:
Microspores, generally equant shape, less than
5
microns
in
diameter.
These
occur
in the
finest
grained
and
shaly
portions
of the
sand.
Pore
Type
2:
Narrow, slot like pores, generally
less
than
15
microns
in
diameter, commonly
slightly
to
strongly
curved.
These
represent reduced primary inter-
granular pores resulting
from
the
reduction
of
original primary pores
by
extensive cementation.
Pore
Type
3:
Primary intergranular pores, triangular
in
shape,
twenty-five
to
fifty
microns maximum diameter.
These
are the
original primary intergranular pores
of
the
rock which have been
affected
only mini-
mally
by
cementation.
Pore
Type
4:
Solution enlarged primary pores: oversized primary
pores,
fifty
to two
hundred microns maximum
diameter
produced
through
the
partial
dissolution
of
rock matrix."
Petrography
and
Texture
of
Petroleum-Bearing
Formations
1 2
55
*:
1
*->
Figure
3-3.
Thin-section
images
of
various
pore
types
(after
Davies,
©1990
SPE;
reprinted
by
permission
of the
Society
of
Petroleum
Engineers).
Frequently,
for
convenience, pore space
is
perceived
to
consist
of
pore
bodies connecting
to
other pore bodies
by
means
of the
pore
necks
or
throats
as
depicted
in
Figure
3-4.
Many models facilitate
a
network
of
pore
bodies
connected with pore
throats
as
shown
in
Figure 3-5. How-
ever,
in
reality,
it is an
informidable
task
to
distinguish between
the
pore
throats
and
pore bodies
in
irregular porous structure (Lymberopoulos
and
Payatakes,
1992).
Interconnectivity
of
pores
is a
parameter determining
the
porosity
of
the
porous media
effective
in its
fluid
flow
capability.
In
this respect,
the
pores
of
porous media,
as
sketched
in
Figure 3-6,
are
classified
in
three groups:
1.
Connecting pores which have
flow
capability
or
permeability (conductor),
2.
Dead-end pores which have
storage
capability (capacitor),
and
2
Non-connecting pores which
are
isolated
and
therefore
do not
contribute
to
permeability (nonconductor).
The
interconnectivity
is
measured
by the
coordination number,
defined
as the
number
of
pore throats emanating
from
a
pore body. Typically, this
56
Reservoir
Formation
Damage
Figure
3-4.
Description
of the
pore
volume
attributes
(after
Civan,
©1994;
reprinted
by
permission
of the
U.S.
Department
of
Energy).
number
varies
in the
range
of 6
<
Z
<
14
(Sharma
and
Yortsos,
1987).
For
cubic
packing,
Z = 6 and
<J>
= 1 -
n/6.
The
coordination number
can be
determined
by
nitrogen sorption measurements
(Liu
and
Seaton, 1994).
Pore
and
Pore Throat Size Distributions
Typical
measured pore body
and
pore throat sizes, given
by
Ehrlich
and
Davies
(1989)
are
shown
in
Figure
3-7.
Figure
3-8
shows
the
pore throat
size
distribution
measured
by
Al-Mahtot
and
Mason (1996).
The
mathematical
representation
of the
distribution
of the
pore body
and
pore throat sizes
in
natural
porous media
can be
accomplished
by
various statistical means.
The
three
of the
frequently
used approaches
are the
following:
1.
Log-Normal Distribution
(not
representative)
2.
Bi-Model
Distribution
(fine
and
course
fractions)
3.
Fractal Distribution
Log-Normal
Distribution.
Because
of is
simplicity,
the
log-normal
distribution
function
given below
has
been used
by
many, including Ohen
and
Civan
(1991):
F(D)
=
(2^
J
D)-
1/2
expj-|[ln(D/Z)
m
)/^]
2
j, 0
<£><<*>
(3-16)


![Adamsen, Paul B. - Frameworks for Complex System Development [CRC Press 2000] Episode 1 Part 3 docx](https://media.store123doc.com/images/document/2014_08/07/medium_rxe1407381622.jpg)