Reservoir Formation Damage Episode 1 Part 6 docx
Bạn đang xem bản rút gọn của tài liệu. Xem và tải ngay bản đầy đủ của tài liệu tại đây (1.21 MB, 25 trang )
Characterization
of
Reservoir
Rock
107
X-Ray
Diffraction
(XRD)
The
X-ray powder diffraction analysis
(XRD)
is a
nondestructive
technique
that
can
provide
a
rapid
and
accurate mineralogical analysis
of
less than
4
micron size, bulk
and
clay contents
of
sedimentary rock
samples (Amaefule
et
al.,
1988).
This
is
accomplished
by
separately
analyzing
the
clays
and the
sand/silt constituents
of the
rock samples
(Kersey,
1986).
The
X-ray
diffraction
technique
is not
particularly sensitive
for
noncrystalline materials, such
as
amorphous silicates
and,
therefore,
an
integrated application
of
various techniques, such
as
polarized light
microscopy, X-ray
diffraction,
and
SEM-EDS analyses,
are
required
(Braun
and
Boles, 1992).
Hayatdavoudi
(1999)
shows
the
typical X-ray
diffraction
patterns
of the
bulk
and the
smaller than
4
micron size clay
fractions
present
in a
core
sample.
X-Ray
CT
Scanning
(XRCT)
X-Ray
CT
(computer-assisted tomography) scanning
is a
nondestructive
technique,
which provides
a
detailed,
two-
and
three-dimensional exami-
nation
of
unconsolidated
and
consolidated core samples during
the
flow
of
fluids,
such
as
drilling muds, through core plugs
and
determines such
data like
the
atomic number, porosity, bulk density,
and
fluid
satura-
tions (Amaefule
et
al.,
1988;
Unalmiser
and
Funk,
1998).
This
technique
has
been adapted
from
the
field
of
medical radiology (Wellington
and
Vinegar, 1987).
As
depicted
by
Hicks
Jr.
(1996), either
an
X-ray source
is
rotated
around
a
stationary core sample
or the
core sample
is
rotated while
the
X-ray source
is
kept
stationary.
The
intensity
of the
X-rays passing
through
the
sample
is
measured
at
various angles across
different
cross
sections
of the
core
and
used
to
reconstruct
the
special features
of the
porous material.
The
operating principle
is
Beer's
law,
which relates
the
intensity
of the
X-ray, through
the
linear attenuation coefficient,
to
the
physical properties
of
materials
and
different fluid phases
in the
sample (Wellington
and
Vinegar,
1987;
Hicks
Jr.,
1996).
A
schematic
of
a
typical X-ray scanning apparatus
is
shown
by
Coles
et al.
(1998).
The
image patterns
can be
constructed using
the
linear attenuation
coefficient
measured
for
sequential cross-sectional slides along
the
core sample
as
shown
by
Wellington
and
Vinegar
(1987).
These
allow
for
reconstruction
of
vertical
and
horizontal, cross-sectional images, such
as
shown
by
Wellington
and
Vinegar
(1987).
Three-dimensional images
can be
recon-
structed
from
the
slice
images
as
illustrated
by
Coles
et al.
(1998).
Tremblay
et al.
(1998) show
the
cross-sectional
and
longitudinal images
of
a
typical wormhole, perceived
as a
high permeability channel, growing
108
Reservoir
Formation
Damage
in
a
sand-pack. Such images provide valuable insight
and
understanding
of
the
alteration
of
porous rock
by
various processes.
X-Ray
Fluoroscopy (XRF)
The
X-Ray
fluoroscopy
technique
is
used
for
determining
the
drilling
mud
invasion
profiles
in
unconsolidated
and
consolidated core samples
and
it is
especially convenient
for
testing unconsolidated, sleeved core
samples (Amaefule
et
al.,
1988).
Amaefule
et
al.
(1988) show
a
typical
X-ray
fluoroscopic
image.
Scanning Electron Microscope (SEM)
The
rock
and
fluid
interactions causing formation damage
is a
result
of
direct contact of the pore
filling
and pore lining minerals present
in
the
pore
space
of
petroleum-bearing formations.
The
mineralogical
analysis,
abundance, size,
and
topology
and
morphology
of
these minerals
can be
observed
by
means
of the
scanning electron microscopy (SEM)
(Kersey,
1986;
Amaefule
et
al.,
1988). Braun
and
Boles (1992) caution
that,
although
the SEM can
provide qualitative
and
quantitative chemical
analyses,
it
should
be
combined with other techniques, such
as the
polarized light microscopy (PLM)
and the
X-ray
diffraction
(XRD)
to
characterize
the
crystalline
and
noncrystalline
phases, because amorphous
materials
do not
have distinct morphological properties.
An
energy
dispersive spectroscopy (EDS) attachment
can be
used during
SEM
analysis
to
determine
the
iron-bearing minerals (Amaefule
et
al.,
1988).
Various
specific implementations
of the SEM are
evolving.
For
example,
the
environmental
SEM has
been used
to
visualize
the
modification
of
the
pore structure
by the
retention
of
deposits
in
porous media
(Ali
and
Barrufet,
1995).
The
cryo-scanning
electron microscopy
has
been used
to
visualize
the
distribution
of
fluids
in
regard
to the
shape
and
spatial
distribution
of the
grains
and
clays
in the
pore
space (Durand
and
Rosenberg, 1998).
The SEM has
also been used
for
investigation
of the
reservoir-rock wettability
and its
alteration (Robin
and
Cuiec,
1998;
Durand
and
Rosenberg, 1998).
The SEM
operates based
on the
detection
and
analysis
of the
radiations
emitted
by a
sample when
a
beam
of
high energy electrons
is
focused
on
the
sample
(Ali
and
Barrufet, 1995).
It
allows
for
determination
of
various properties
of the
sample, including
its
composition
and
topography
(Ali
and
Barrufet, 1995).
Typical
SEM
photomicrographs
are
shown
by
Amaefule
et al.
(1988).
The
environmental
SEM
images shown
by Ali and
Barrufet (1995)
illustrate
the
modification
of the
pore structure
by
polymer retention
in
Characterization
of
Reservoir
Rock
109
porous media.
As can be
seen
by
these examples,
the SEM can
provide
very
illuminating insight into
the
alteration
of the
characteristics
of the
porous structure
and its
pore
filling
and
pore lining substances.
Thin Section Petrography (TSP)
The
thin
section petrography technique
can be
used
to
examine
the
thin sections
of
core samples
to
determine
the
texture, sorting, fabric,
and
porosity
of the
primary, secondary,
and
fracture types,
as
well
as
the
location
and
relative abundance
of the
detrital
and
authigenic clay
minerals
and the
disposition
of
matrix minerals, cementing materials,
and
the
porous structure (Kersey,
1986;
Amaefule
et
al.,
1988).
Amaefule
et
al.
(1988) show
the
examples
of
typical
thin
section photomicrographs.
Petrographic Image Analysis
(PIA)
As
stated
by
Rink
and
Schopper (1977),
"The
physical properties
of
sedimentary
rocks
strongly depend
on the
geometrical
structure
of
their
pore space. Thus,
a
geometrical analysis
of the
pore structure
can
provide
valuable information
in
formation evaluation."
The
petrographic image
analysis
(PIA) technique analyzes
the
photographs
of the
cuttings, thin
sections,
or
slabs
of
reservoir
core
samples using
high-speed
image
analysis
systems
to
infer
for
important petrophysical properties, including
textural parameters, grain size
and
distribution, topography,
directional
dependency
of
textural features, pore body
and
pore throat sizes, porosity,
permeability, capillary
pressure,
and
formation factor (Amaefule
et
al.,
1988; Rink
and
Schopper, 1997; Oyno
et
al.,
1998).
The
images
of the
rock surfaces
can be
obtained
by
photographing
on
paper using standard cameras
or
digital video cameras attached
to a
microscope,
but
computer-aided digital
storage
and
analysis
of
images
provide many advantages (Oyno
et
al.,
1998). Saner
et al.
(1996) show
typical thin
section
photomicrographs
of
typical carbonate lithofacies.
The
photographs shown
by
Ehrlich
et al.
(1997) indicate
the
packing
flaws
in
typical sandstone samples. Coskun
and
Wardlaw
(1996)
show
the
porel
size spectra
and
binary images
of
five
pore types
of
some North
Sea
sandstones. Such images
can be
analyzed
by
various techniques
to
deter-
mine
the
textural attributes
and to
derive
the
petrophysical characteristics
of
the
petroleum-bearing formation (Rink
and
Schopper,
1977;
Ehrlich
et
al.,
1997;
Coskun
and
Wardlaw,
1993, 1996;
loannidis
et
al.,
1996).
Polarized Light Microscopy (PLM)
The
polarized light microscopy (PLM) technique
can be
utilized
for
effectively
detecting amorphous substances
in
porous media because,
110
Reservoir
Formation
Damage
being optically isotropic, amorphous substances
can be
distinguished
from
the
majority
of the
crystalline
matter, except
for the
optically
isotropic
halides
(Braun
and
Boles, 1982).
The
polarized light microscopy
is
based
on
distinguishing between various substances
by the
difference
in
their
refractive
indices. Braun
and
Boles (1982) recommend supporting
the
PLM
method
by at
least another method, such
as the
scanning electron
microscopy combined with
the
energy
dispersive
X-ray spectrometry
(SEM-EDS)
and the
X-ray
diffraction
(XRD) method.
Nuclear Magnetic Resonance Spectroscopy (NMR)
The
nuclear magnetic
resonance
spectropy
is a
nondestructive tech-
nique,
which measures
the
spin-lattice
and
spin-spin relaxation times
by
means
of the
radio-frequency resonance
of
protons
in a
magnetic
field
to
infer
for the
petrophysical parameters, including porosity, permeability,
and
free
and
bound
fluids
using specially derived correlations (Unalmiser
and
Funk,
1998;
Rueslatten
et
al.,
1998).
Because fines mobilization,
migration,
and
retention
in
porous media causes porosity variation,
the
NMR can
also
be
used
for
examination
of
core plugs during
fines
invasion.
For
example, Fordham
et al.
(1993) examined
the
invasion
of
clay particles within natural sedimentary rocks
by
injection
of
suspension
of
clay
particles
using
the NMR
imaging technique. Fordham
et al.
(1993)
show that
the
proton spin-lattice relaxation time profiles measured
at
different
times indeed indicate
the
effect
of
clay
fines
invasion into core
plugs. This information
can be
used
to
determine
the
penetration depth
of
the
clay
fines
and the
effect
of
fines
invasion
to
permeability. Xiao
et
al.
(1999)
state
that:
The NMR
(nuclear magnetic resonance) techniques, namely
NMRI
(nuclear
magnetic resonance imaging)
and
NMRR (nuclear magnetic
resonance relaxation),
can
support
the
observations obtained with
the
return
permeability
tests,
helping
in the
identification
and
comprehension
of the
formation damage mechanisms caused
by
solids
and
filtrate
invasion
in the
pores
of a
reservoir rock.
However,
the NMR
techniques
are
expensive
and
time consuming,
and
better
suited
for in
depth studies (Xiao
et
al.,
1999).
Xiao
et al.
(1999)
show
typical
NMR
images
and
relaxation time curves
on
invasion
of
a
typical bentonite/mixed metal hydroxide (MMH)/sized carbonate
mud
system into
a
core plug.
The
core plug images provided visual
inspections
for the
core initially saturated with
a 3%
NH
4
Cl
brine, then
contaminated
by mud
invasion,
and
finally
back
flushed
with brine
for
mud
removal, respectively.
Characterization
of
Reservoir
Rock
111
Acoustic Techniques (AT)
The
acoustic techniques facilitate acoustic-velocity signatures
and
correlations
of the
acoustic properties
of
rocks
to
construct acoustic
velocity tomograms
to
image
the
rock
damage
by
deformation, such
as
elastic
and
dilatant deformations,
pore
collapse,
and
normal consolidation
processes (Scott
et
al.,
1998). Scott
et
al.
(1998) describe
the
acoustic
velocity
behaviors during compaction
of
reservoir rock samples. Scott
et
al.
(1998) show
a
schematic
of a
confined-indentation experiment used
and
the
acoustic velocity tomograms obtained
by the
indentation tests.
Cation
Exchange Capacity (CEC)
The
total amount
of
ions (anions
and
cations) that
are
present
at the
clay
surface
and
exchangeable with
the
ions
in an
aqueous solution
in
contact
with
the
clay surface,
is
referred
to as the
ion-exchange capacity
(IEC)
of the
clay minerals
and it is
measured
in
meq/100
g
(Kleven
and
Alstad, 1996).
The
total
ion-exchange
capacity
is
therefore equal
to the
sum
of the
cation-exchange capacity
(CEC}
and the
anion-exchange
capacity
(AEC):
IEC
=
CEC
+ AEC
(6-1)
During
reservoir exploitation, when brines
of
different
composition than
the
reservoir brines enter
the
reservoir formation,
an
ion-exchange process
may
occur, activating various processes leading
to
formation damage
(see
Chapter
13).
In the
literature, more emphasis
has
been given
to the
measurement
of the
cation-exchange capacity, because
it is the
primary
culprit,
responsible
for
water sensitivity
of
clayey formations (Hill
and
Milburn,
1956;
Thomas,
1976;
Huff,
1987;
Muecke,
1979;
Khilar
and
Fogler,
1983,
1987).
The
mechanisms,
by
which aqueous ions interact with
the
clay minerals
present
in
petroleum-bearing rock, have been
the
subject
of
many studies.
Kleven
and
Alstad
(1996)
identified
two
different
mechanisms:
(1)
lattice
substitutions
and (2)
surface edge reactions.
The first
mechanism involves
the
ion-exchange within
the
lattice
structure
itself,
by
substitution
of
A/
3+
for
57
4+
,
Mg
2+
for
A/
3+
,
as
well
as
other ions
to a
lesser
degree,
and
does
not
depend
on the
ionic strength
and pH of the
aqueous solution (Kleven
and
Alstad,
1996).
The
second mechanism involves
the
reactions
of the
functional
groups
present along
the
edges
of the
silica-alumina units
and it is
affected
by
the
ionic strength
and pH of the
aqueous solution (Kleven
and
Alstad,
1996).
The
relative contributions
of
these mechanisms vary
by the
clay
mineral types.
It
appears that montmorillonite
and
illite primarily undergo
112
Reservoir
Formation
Damage
lattice substitutions,
and
surface edge reactions
are
dominant
for
kaolinite
and
chlorite (Kleven
and
Alstad, 1996). Expansion
of
swelling clays, such
as
montmorillonite, increases their surface area
of
exposure and, therefore,
their cation-exchange capacity (Kleven
and
Alstad,
1996).
Theoretical
description
of the
ion-exchange reactions between
the
aqueous phase
and
the
sedimentary formation minerals
is
very complicated because
of
various
effects,
including
ion
composition,
pH,
and
temperature (Kleven
and
Alstad, 1996).
The
methods used
for
measurement
of the
ion-exchange capacity vary
by
the
reported studies.
For
example, Kleven
and
Alstad
(1996)
measured
the CEC of
clays using
Ca
2+
brines without
the
presence
of
NaCl
and
measured
the AEC
using
SO%~
brines. Rhodes
and
Brown (1994) point
out the CEC
measurement
of
clays
by
commonly used methods, such
as
the
ammonium
ion and
methylene blue
dye
adsorption methods, have
inherent
shortcomings, leading
to
inaccurate results. Therefore, Rhodes
and
Brown
(1994)
have used
the
adsorption
of the
colored
Co(H
2
O)
ion,
which yields
a
very stable hydrated
Co(If)
complex. Rhodes
and
Brown
(1994)
have determined that
the
CECs
of
four
different
Na
+
-
montmorillonites measured
by
three
different
adsorption methods
differ
appreciably.
The
methylene blue adsorption method generates significantly
different
results
from
the
cobalt
and
ammonium
ion
adsorption methods,
which
agree
with each other within acceptable tolerance.
Because
the
ion-exchange reactions
in
petroleum-bearing rock
are
usually
treated
as
equilibrium reactions
for
practical purposes, ion-exchange isotherms
relating
the
absorbed
and the
aqueous phase
ion
contents
in
equilibrium
conditions
are
desirable.
For
example, Kleven
and
Alstad
(1996)
deter-
mined
the
cation-exchange isotherms shown
in
Figures
6—4,
6-5,
and
6-6,
respectively,
for
single cation-exchange reactions involving
Ca
2+
->
Na
+
(6-2)
and
Ba
l+
->
Na
+
and
binary cation exchange reactions involving
Ca
2+
+
Ba
2+
->
Na
+
(6-3)
(6-4)
Similarly, Figure
6-7 by
Kleven
and
Alstad
(1996)
shows
the
typical
anion-exchange isotherms
for a
single anion-exchange reaction involving
SOl
~^
d
•
When more than
one
ions
are
present
in the
system, some
are
preferentially
more
strongly adsorbed than
the
others depending
on
Characterization
of
Reservoir Rock
113
Calcium
ions
in
solution,
meq/L
Figure
6-4. Calcium-sodium ion-exchange isotherms (circles
=
kaolinite,
squares
=
montmorillonite, open figures
=
20°C,
and
closed figures
=
70°C)
(Reprinted
from Journal
of
Petroleum Science
and
Engineering, Vol.
15,
Kleven,
R.,
and
Alstad,
J.,
"Interaction
of
Alkali, Alkaline-Earth
and
Sulphate
Ions
with Clay
Minerals
and
Sedimentary Rocks,"
pp.
181-200,
©1996,
with
permission from Elsevier Science).
14
12
S
10
10
20 30 40
Barium
Ions
In
solution,
meq/L
Figure
6-5.
Barium-sodium
ion-exchange isotherms (circles
=
kaolinite,
squares
=
montmorillonite, open figures
=
20°C,
and
closed figures
=
70°C)
(Reprinted from Journal
of
Petroleum Science
and
Engineering, Vol.
15,
Kleven,
R.,
and
Alstad,
J.,
"Interaction
of
Alkali,
Alkaline-Earth
and
Sulphate
Ions with Clay Minerals
and
Sedimentary Rocks,"
pp.
181-200,
©1996,
with
permission
from Elsevier
Science).
114
Reservoir Formation Damage
14
12
10
0 10 20 30 40 50
Calcium
and
barium ions
in
solution,
meq/L
Figure
6-6.
Calcium (open figures)
and
barium (closed figures) ion-exchange
isotherms
at
70°C (circles
=
kaolinite
and
squares
=
montmorillonite)
(Reprinted from Journal
of
Petroleum Science
and
Engineering, Vol.
15,
Kleven,
R., and
Alstad,
J.,
"Interaction
of
Alkali, Alkaline-Earth
and
Sulphate
Ions with Clay Minerals
and
Sedimentary Rocks,"
pp.
181-200,
©1996, with
permission from Elsevier Science).
0,5
0,3
0,2
0,1
0,2
0,4 0.6
Sulphate
Ions
In
solution,
meq/L
0,8
Figure
6-7. Sulfate-chloride ion-exchange isotherms
at low
sulfate
concentrations
(circles
=
kaolinite,
squares
=
montmorillonite,
open
figures
=
20°C,
and
closed figures
=
70°C) (Reprinted from Journal
of
Petroleum
Science
and
Engineering, Vol.
15,
Kleven,
R.,
and
Alstad,
J.,
"Interaction
of
Alkali, Alkaline-Earth
and
Sulphate Ions with Clay Minerals
and
Sedimentary
Rocks,"
pp.
181-200,
©1996, with permission from Elsevier Science).
Characterization
of
Reservoir Rock
115
the
affinities
of the
clay minerals
for
different
ions. This phenomenon
is
referred
to as the
selectivity. Kleven
and
Alstad
(1996)
have determined
that
the
kaolinite
and
montmorillonite clays
prefer
Ba
2+
over
Ca
2+
,
as
indicated
by the
normalized cation-exchange isotherms shown
in
their
Figure 6-8. Similarly, their Figure
6-9
showing
the
normalized anion-
exchange
isoterms
indicate that
the
kaolinite clay prefers
5O|~
over
Cl~.
Figure
6-8
also shows that
the
selectivity
is
also
influenced
by the
swelling properties
of
clays.
It is
apparent that
the
affinity
of
divalent
cations (such
as
Ca
2+
)
over monovalent cations (such
as
Na
+
)
is
much higher
for
kaolinite
(nonswelling
clay) than montmorillonite (swelling clay).
Petroleum-bearing formations contain various metal
oxides,
includ-
ing
Fe
2
O
3
,
Fe
3
O
4
,
MnO
2
,
and
SiO
2
.
Tamura
et
al.
(1999)
propose
a
hydroxylation
mechanism that
the
exposure
of
metal oxides
to
aqueous
solutions causes water
to
neutralize
the
strongly
base
lattice oxide ions
to
transform them
to
hydroxide
ions,
according
to
(6-5)
Hence,
the
ion-exchange capacity
of the
metal oxides
can be
measured
by
determining
the
hydroxyl site densities
on
metal oxides
by
various
'0
0.2
0,4
0,6 0,8 1
Extractions
of
calcium
ions
In
solution
at
equilibrium
Figure
6-8.
Normalized calcium-sodium ion-exchange isotherms (circles
=
kaolinite, squares
=
montmorillonite, open figures
=
20°C,
and
closed figures
=
70°C) (Reprinted from Journal
of
Petroleum Science
and
Engineering,
Vol.
15,
Kleven,
R., and
Alstad,
J.,
"Interaction
of
Alkali,
Alkaline-Earth
and
Sulphate Ions with Clay Minerals
and
Sedimentary Rocks,"
pp.
181-200,
©1996, with permission from Elsevier Science).
116
Reservoir Formation Damage
0,2
0,4 0.6 0,8 1
Eq.
fractions
of
sulphate
Ions
In
solution
Figure
6-9.
Normalized sulfate-chloride ion-exchange isotherms (circles
=
kaolinite,
squares
=
montmorillonite,
open figures
=
20°C,
and
closed figures
=
70°C) (Reprinted
from
Journal
of
Petroleum Science
and
Engineering,
Vol.
15,
Kleven,
R., and
Alstad,
J.,
"Interaction
of
Alkali, Alkaline-Earth
and
Sulphate Ions with Clay Minerals
and
Sedimentary Rocks,"
pp.
181-200,
©1996, with permission from Elsevier Science).
methods, including
reactions
with Grignard
reagents,
acid-base
ion-
exchange reactions, dehydration
by
heating, infra-red
(IR)
spectroscopy,
tritium
exchange
by
hydroxyl,
and
crystallographic calculations
(Tamura
et
al.,
1999).
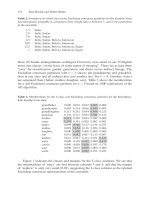
Figure
6-10
by
Tamura
et
al.
(1999)
shows
a
typical
isotherm
for
OH~
ion for
hematite. Figure
6-11
by
Arcia
and
Civan
(1992)
show that
the
cation-exchange capacity
of the
cores extracted
from
reservoirs
may
vary significantly
by the
clay content.
5
(Zeta)-Potential
When
an
electrolytic
solution flows through
the
capillary paths
in
porous media,
an
electrostatic potential difference
is
generated along
the
flow
path because
of the
relative
difference
of the
anion
and
cation
fluxes.
Because
the
mobility
of the
ions
is
affected
by the
surface charge, this
potential
difference, called
the
zeta-potential,
can be
used
as a
measure
of
the
surface charge
(Sharma,
1985).
The
zeta-potential
can be
measured
by
various methods, including
potentiometric
titration, electrophoresis,
and
streaming
potential.
Characterization
of
Reservoir Rock
117
[OH1
free
/moldm'
3
Figure
6-10.
Hydroxyl-hematite ion-exchange isotherm indicating
the
amount
of
hydroxyl
ion
consumed
per
unit surface area
of
hematite
vs. the
hydroxyl
ion
concentration
in
solution
(after
Tamura
et
al.,
1999;
reprinted
by
permis-
sion
of the
authors
and
Academic Press).
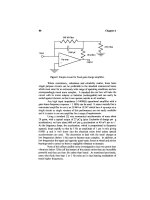
The
Helmholtz-Smoluchowski equation
of the
zeta-potential
for
gran-
ular porous media
is
given
by
Johnson (1999)
as:
r
4rcuX
dU
dp
(6-6)
based
on the
cylindrical capillary bundle
of
tubes model.
In Eq.
6-6,
£
denotes
the
zeta-potential
of the
capillary surface,
|i
is the
viscosity,
(££
0
)
is the
permittivity,
(dU I dp) is the
streaming potential pressure gradient,
U
is
the
streaming potential,
p is
pressure,
A and
L
are the
cross-sectional area
and
length
of
porous media, respectively,
(j)
is the
porosity,
and R is the
electrical resistance. Figures
6-12
and
6-13
by
Johnson (1999) show
the
dependency
of the
zeta-potential
on the
ionic strength
and pH of the
aqueous
solution, obtained
by the
electrophoresis
and
streaming potential methods.
Wettability
Wettability
of the
pore
surface
is one of the
important factors
influenc-
ing
the
distribution
and
transport
of
various
fluid
phases
and
therefore
the
extent
of
formation damage
in
petroleum-bearing formations. Because
118
Reservoir Formation Damage
6,0
-
O
2.0-
o.o
0.0
2.0 4,0
Clay
Content.
(%)
6,0
Figure
6-11.
Cation exchange capacity
of the
various Ceuta field core
samples
by
Maraven
S.
A.,
Venezuela
(Arcia
and
Civan, ©1992; reprinted
by
permission
of the
Canadian Institute
of
Mining, Metallurgy
and
Petroleum).
the
wettability
of
rocks
is
altered
by the
rock
and
fluid
interactions
and
variations
of the
reservoir
fluid
conditions, prediction
of its
effects
on
formation
damage
is a
highly complicated issue. Although mineral matters
forming
the
reservoir rocks
are
generally water-wet, deposition
of
heavy
organic matter, such
as
asphaltenes
and
paraffines,
over
a
long reservoir
lifetime
may
render them mixed-wet
or
oil-wet, depending
on the
compo-
sition
of the oil and
reservoir conditions. Wettability
may be
expressed
by
various means, including
the
Amott
and
USBM indices. (See Chapter
4.)
During reservoir exploitation, wettability
may
vary
by
various reasons.
For
example, Figure 6-14
by
Burchfield
and
Bryant (1988)
is an
evidence
of
the
alteration
of the
wettability
of a
water-wet berea sandstone
to a
stronger
water-wet
state
in
contact with microbial solutions. Madden
and
Strycker
(1988)
determined
that
the
wettability
of the
Berea
sandstone
saturated with oils
vary
by
their asphaltene
and
polar components content
Characterization
of
Reservoir Rock
119
C
0)
O
0.
-40-
-60-
Electrophoresis
Streaming
Potential
10"
10
V
Ionic
Strength
[M]
Figure
6-12.
Comparison
of
electrokinetic measurement methods
at
various
KCI
ionic strengths
in the
4.4-5.8
pH
range (Johnson,
1999;
reprinted
by
permission
of the
author
and
Academic Press).
>
I—J
Is
1
o
Q.
^
20-
10-
0-
-10-
-20-
-30-
-40-
-50-
-60-
C
.
I
—
•
—
Electrophoresis
I
—
*
—
Streaming
Potential
-
I
I\
1
:
I
V
\\
\\
^V-i—.
^*
a
*v"
M:
,
~-^^
—
*^^
_
2
4 6 8 10 1:
PH
Figure
6-13.
Comparison
of
electrokinetic measurement methods
at
various
pH
values, with
the
initial
solution
of
1(T
3
M
KCI
(Johnson,
1999;
reprinted
by
permission
of the
author
and
Academic Press).
120
Reservoir
Formation
Damage
CP2-CONTROL
CP3
-
NIPER
BAG
-1
LOG
-—
=
0739
20
30 40 50
70
20 30 40 50 60 70 20 30 40 60 60
Swi,
%
WATER
SATURATION,
9!
Figure
6-14.
Effect
of
microbial
solutions
on the
capillary
pressure
curve
and
wettability index
(after
Burchfield
and
Bryant,
1989;
reprinted
by
permission
of
the
U.S.
Department
of
Energy).
and
temperature. Figure
6-15
by
Madden
and
Strycker
(1988)
depicts
the
shifting
of the
wettability curves
by
temperature.
Mineral
Quantification
Knowledge
of the
types, quantities,
and
conditions
of the
minerals
forming
the
petroleum-bearing rocks
is
important
for
assessment
of
their
formation
damage potential
and
design preventive
and
stimulation tech-
niques
to
alleviate
formation
damage.
As
stated
by
Chakrabarty
and
Longo
(1997), "Minerals
are
usually
quantified
using mineral properties available
from
published data
and
rock
properties
measured
in the
laboratory
used
cored samples
or in the
field
using geochemical well
logs."
In
the
literature, several approaches have been proposed
for
this purpose.
For
example,
the
rapid mineral quantification method developed
by
Chakrabarty
and
Longo (1997)
can be
used
for
quantification
of
minerals
both
in the
laboratory
and
downhole. They begin
by
expressing
each measured rock property,
y
{
,
as a
mass fraction,
f
t
,
weighted
sum
Characterization
of
Reservoir
Rock
121
150
'
F
Wettability
Curve
250
• F
Wettability
Curve
20
30 40 50
AVERAGE
WATER
SATURATION,
%
Figure
6-15.
Effect
of
temperature
on the
capillary
pressure
curve
(Madden
and
Strycker,
1989;
reprinted
by
permission
of the
U.S.
Department
of
Energy).
of
the
properties,
x
tj
,
of the
minerals present
in the
rock
by the
property
balance equation:
(6-7)
or in
matrix
form
(6-8)
where
n and p
denote
the
number
of
rock properties measured
and the
number
of
different
mineral phases present
in the
rock, respectively,
and
£,
denotes
the
measurement error. Because,
the
mineral properties,
x
tj
,
can be
obtained
from
the
literature,
the
mineral compositions,
^:1,2, ,«,
can
be
calculated
by
solving
the set of
linear algebraic equations formed
by
Eq.
6-7.
The
system, represented
by Eq.
6-8,
is
under-determined when
the
number
of
measured rock properties
is
less
than
the
number
of
122
Reservoir Formation Damage
different
minerals present
in the
rock,
and
over-determined, otherwise,
and
determined when they
are
equal.
In
order
to
handle both
of
these cases
and
alleviate
any
instability
problems
associated
with
the
solution
of
Eq.
6-8,
Chakrabarty
and
Longo
(1997)
supplemented
the
property
balance equation
(Eq. 6-8)
with
the
following constraining equation:
c
= C' f +
u
(6-9)
This equation incorporates
any
prior information available
or
initial
guesses
on the
fractional compositions
of the
minerals present
in
rocks,
in
which
c is a
vector
of the
initial
guesses
of the
mineral fractions,
C is
a
unit diagonal matrix,
and
u
is a
vector
of
errors
associated with
the
initial
guesses
of the
fractions
of the
various minerals.
Chakrabarty
and
Longo (1997), then, combines
Eqs.
6-8 and 9 as:
X'f
C'f
(6-10)
from
which,
the
estimates
of the
mineral
fractions
is
expressed
by:
=
[X
T
•
{V(e)}~
1
*
X
+
C
T
'
{V(u)}
(6-11)
The
superscripts
"7"
and
"-1"
refer
to the
transpose
and
inverse
of the
matrices, respectively.
V(e)
and
V(u)
are
diagonal matrices, whose
ele-
ments
are the
error variances (standard deviations)
of the
measured rock
properties
and the
initial guesses
of the
mineral fractions, respectively.
Chakrabarty
and
Longo
(1997)
expressed
the
variances
of the
mineral
fractions
by:
v(f)
= [x
-X+C
-
c
(6-12)
which
is the
same
as the
first
part
of Eq.
6-11.
Using
Eq. 6-8
without
the
error term
and Eq.
6-11,
the
rock properties
are
estimated
by:
y
=
(6-13)
Characterization
of
Reservoir Rock
123
and
therefore
the
deviations
of the
measured
and
estimated rock properties
are
given
by:
e
=
f-f*
(6-14)
Then, Chakrabarty
and
Longo
(1997)
determine
the
goodness
of the
estimates
of the
mineral
fractions
by the
following
sum of the
squares
of
the
deviations:
(6-15)
As
stated
by
Chakrabarty
and
Longo (1997),
the
chemical laboratories
measuring
the
rock properties usually also provide
the
standard deviations
of
the
measured properties. Similarly,
the
service companies
running
the
wireline logs
can
provide
the
standard deviations
of the
geochemical well
logging. They suggest that
the XRD
pattern
can
provide
the
initial
estimates
of the
mineral fractions. Otherwise,
a
reasonable initial guess,
such
as
evenly distributed mineral
fractions
can be
used.
Chakrabarty
and
Longo
(1997)
demonstrated their method,
called
the
modified
matrix algebra-based method,
by
several examples. Chakrabarty
and
Longo
(1997)
show satisfactory comparisons
of the
measured
and
predicted properties
of the
various rock samples.
References
Ali,
L., &
Barrufet,
M.
A.,
"Study
of
Pore Structure Modification Using
Environmental
Scanning Electron Microscopy," Journal
of
Petroleum
Science
and
Engineering, Vol.
12,
1995,
pp.
323-338.
Amaefule,
J. O.,
Kersey,
D. G.,
Norman,
D.
L.,
&
Shannon,
P.
M.,
"Advances
in
Formation Damage Assessment
and
Control
Strategies,"
CIM
Paper
No.
88-39-65,
Proceedings
of the
39th Annual Technical
Meeting
of
Petroleum Society
of CIM and
Canadian
Gas
Processors
Association, Calgary, Alberta, June
12-16,
1988,
16 p.
Appel,
M.,
Stallmach,
R,
&
Thomann,
H.,
"Irreducible
Fluid Saturation
Determined
by
Pulsed Field Gradient NMR, Journal
of
Petroleum
Science
and
Engineering, Vol.
19,
1998,
pp.
45-54.
Arcia,
E.
M.,
&
Civan,
F.,
"Characterization
of
Formation Damage
by
Particulate
Processes,"
Journal
of
Canadian Petroleum
Technology,
Vol.
31,
No. 3,
1992,
pp.
27-33.
Braun,
G.,
&
Boles,
J.
L.,
"Characterization
and
Removal
of
Amorphous
Aluminosilicate
Scales,"
SPE
24068 paper, Proceedings
of the SPE
Western Regional Meeting, Bakersfield, California, March
30-April
1,
1982,
pp.
389-398.
124
Reservoir
Formation
Damage
Burchfield,
T. E., &
Bryant,
R. S.,
"Development
of
MEOR Processes
for
Use in
Field
Applications,"
1988
Annual Report, Work Performed
Under
Cooperative Agreement
No.
FC22-83FE60149,
for the
U.S. Department
of
Energy, Bartlesville Project
Office,
Bartlesville,
Oklahoma, September
1989,
pp.
69-73.
Chakrabarty,
T.,
&
Longo,
J. M., "A New
Method
for
Mineral
Quantification
to Aid in
Hydrocarbon Exploration
and
Exploitation," Journal
of
Canadian Petroleum Technology,
Vol.
36, No. 11, pp.
15-21.
Coles,
M.
E.,
Hazlett,
R. D.,
Spanne,
P.,
Soil,
W.
E.,
Muegge,
E. L., &
Jones,
K.
W.,
"Pore
Level Imaging
of
Fluid Transport Using Synchrotron
X-Ray
Microtomography,"
Journal
of
Petroleum
Science
and
Engineering,
Vol.
19,
1998,
pp.
55-63.
Coskun,
S. B., &
Wardlaw,
N. C.,
"Estimation
of
Permeability
from
Image
Analysis
of
Reservoir
Sandstones—Image
analysis
for
estimating
ultimate
oil
recovery
efficiency
by
waterflooding
for two
sandstone
reservoirs," Journal
of
Petroleum Science
and
Engineering,
Vol.
10,
1993,
pp.
1-16, Vol.
15,
1996,
pp.
237-250.
Cuiec,
L.,
&
Robin,
M.,
"Two
SEM
Techniques
to
Investigate Reservoir-
Rock
Wettability,"
Journal
of
Petroleum Technology, November
1998,
pp.
77-79.
Doublet,
L.
E.,
Pande,
P.
K.,
Clark,
M.
B.,
Nevans,
J.
W.,
Vessell,
R.,
&
Blasingame,
T.
A.,
SPE
29594 paper, Proceedings
of the
1995
SPE
Joint Rocky Mountain
and Low
Permeability Reservoirs Symposium,
Denver,
Colorado, March
19-22, 1995,
pp.
13-38.
Durand,
C.,
&
Rosenberg,
E.,
"Fluid Distribution
in
Kaolinite-
or
Illite-
Bearing Cores: Cryo-SEM Observations Versus Bulk Measurements,"
Journal
of
Petroleum Science
and
Engineering, Vol.
19,
Nos. 1/2, 1998,
pp.
65-72.
Ehrlich,
R.,
Prince,
C.,
&
Carr,
M.
B.,
"Sandstone
Reservoir Assessment
and
Production
is
Fundamentally
Affected
by
Properties
of a
Char-
acteristic Porous
Microfabric,"
SPE
38712 paper, Proceedings
of the
1997
SPE
Annual Technical Conference
and
Exhibition,
San
Antonio,
Texas, October
5-8, 1997,
pp.
591-599.
Fordham,
E.
J.,
Horsfield,
M.
A.,
Hall,
L.
D.,
&
Maitland,
G.
C.,
"Depth
Filtration
of
Clay
in
Rock
Cores
Observed
by
One-Dimensional
]
H
NMR
Imaging," Journal
of
Colloid
and
Interface
Science,
Vol. 156,
1993,
pp.
253-255.
Gunter,
G.
W.,
Pinch,
J.
J.,
Finneran,
J.
M.,
&
Bryant,
W.
T.,
"Overview
of
an
Integrated Process Model
to
Develop Petrophysical Based Reser-
voir
Description,"
SPE
38748 paper, Proceedings
of the
1997
SPE
Annual
Technical Conference
and
Exhibition,
San
Antonio, Texas,
October
5-8, 1997,
pp.
475-479.
Characterization
of
Reservoir
Rock
125
Hayatdavoudi,
A.,
"Changing Chemophysical Properties
of
Formation
and
Drilling Fluid Enhances Penetration Rate
and Bit
Life,"
SPE
50729
paper,
Proceedings
of the
1999
SPE
International Symposium
on
Oilfield
Chemistry, Houston, Texas, February
16-19, 1999,
pp.
273-285.
Hicks
Jr.,
P. J.,
"X-Ray
Computer-Assisted Tomography
for
Laboratory
Core Studies," Journal
of
Petroleum
Technology, December
1996,
pp.
1120-1122.
loannidis,
M.
A.,
Kwiecien,
M.
J.,
&
Chatzis,
I.,
"Statistical Analysis
of
the
Porous Microstructure
as a
Method
of
Estimating Reservoir Perme-
ability,"
Journal
of
Petroleum Science
and
Engineering,
Vol.
16,
1996,
pp.
251-261.
Johnson,
P. R., "A
Comparison
of
Streaming
and
Microelectrophoresis
Methods
for
Obtaining
the
£
Potential
of
Granular Porous Media
Surfaces," Journal
of
Colloid
and
Interface
Science,
Vol. 209, 1999,
pp.
264-267.
Kelkar,
M.,
"Introduction
to
Geostatistics,"
tutorial paper, presented
at
the
1991
International Reservoir Characterization Conference,
Tulsa,
Oklahoma.
Kelkar,
M.,
Applied Geostatistics
for
Reservoir Characterization, draft,
University
of
Tulsa, Tulsa, Oklahoma,
1993.
Kersey,
D. G.,
"The
Role
of
Petrographic
Analysis
in the
Design
of
Non-
damaging
Drilling, Completion,
and
Stimulation Programs,"
SPE
14089
paper, presented
at the
1986
SPE
Intl. Meeting
on
Petroleum Engi-
neering, Beijing, March
17-20.
Khilar,
K.
C.,
&
Fogler,
H.
S.,
"Colloidally
Induced Fines Migration
in
Porous Media,"
in
Amundson,
N.
R.,
&
Luss,
D.
(Eds.),
Reviews
in
Chemical
Engineering, Freund Publishing House LTD., London, England,
January-June
1987, Vol.
4,
Nos.
1 and 2, pp.
41-108.
Khilar,
K.
C.,
&
Fogler,
H.
S.,
"Water Sensitivity
of
Sandstones,"
SPEJ,
pp.
55-64,
February
1983.
Kleven,
R.,
&
Alstad,
J.,
"Interaction
of
Alkali, Alkaline-Earth
and
Sulphate
Ions with Clay Minerals
and
Sedimentary Rocks," Journal
of
Petroleum Science
and
Engineering,
Vol.
15,
1996,
pp.
181-200.
Madden,
M. P., &
Strycker,
A.
R.,
"Thermal Processes
for
Light
Oil
Recovery,"
1988
Annual Report, Work Performed Under Cooperative
Agreement
No.
FC22-83FE60149,
for the
U.S.
Department
of
Energy,
Bartlesville Project
Office,
Bartlesville, Oklahoma,
September
1989,
pp.
205-218.
Muecke,
T. W.,
"Formation Fines
and
Factors Controlling their Movement
in
Porous
Media,"
JPT,
pp.
147-150, Feb. 1979.
Oyno,
L.,
Tjetland,
B.
C.,
Esbensen,
K.
H.,
Solberg,
R.,
Scheie,
A.,
&
Larsen,
T.,
"Prediction
of
Petrophysical Parameters Based
on
Digital
126
Reservoir
Formation
Damage
Video
Core
Images,"
SPE
Reservoir
Evaluation
and
Engineering,
February 1998,
pp.
82-87.
Rhodes,
C. N., &
Brown,
D.
R.,
"Rapid Determination
of the
Cation
Exchange
Capacity
of
Clays Using
Co(II),"
Clay
Minerals Journal,
Vol.
29,
1994,
pp.
799-801.
Rink,
M., &
Schopper,
J.
R.,
"On the
Application
of
Image Analysis
to
Formation Evaluation,"
The Log
Analyst,
January-February 1978,
pp.
12-22.
Rueslatten,
H.,
Eidesmo,
T.,
Lehne,
K.
A.,
&
Relling,
O.
M.,
"The
Use
of
NMR
Spectroscopy
to
Validate
NMR
Logs
from
Deeply Buried
Reservoir Sandstones," Journal
of
Petroleum Science
and
Engineering,
Vol.
19,
1998,
pp.
33-43.
Saner,
S.,
Al-Harthi,
A.,
&
Htay,
M.
T.,
"Use
of
Tortuosity
for
Discrimi-
nating
Electro-Facies
to
Interpret
the
Electrical Parameters
of
Carbonate
Reservoir
Rocks,"
Journal
of
Petroleum Science
and
Engineering, Vol.
16,
1996,
pp.
237-249.
Scott Jr.,
T. E.,
Zaman,
M.
M.,
&
Roegiers, J-C.,
"Acoustic-Velocity
Signatures
Associated with Rock-Deformation Processes," Journal
of
Petroleum Technology, June 1998,
pp.
70-74.
Sharma,
M.
M.,
"Transport
of
Particulate Suspensions
in
Porous Media,"
Ph.D.
Dissertation,
University
of
Southern California, 1985,
342 p.
Skopec,
R.A.,
"Recent Advances
in
Rock Characterization,"
The Log
Analyst,
May-June
1992,
pp.
270-284.
Tamura,
H.,
Tanaka,
A.,
Mita, K-Y.,
&
Furuichi,
R.,
"Surface Hydroxyl
Site Densities
on
Metal Oxides
as a
Measure
for the
Ion-Exchange
Capacity," Journal
of
Colloid
and
Interface
Science, Vol. 209, 1999,
pp.
225-231.
Tremblay,
B.,
Sedgwick,
G., & Vu,
D.,
"CT-Imaging
of
Wormhole Growth
Under Solution-Gas
Drive,"
SPE
39638
paper, Proceedings
of the
1998
SPE/DOE
Improved
Oil
Recovery Symposium,
Tulsa,
Oklahoma, April
19-22,
1998,
pp.
367-382.
Unalmiser,
S.,
&
Funk,
J.
J.,
"Engineering Core Analysis," Journal
of
Petroleum Technology, April 1998,
pp.
106-114.
Weber,
K.
J.,
"How Heterogeneity
Affects
Oil
Recovery,"
in
Reservoir
Characterization,
L. W.
Lake
& H. B.
Carroll,
Jr.
(eds.), Academic
Press, Inc., Orlando, Florida, 1986,
pp.
487-544.
Wellington,
S.
L.,
&
Vinegar,
H.
J.,
"X-Ray
Computerized Tomography,"
Journal
of
Petroleum Technology, August 1987,
pp.
885-898.
Xiao,
L.,
Piatti,
C.,
Giacca,
D.,
Nicula,
S.,
&
Gallino,
G.,
"Studies
on
the
Damage Induced
by
Drilling Fluids
in
Limestone Cores,"
SPE
50711
paper, Proceedings
of the
1999
SPE
International Symposium
on
Oilfield
Chemistry,
Houston, Texas, February
16-19,
1999,
pp.
105-117.
Part
II
Characterization
of
the
Porous
Media
Processes
for
Formation
Damage
Accountability
of
Phases
and
Species,
Rock-Fluid-
Particle Interactions,
and
Rate
Processes
Chapter
7
Multi-Phase
and
Multi-Species
Transport
in
Porous
Media*
Summary
The
fundamental
concepts,
definitions, expression
of
species
content,
and
conservation laws
in
multi-phase
and
species environments
in
porous
media
are
presented
in
this chapter
by
expanding
the
overview
and
developments given
by
Civan (1993, 1996).
Multi-Phase
and
Species Systems
in
Porous Media
The
reservoir formation
is
considered
in
three parts:
(1) the
stationary
or
deforming solid phase containing
(a)
porous matrix made
from
detrital
grains,
minerals
and
clays,
and (b) the
immobile materials attached
to the
pore surface including authigenic
or
diagenetic minerals
and
clays; various
deposits; scale forming precipitates such
as
wax,
asphaltene,
sulfur,
and
gels; trapped
gas,
connate water
and
residual
oil;
(2) the
flowing
or
mobile
fluid
phases including
(a)
gas,
(b)
oil,
(c)
brine,
and (d)
chemicals
used
for
improved recovery;
(3)
various types
of
species that
the
solid
and
fluid
phases
may
contain.
Typical species
are (1)
ions including
the
anions such
as
Cl~,
HCOj,
CO;
2
,
SC>4
2
and the
cations such
as
K
+
,
NA
+
,
Ca
+2
,
Ba
+2
,
Mg
+2
;
(2)
mole-
cules
such
as
CH
4
,CO
2
,H
2
S,
N
2
,
molasses, polymers, surfactants,
paraffin,
asphaltene,
and
resins;
(3)
pseudocomponents such
as
gas, oil,
and
brine
with
prescribed compositions;
(4)
particulates such
as
minerals, clays,
*
After
Civan, ©1996
SPE;
parts reprinted
by
permission
of the
Society
of
Petroleum
Engineers
from
SPE
31101
paper.
128
Multi-Phase
and
Multi-Species
Transport
in
Porous
Media
129
sand, gels,
paraffin,
asphaltene,
sulfur,
precipitates, crystalline matter,
mud
fines,
debris,
and
bacteria;
and (5)
associates such
as the
pairs
of
ions
and
molecules, coagulates
of
various particulates, micelles,
and
microemulsions.
The
characteristics
of the
particulates play
an
important
role
in
formation
damage. Based
on
their characteristics, particles
can be
clas-
sified
as: (1)
indigenous, in-situ generated,
or
externally introduced;
(2)
dissolved
or
nondissolved;
(3)
water-wet, mixed-wet,
or
oil-wet;
(4)
deformable
(soft)
or
nondeformable (hard);
(5)
sticky
or
nonsticky;
(6)
swelling
or
nonswelling;
(7)
organic
or
inorganic;
(8)
reactive
or
inert;
(9)
biological
or
nonbiological;
(10) growing
or
nongrowing;
and
(11) asso-
ciating
or
nonassociating.
The
species content
of a
system
can be
expressed
in a
variety
of
alternative
ways:
1.
mass concentration (all species)
mass
of i
_
volume
of
mixture
2.
molar concentration (preferred
for
dissolved species)
_
Cj
_
mass concentration
of i _
mole
of i
M
t
molecular weight
of i
volume
of
mixture
3.
mass
fraction (all
species)
C;
mass concentration
of i
mass
of i
W
.=-L
=
-
J
—
=
-
J
-
-
p
density
of
mixture mass
of
mixture
4.
mole
fraction
(preferred
for
dissolved
species)
moles
of i
x
:
=
(7-1)
(7-2)
(7-3)
moles
of
mixture
5.
volume fraction (preferred
for
particulates)
_
c
t
_
mas
$
concentration
of i _
volume
of i
p.
density
of i
volume
of
mixture
6.
volume ration (preferred
for
particulates)
_
volume
of i
volume
of k
(7-4)
(7-5)
(7-6)
130
Reservoir
Formation
Damage
The
relationship between volume
fraction
and
volume ratio
is
given
by:
o,
=
n
;
(7-7)
Frequently, conversion between
the
various ways
of
expressing
the
species content
are
required
for
various purposes. Some
of
these
are
presented
in the
following.
The
conversion between mole
and
mass fractions
are
given
by:
(7-8)
and
(7-9)
The
mass concentration
of
species
/
in a
mixture
can be
expressed
per
unit
volume
of
another
species
k as:
c
ik
=
w
_
mass
of i
volume
of k
(7-10)
The
mass
concentration
of
species
/
in a
mixture
can be
expressed
in
terms
of its
mass fraction
as:
(7-11)
The
volume fraction
of
species
/
in a
mixture
can
also
be
expressed
in
terms
of its
mass fraction
as:
(7-12)
The
volume
fraction
of
species
i can be
expressed
in
terms
of the
volume
ratio
as:
Multi-Phase
and
Multi-Species
Transport
in
Porous
Media
131
a,
=
(7-13)
In the
following formulations,
the
various phases (solid
and fluid) in
porous media
are
denoted
by j, s
denotes
the
solid phase,
n is the
total
number
of
phases,
&•
is the
volume fraction
of the
j'
h
phase
in
porous
media,
fy is the
porosity
of
porous media,
and Sj is the
saturation
or
volume
fraction
of
j
th
phase
in the
pore space.
The
following equations
can be
written:
e
5
=l-(J>
(7-14)
e
i
=$S
i
:j
=
w,o,g
(7-15)
SX=1.0,
IX
=1.0,
IX
=1.0,
20,
=1.0,
2**
=1-0
(7-16)
2*
c
ij-Pj
(7-17)
i
The
density
and
velocity
of a
mixture
is
given
by the
volume
fraction
weighted averages, respectively,
as:
(7-18)
and
Pv
=
2,<W,.
(7-19)
(
Therefore,
the
density
and
velocity
of a
mixture
are
variable
when
the
composition varies even
if the
constituents
are
incompressible.
For
incompressible systems,
it is
more convenient
to use
volumetric
balance equations. Therefore,
Eqs.
7-18
and
7-19
are
replaced
by:
(7-20)