Reservoir Formation Damage Episode 2 Part 1 ppsx
Bạn đang xem bản rút gọn của tài liệu. Xem và tải ngay bản đầy đủ của tài liệu tại đây (1.15 MB, 25 trang )
232
Reservoir Formation Damage
in
which
=G'
U
np=
U
(10-189)
(10-190)
because
all flow
goes
through
the
plugging pathways.
The
fact
that
the
cumulative amounts
of
deposits reach certain limiting
values
as
shown
in
Figure 10-25
is
indicative
of
attainment
of
such
equilibrium conditions. Note, however, that
the
amounts shown
in
Figure
10-25
are the
cumulative amounts including
the
amount
of
deposits
in
the
plugging pathways. Therefore
at
equilibrium
£=£„+£
(10-191)
//—Constant-Pressure-Difference
Tests
Constant
pressure
tests
are
more
representative
of the
producing
well conditions.
Gruesbeck
and
Collins
(1982)
flowed
suspensions
of
glass particles
through
sand packs
at
constant pressure differences
by
applying relatively
high pressure difference
to a
column
of
fine
sand pack
and
relatively
low
pressure difference
to a
column
of
coarse
sand pack.
The
results
are
reported
in
Figure
10-27.
In the
fine sand packs, they observed more
deposition near
the
injection side,
and the
mean permeability
of the
sand
JT
1.0
0.8
0.6
0.4
i
0.2
g
0.0
•
Cj
9.5x10-*
oc
g
C|
J£
^
IS
100 200
PORE
VOLUMES
300
4
8 12 16
PACK
LENGTH.
CM
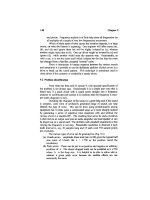
Figure
10-27.
Constant pressure deposition
and
entrainment
of
5-10
mm
diameter glass beads
in a
pack
of (a)
177-210
mm
diameter sand grains
subjected
to 900
kPa/m
pressure
gradient
and (b)
250-297
mm
diameter sand
grains subjected
to 450
kPa/m
pressure gradient (after Gruesbeck
and
Collins,
©1982
SPE;
reprinted
by
permission
of the
Society
of
Petroleum Engineers).
Single-Phase
Formation
Damage
by
Fines
Migration
and
Clay
Swelling
233
pack decreased
to
zero. Because,
in the
fine
sand pack, almost
all the
pathways
are of the
plugging type. Whereas,
in
coarse sand packs,
the
deposition tended
to
occur almost uniformly along
the
sand pack
and the
mean
permeability
of the
sand pack decreased
to an
equilibrium value.
Because,
in the
coarse
sand pack, most
of the
pathways
are of the
nonplugging
types.
Gruesbeck
and
Collins (1982) state that their computer simulation
produced
results similar
to
measurement reported
in
Figure
10-27.
Civan
et
al.
(1989),
and
Ohen
and
Civan
(1990,
1993)
also simulated these
experiments
successfully.
Consolidated
Core
Tests.
Gruesbeck
and
Collins tested Berea
and
field
cores.
First,
the
Berea cores were tested using
1.
2%
KCl
brine
in a dry
core (single phase system)
2.
2% KCl
brine
and
white
oil at a
50/50 ratio
in a dry
core (two phase
system)
3.
white
oil in a dry
core (single phase system)
4.
white
oil in a
core
at
connate
2% KCl
brine saturation
(two
phase)
Cores were tested
at
various constant injection rates over
a
period
of
time
determined
by a
prescribed, cumulative pore volume amount
of the
injection
fluid.
During each test,
the
pressure difference
was
measured
and
the
permeability
was
calculated
using
Darcy's
law.
Typical results
obtained using
a 2% KCl
brine
in a
Berea core
are
presented
in
Figure
10-28.
As can be
seen,
the
permeability remained unchanged
at the low
flow
rate
of
0.0367cm
3
/-?,
while
it
decreased further
at
each
of the
increased
high
flow
rates
of
0.0682, 0.1002, 0.1310,
and
0.1702cm
3
/s.
The
final permeability values attained after each
of the
high
flow
rates
are
used
to
calculate
the
permeability reductions
from
the
initial state,
which
are
then plotted against these high
flow
rates
as
shown
in
Figure
10-29.
The
results shown
in
Figure
10-29
are
indicative
of
surface
particle removal, similar
to
Figure
10-24.
They stated that
the
removal
of
indigeneous particles
in the
cores
from
the
pore surface
and
subsequent
redeposition
at the
pore throats caused
the
permeability reduction.
Second, core samples were taken
from
an oil
field, indicating
an
abnormal decline
of
productivity
in
some wells. These cores were tested using
1.
white
oil in a dry
core
2.
white
oil in a
core
at
connate
2% KCl
brine saturation.
The
experimental results presented
in
Figure
10-30
indicate
a
trend
similar
to
Figure
10-29.
234
Reservoir Formation Damage
80
~
M
E
a.
E
40
0.29
100
200
300
400 500 600 700
PORE
VOLUMES
800
900
1000 1100
Figure
10-28.
Effect
of
fluid velocity
on the
entrainment
and
redeposition
of
fines
in a
3.81
cm
diameter
and 3.0 cm
long Berea core during
a 2%
KCI
solution injection
(after
Gruesbeck
and
Collins, ©1982
SPE;
reprinted
by
permission
of the
Society
of
Petroleum Engineers).
30
25
20
10
2% KCI
BRINE
1SOPAR
M
-
2.6
mPa
s
ISOPARM
AT
CONNATE
2%
Kd
BRINE
SATURATION
.02 .04 .06
.OB
.10 .12 .14
INTERSTITIAL
VELOCITY.
u/</>
j;
CM/S
.16
.18
Figure
10-29.
Permeability reduction
as a
function
of the
interstitial velocity
determined using
the
Figure
10-28
data
(after
Gruesbeck
and
Collins,
©1982
SPE;
reprinted
by
permission
of the
Society
of
Petroleum Engineers).
The
results presented
in
Figures 10-29
and
10-30 indicate that
the
indigeneous
particles
of
Berea
and
field
cores
are
water wet. This
is
apparent
by the
effect
of the two
phases
on the
critical velocity values
required
to
initiate particle mobilization.
The
implication
of
this
is
that
variation
of the fluid
system
from
oil to
oil/water
can
reduce
the
critical
Single-Phase Formation Damage
by
Fines Migration
and
Clay Swelling
235
j
-0.25
1,5
ISOPAR
M
2.6
mPa
s
•4-
ISOPAR
M
AT
CONNATE
2%
KCi
BRINE
SATURATION
0.10
0.20 0.30
INTERSTITAL VELOCITY.
u/<£j,
CM/S
0.40
Figure
10-30.
Permeability
reduction
as a
function
of the
interstitial
velocity
determined using
a
3.81
cm
diameter
and 3.0 cm
long field core sample
(after
Gruesbeck
and
Collins, ©1982
SPE;
reprinted
by
permission
of the
Society
of
Petroleum Engineers).
velocity,
induce surface particle mobilization,
and
increase permeability
damage
in the
near well bore formation.
References
Cernansky,
A.,
&
Siroky,
R.
"Deep-bed
Filtration
on
Filament Layers
on
Particle Polydispersed
in
Liquids,"
Int.
Chem.
Eng.,
Vol.
25, No. 2,
1985,
pp.
364-375.
Cernansky,
A.,
&
Siroky,
R.,
"Hlbkova
Filtracia
Polydisperznych
Castic
z
Kvapalin
na
Vrstvach
z
Vlakien,"
Chemicky
Prumysl,
Vol.
32
(57),
No.
8,
1982,
pp.
397-405.
Civan,
F. "A
Generalized Model
for
Formation Damage
by
Rock-Fluid
Interactions
and
Particulate
Processes,"
SPE
Paper 21183, Proceedings
of
the SPE
1990
Latin American Petroleum Engineering Conference,
October
14-19, 1990,
Rio de
Janeiro, Brazil,
11 p.
Civan,
F.
"Evaluation
and
Comparison
of the
Formation Damage
Models,"
SPE
23787
paper, Proceedings
of the SPE
International Symposium
on
Formation Damage Control, February
26-27,
1992,
Lafayette,
Louisiana,
pp.
219-236.
Civan,
F.,
&
Knapp,
R. M.
"Effect
of
Clay Swelling
and
Fines Migration
on
Formation
Permeability,"
SPE
Paper
No.
16235,
Proceedings
of the
236
Reservoir
Formation
Damage
SPE
Production Operations Symposium, Oklahoma City, Oklahoma,
1987,
pp.
475-483.
Civan,
F. "A
Multi-Phase
Mud
Filtrate Invasion
and
Well Bore Filter
Cake Formation Model,"
SPE
Paper
No.
28709, Proceedings
of the
SPE
International Petroleum Conference
&
Exhibition
of
Mexico,
October
10-13, 1994,
Veracruz, Mexico,
pp.
399-412.
Civan,
F.,
Knapp,
R. M., &
Ohen,
H. A.
"Alteration
of
Permeability
by
Fine Particle
Processes,"
J.
Petroleum Science
and
Engineering,
Vol.
3,
Nos.
1/2,
October
1989,
pp.
65-79.
Civan,
F.,
Predictability
of
Formation Damage:
An
Assessment Study
and
Generalized Models, Final Report,
U.S.
DOE
Contract
No.
DE-AC22-
90BC14658, April
1994.
Civan,
F.
"Modeling
and
Simulation
of
Formation Damage
by
Organic
Deposition," Proceedings
of the
First International Symposium
on
Colloid Chemistry
in Oil
Production: Asphaltenes
and Wax
Deposition,
ISCOP'95,
Rio de
Janeiro, Brazil, November
26-29, 1995,
pp.
102-107.
Civan,
F. "A
Multi-Purpose
Formation Damage
Model,"
SPE
31101,
Proceedings
of the SPE
Formation Damage Symposium, Lafayette,
Louisiana,
February
14-15, 1996,
pp.
311-326.
Civan,
F.
"Interactions
of the
Horizontal Wellbore Hydraulics
and
Formation
Damage,"
SPE
35213, Proceedings
of the SPE
Permian Basin
Oil &
Gas
Recovery Conf., Midland, Texas, March
27-29, 1996,
pp.
561-569.
Gruesbeck,
C,
&
Collins,
R. E.
"Particle
Transport Through Perforations,"
SPEJ,
December 1982b,
pp.
857-865.
Gruesbeck,
C.,
&
Collins,
R. E.
"Entrainment
and
Deposition
of
Fine
Particles
in
Porous
Media,"
SPEJ,
December 1982a,
pp.
847-856.
Khilar,
K.
C.,
&
Fogler,
H. S.
"Colloidally
Induced Fines Migration
in
Porous Media,"
in
Amundson,
N. R. &
Luss,
D.
(Eds.),
Reviews
in
Chemical
Engineering, Freund Publishing House LTD., London, England,
January-June
1987, Vol.
4,
Nos.
1 and 2, pp.
41-108.
Khilar,
K.
C.,
&
Fogler,
H. S.
"Water Sensitivity
of
Sandstones,"
SPEJ,
February
1983,
pp.
55-64.
Liu,
X.,
Civan,
F, &
Evans,
R. D.
"Correlation
of the
Non-Darcy Flow
Coefficient,
J. of
Canadian Petroleum Technology,
Vol.
34, No. 10,
1995,
pp.
50-54.
Metzner,
A. B., &
Reed,
J. C.
"Flow
of
Non-Newtonian
Fluids—Corre-
lation
of the
Laminar, Transition,
and
Turbulent Flow Regions,"
AIChE
J.,
Vol.
1, No. 4,
1955,
pp.
434-440.
Nayak,
N. V, &
Christensen,
R. W.
"Swelling
Characteristics
of
Com-
pacted Expansive
Soils,"
Clay
and
Clay Mineral,
Vol.
19, No. 4,
December
1970,
pp.
251-261.
Ohen,
H.
A.,
&
Civan,
F.
"Predicting Fines Generation, Migration
and
Deposition Near Injection
and
Production
Wells,"
Proceedings
of the
Single-Phase Formation Damage
by
Fines Migration
and
Clay Swelling
237
First Regional Meeting, American Filtration Society, Houston, Texas,
October
30-November
1,
1989,
pp.
161-164.
Ohen,
H.
A.,
&
Civan,
F.
"Simulation
of
Formation Damage
in
Petroleum
Reservoirs,"
SPE
Advanced Technology
Series,
Vol.
1, No. 1,
April
1993,
pp.
27-35.
Ohen,
H.
A.,
&
Civan,
F.
"Simulation
of
Formation Damage
in
Petroleum
Reservoirs,"
SPE
19420
paper, Proceedings
of the
1990
SPE
Symposium
on
Formation Damage Control, Lafayette, Louisiana, February
22-23,
1990,
pp.
185-200.
Schechter,
R. S., Oil
Well
Stimulation,
Prentice Hall, Englewood
Cliffs,
New
Jersey,
1992,
602 p.
Seed,
H. B.,
Woodward,
Jr.,
R. J., &
Lundgren,
R.
"Prediction
of
Swelling
Potential
for
Compacted Clays,"
/.
Soil Mech. Found.
Div.,
Proc.
Am.
Soc.
Civ. Eng.,
88(SM3), June
1962,
pp.
53-87.
Wojtanowicz,
A. K.,
Krilov,
Z.,
&
Langlinais,
J. P.
"Study
on the
Effect
of
Pore Blocking Mechanisms
on
Formation Damage,"
SPE
16233
paper, presented
at
Society
of
Petroleum Engineers Production Opera-
tions Symposium, Oklahoma City, Oklahoma, March
8-10, 1987,
pp.
449-463.
Wojtanowicz,
A.
K.,
Krilov,
Z.,
&
Langlinais,
J. P.
"Experimental Deter-
mination
of
Formation Damage
Pore
Blocking Mechanisms,"
Trans,
of
the
ASME, Journal
of
Energy
Resources Technology,
Vol. 110, 1988,
pp.
34-42.
Chapter
11
Two-Phase
Formation
Damage
by
Fines
Migration
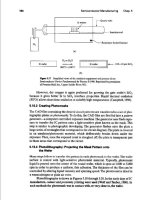
Summary
Most reservoirs contain multi-phase
fluid
systems. Formation damage
processes
in
such reservoirs
are
more complicated because
of the
effects
of
the
relative wettabilities
of
fine
particles
and
formation, interface
transport,
relative permeabilities,
and
capillary pressures.
There
are
only
a few
models available
for
multi-phase systems. These models have been
developed
for and
tested with
two
phase laboratory core
flow
data. This
chapter discusses
the
additional
processes
on top of
those involving
single-phase formation damage that need
to be
considered
for
multi-phase
formation
damage
by
fines
migration.
A
systematic analysis
and
formu-
lation
of the
relevant processes involving
fines
migration
and
formation
damage during two-phase
fluid
flow through sedimentary formations
is
presented,
as
well
as
applications
to
typical laboratory core damage
tests.
The
formulation
can be
readily extended
for the
multi-phase
and
multi-dimensional systems
and the
actual
fluid
conditions existing
in
reservoir formations.
Introduction
Several investigators including Muecke (1979), Sarkar (1988),
and
Sarkar
and
Sharma (1990) have determined that
fine
particles behave
differently
in a
multi-phase
fluid
environment
and
formation damage
follows
a
different
course than
the
single-phase systems. However,
the
reported studies
on the
two-phase formation damage
are
very limited.
Sutton
and
Roberts (1974)
and
Sarkar
and
Sharma (1990) have experi-
mentally
observed that formation damage
in
two-phase
is
less
severe than
in
single-phase.
Liu and
Civan
(1993,
1995, 1996) have shown that two-phase
238
Two-Phase
Formation
Damage
by
Fines
Migration
239
formation
damage requires
the
consideration
of
other factors, such
as the
wettability
affect
and
partitioning
of
particles between various phases.
In
this
chapter,
mutual
interactions
and
affects between
the
two-phase
flow
systems, fine particles,
and
porous matrix
are
described mathe-
matically
to
develop
a
predictive model
for
formation damage
by
fines
migration
in
two-phase systems
flowing
through porous formations.
The
formulation
is
carried
out by
extending
the Liu and
Civan (1993,
1994,
1995, 1996) model
for
more realistic applications.
The
tests
and
case
studies used
by Liu and
Civan
(1995,
1996)
are
presented
for
demon-
stration
and
verification
of the
model. Although
the
model presented here
involves
some simplifications pertaining
to the
laboratory
core
damage
experiments,
it can be
readily modified
and
generalized
for the
actual
conditions encountered
in
petroleum reservoirs.
Formulation
The
equations describing
the
various aspects
for
formation damage
by
fines
migration during two-phase
fluid flow
through porous formations
are
formulated here. However,
the
formulation
can be
extended readily
to
multi-phase
fluid
systems.
It is
safe
to
assume that
the gas
phase does
not
carry
any
solid
particles
(i.e.,
it is
nonwetting
for all
particles).
For
convenience
in
modeling,
the
bulk porous media
is
considered
in
four
phases
as
schematically depicted
in
Figure
11-1:
(1) the
solid matrix,
(2)
the
wetting
fluid, (3) the
nonwetting
fluid, and (4) the
interface region.
These phases
are
indicated
by
S,
W,
N, and /,
respectively.
The
porous
matrix
is
assumed nondeformable. Therefore,
it is
stationary
and its
volumetric
flux is
zero.
The
wetting
and
nonwetting
phases
flow at the
volumetric
fluxes
denoted, respectively,
by
u
w
and
U
N
.
The
interface
region
is
located between
the
wetting
and
nonwetting phases
and is
assumed
to
move
at a flux
equal
to the
absolute value
of the
difference
between
the fluxes of the
wetting
and
nonwetting phases (i.e.,
its flux is
«/
=
U
W
-U
N
\).
The
various
particles
involving
the
formation damage
are
classified
as (1) the
foreign particles introduced externally
at the
wellbore,
(2)
the
indigeneous particles existing
in the
porous formation,
and (3) the
particles generated inside
the
pore space
by
various processes, such
as
the
wettability alteration considered
in
this chapter. Another classification
of
particles
is
made with reference
to the
wettability
as (1) the
wetting
particles,
(2) the
nonwetting
particles,
and (3) the
intermediately wetting
particles. These particles
are
identified, respectively,
by
wp,
np,
and ip.
The
latter classification
is
more significant
from
the
modeling point
of
view. Because,
as
explained
by
Muecke (1979),
the
wettability
affects
the
behavior
of
these particles
in a
multi-phase
fluid
system.
By
means
of
240
Reservoir
Formation
Damage
Solid
matrix
nS,
Non-wetting
surface
\
Pore
body
wS,
Wetting
surface
Pore
throat
Figure
11-1. Multi-phase system
in
porous media.
experimental investigations, Muecke (1979)
has
observed that particles
tend
to
remain
in the
phases that
can wet
them.
Ku and
Henry,
Jr.
(1987)
have shown that intermediately
wet
particles accumulate
at the
interface
of
the
wetting
and
nonwetting phases, because they
are
most stable there.
Therefore,
in the
following formulation,
an
interface region contain-
ing
the
intermediately
wet
particles
is
perceived
to
exist
in
between
the
wetting
and
nonwetting phases
as
schematically indicated
in
Figure
11-1. Further,
it is
reasonable
to
consider that
the
wettability
of
some
particles
may be
altered
by
various processes, such
as
asphaltene,
paraffin,
and
inorganic precipitation
or by
other mechanisms such
as the
turbulence
created
by
rapid
flow
in the
near-wellbore
region. Consequently, these
altered particles should tend
to
migrate into
the
phases that
wet
them
as
inferred
by the
experimental studies
of Ku and
Henry,
Jr.
(1979).
In
addition
to the
particles,
the
various phases
may
contain
a
number
of
dissolved species.
The
salt content
of the
aqueous phase
is
particularly
important, because
it can
lead
to
conditions
for
colloidally induced
release
of
clay particles when
its
salt concentration
is
below
a
critical salt
concentration
(Khilar
and
Fogler, 1983).
For
convenience
in
formulation,
the
locations
for
particles retention
can
be
classified
in
three categories:
(1) the
wetting pore surface,
(2) the
nonwetting
pore surface,
and (3) the
pore space behind
the
plugging pore
Two-Phase
Formation
Damage
by
Fines
Migration
241
throats. These regions
are
denoted
by
wS,
nS,
and
tS,
respectively,
as
indicated
schematically
in
Figure
11-1.
The
areal
fractions
of the
wetting
and
nonwetting sites
can
vary
as a
result
of the
various rock,
fluid, and
particle interactions during formation damage, such
as by
asphaltene,
paraffin,
and
inorganic deposition. Therefore,
a
parameter
f
ks
indicating
the
fraction
of the
pore surface, that
is
wetting
for
species
k,
is
introduced
in
the
formulation.
Because
the
applications
to
describe
and
interpret
the
laboratory
core
damage data, conducted
at
mild temperature
and
pressure conditions
are
intended,
the
formulation
is
carried
out for
one-dimensional
flow in
homogeneous
core
plugs, isothermal conditions,
and
incompressible
particles
and fluids.
This allows
the use of a
simplified formulation based
on
volumetric balances
and a
fractional
flow
concept. However,
the
derivation
can be
readily extended
for
compressible systems encountered
at
the
prevailing elevated pressure conditions
of the
reservoir formations.
Fluid
and
Species Transport
Assuming
incompressible species,
the
volumetric balance
of
species
j
transported
via
phase
J
through porous media
is
given
by:
(11-1)
J
= W, N, /,
wS,
nS, tS and j =
w,«,
wp,
np,
ip
where
e
y
indicates
the
volume fraction
of
phase
J in
porous
media,
o
;7
is
the
volume fraction
of
species
j in
phase
/,
u
}
is the
volumetric
flux
of
phase
J
through porous media
and
q
jJL
represents
the
volume rate
of
transfer
of
species
j
from
phase
J to
phase
L.
D-
}
denotes
the
coefficient
of
dispersion
of
species
j in
phase
/,
and
p
y
is the
density
of
phase
J,
which varies
by its
composition even
if the
individual constituent species
may
be
considered
incompressible,
jc
and t
denote
the
distance
along
the flow
direction
and
time.
The
dispersion term
for
particles
is
usually neglected.
The
volumetric rate
of
particle lost
per
unit bulk media
by
various
processes
is
given
by:
tjJL
(11-2)
in
which
q
ju
denotes
the
volume rate
of
transformation
of
species
j
type
to
species
/
type
in
phase
J
expressed
per
unit
bulk volume. Summing
242
Reservoir
Formation
Damage
Eq.
11-1
over
all
species
j in
phase
J and
considering that
the
dispersion
terms
of
various species
j
cancel each other
out in a
given phase,
the
volumetric
equation
of
continuity
for
phase
J is
obtained
as:
-
+
-^-
+
q
J=
Q
; J =
W,N,wS,nS,tS
dt
dx
(11-3)
in
which
the
volumetric
loss
of all
types
of
particles
from
phase
J is
given
by:
<*»
(11-4)
Finally,
by
summing
Eq.
11-3
for all
phases
/,
the
total equation
of
continuity
for the
multi-phase
fluid
system
is
obtained
as:
dt
dx
(11-5)
where
the
total volumetric
flux and all
types
of
particles lost
by the
multi-
phase
fluid
system
are
given, respectively,
by:
«
=
5X
(11-6)
9
=
SX
(11-7)
Considering
the
possibility
of the
generation
of
inertial
effects
by
rapid
flow
due
to the
narrowing
of
pores
during formation damage,
the
volumetric
flux
of
phase
J is
represented
by the
non-Darcy
flow
equation given
by:
_
Kk
rJ
N
ndJ
(d
Pj
u,
=-
dx
=
W,N
(11-8)
where
0 is the
angle
of
inclination
of the flow
path
and PJ and
|i
y
are
the
pressure
and
viscosity
of
phase
J.
k
rj
is the
relative permeability
of
phase
/
and K is the
permeability
of
porous media.
N
ndJ
is the
phase
J
non-Darcy
number given according
to the
Forchheimer equation
as:
(11-9)
Two-Phase
Formation
Damage
by
Fines
Migration
243
in
which
Re
}
is the
phase
J
Reynolds number given
by
(Ucan
and
Civan,
1996):
(11-10)
where
(3 is the
inertial
flow
coefficient given
by a
suitable correlation,
such
as by Liu et
al.
(1995).
Determination
of
Fluid Saturations
and
Pressures
Two
alternative convenient formulations
can be
taken
for
solution
of
the
equations
of
continuity
and
motion given
by
Eqs. 11-3
and 8 for
pressures
and
saturations
of the
various phases flowing through porous
media.
In the
first
approach,
Eq.
11-8
is
substituted into
Eq.
11-3
to
obtain:
a*
\*-J
;
J=W
>
N
The
capillary pressure
is
defined
as the
difference between
the
nonwetting
and
wetting phase pressures according
to:
PCNW
~ PN
Pw
The
phase
/
volume fraction
is
given
by:
(11-12)
(11-13)
where
(()
is
porosity
and
S
}
is the
saturation
of
phase
J.
Thus, substituting
Eqs. 11-12
and
11-13
into
Eq.
11-11
yields
the
following
equations
for the
wetting
and
nonwetting phases, respectively:
(11-14)
a*
\i
w
i
a*
a*
ds
a*
™*
(11-15)
244
Reservoir
Formation
Damage
Note that
the
saturations
add up to
one:
S
W
+S
N
=1
(11-16)
Therefore, adding
Eqs. 11-14
and
11-15
yields
the
following equation:
N
ndw
k
rW
+ •
K
+
a*
V-N
dPcNW
vS
w
dx
dS
w
dx
(11-17)
dt
where
the
total volumetric loss
of
particles
from
the
two-phase system
is
given
by:
q
=
q
w
+q
N
(11-18)
Eqs.
11-14
and 17 can be
solved
simultaneously
to
determine
the
wetting
phase pressure
and
saturation,
p
w
and
S
w
.
A
second
and
more
convenient approach facilitates
the
fractional
flow
formulation. This
is
especially suitable
for
incompressible systems
described
by the
equation
of
continuity given
by Eq.
11-3.
Civan's (1996)
formulation
based
on
Richardson's
(1961)
formulation
can be
modified
as the
following
to
include
the
loss terms
and
inertia
flow
affect
in the
saturation
equation:
(11-19)
for
which
the
capillary
and
gravity dispersion coefficients
are
given,
respectively,
by:
_
V
k
rN
d
P,
cNW
dS
(11-20)
Two-Phase
Formation
Damage
by
Fines
Migration
245
(11-21)
The
zero capillary pressure
and
zero gravity fractional
flow
term
is
given
by:
FW=
1
+
-
(11-22)
In
the
fractional
flow
formulation,
the
saturation
of the
wetting phase
is
calculated
by
solving
Eq.
11-19.
But the
pressure
of the
wetting phase
is
still determined
by
solving
Eq.
11-17.
As
explained
by
Civan (1996),
the
solution
of
equations presented
above requires
the
capillary pressure
and
relative permeability data
for
the
two-phase system. These data continuously vary during formation
damage
and
empirical
models, such
as
those
given
in
Chapter
4, are
required
to
incorporate these
affects
in the
solution. This problem
can be
alleviated
in a
practical manner
by
resorting
to an
end-point mobility ratio
formulation
similar
to
Civan (1996)
and
Luan
(1995),
by
extending
and
generalizing
the
unit mobility ratio formulations given
by
Craig (1971),
Collins (1961)
and
Dake (1978).
In
view
of the
uncertainties
in
deter-
mining
the
exact nature
of the
variations
of
these data,
it is
reasonable
to
make
the
following assumptions.
First, similar
to Liu and
Civan (1996),
the
capillary pressure
affect
can
be
neglected. Second,
the
relative permeabilities
can be
approximated
by
linear relationships with respect
to the
phase saturations
as
(Yokoyama
and
Lake, 1981):
k
rJ
=k°
rJ
Sj
(11-23)
where
k°
r]
is the
end-point relative permeability. Third,
the
end-point
mobility ratio parameter
as
defined below
can be
implemented:
k
rN
(11-24)
Under these conditions,
Eqs. 11-20
and 22,
respectively, become:
246
Reservoir
Formation
Damage
and
MS
w
1
+
(M-1)S
W
(11-26)
Consequently,
Eq.
11-19
can be
simplified significantly
by
substituting
Eqs.
11-25
and
11-26.
In
addition,
the
non-Darcy
effect
can be
neglected
by
substituting
AU=1.0
; J = W,N
(11-27)
The
end-point relative permeabilities
and fluid
densities
may be
replaced
by
average values
as:
k°
k°
]f°
_£_
~
rW
~!^rN_
~
_
rW
,
rN
~~
(11-28)
_
Pw+P/v
P
~
n
—
n —
-Ptv
=\
)
N
-
(11-29)
As
a
result
of
substituting
Eqs. 11-27
and
11-28,
Eq.
11-5
can be
simplified
as
(Civan,
1996):
a
dx
t •
n\
3~
sme)
=
-^
dx
dt
(11-30)
Determination
of
Species Concentrations
in
Various Phases
Once
the
phase saturations
are
determined, then
the
species
con-
centrations
can be
determined
by
solving
the
following equation obtained
by
combining
Eqs. 11-1
and
11-3:
(11-31)
J
= W, N, I,
wS,
nS,
iS and j = w, n,
wp,
np, ip
Two-Phase
Formation
Damage
by
Fines
Migration
247
The
dispersion term
is
considered
for
dissolved species, such
as
those
contained
in the
aqueous phase,
but it is
usually neglected
for the
particles.
In
accordance
with
the
experimental observations
by
Muecke
(1979),
Liu
and
Civan (1993,
1995,
1996) have assumed that wettable particles
remain
in the
wetting
phase
and
nonwettable
particles
remain
in the
nonwetting
phase
and the
intermediately
wet
particles
are
situated along
the
interface. They
did not
consider
the
possibility
of
wettability alteration
of
the
particles
and the
pore
surface
in
porous media
and
they assumed
that
the
dispersion terms
are
negligible
for the
particles. They considered
that
the
porous media
has
uniform wetting
properties.
Under
these
circumstances,
Eq.
11-31
simplifies
significantly
because
q
ju
= 0 and the
particle loss only occurs
from
the
fluid
phases
to the
solid matrix (i.e.,
qj
=
qjj
=
f
ijjs''
J =
W,N).
Liu
and
Civan
(1996)
considered
a
water/oil system
flowing
through
a
homogeneous (i.e.,
one
type—either
water-wet
or
oil-wet—porous
media).
They assumed that
the
wettability
of the
porous medium does
not
change
during
the
short period
of
time involving
the
typical laboratory core tests.
Wettability
Transformation
and
Interface Transfer
of
Particles
The
literature
on
studies
of the
mechanisms
of
wettability alteration
and
interface particle transfer
is
rather limited
and
insufficient
to
formulate
these processes accurately
and
rigorously. Therefore,
Liu and
Civan
(1996)
have resorted
to a
simplified approach, which yielded reasonably
good results. They have combined
the
rate processes
of the
wettability
transformation
and the
phase
to
phase particle transfer into
one
step
assuming that
the
particles
would immediately migrate into
the
phases,
which
wet
them once their wettabilities change
from
one
type
to
another.
Based
on the
experimental observations
and the
studies
of the
mechanisms
of
interface particle transfer
of Ku and
Henry (1987),
Liu and
Civan
(1996) assumed that
the
rate
of the
combined processes
of
wettability
transformation
and
interface transfer
of
particles
can be
expressed
as
being
proportional
to the
particle concentration according
to:
QjlJL
-
(11-32)
Particle Retention
in
Porous Media
Although
particle retentions
may
occur
at
various locations
in
porous
media
by
various mechanisms, only
the
most likely mechanisms
are
considered here.
The
wetting
and
nonwetting particles preferentially
248
Reservoir Formation Damage
deposit over
the
similar wettability type pore surfaces. They
can
also
be
captured
at and
detained behind
the
pore
throats under favorable
conditions.
The
intermediately
wet
particles most likely move directly
towards
the
pore throats
and are
captured there under certain conditions,
because they migrate along
the
interface.
Surface Deposition
The
volumetric
rate
of
deposition
of the
particle
species
j
from
phase
J
over
a
similar wetting pore surface
can be
expressed
by
(Civan, 1996):
=
d
=
k
djjjs
(a.j
subject
to the
initial condition
-jJS
(11-33)
(11-34)
In
Eq.
11-33,
k
djjjs
is a
deposition rate constant,
a
y
is a
stationary
deposition
constant,
0
is a
porosity,
and
f
js
is the
fraction
of the
pore
surface
of the
same wettability type
of the
particle species
j.
Similar
to
Gruesbeck
and
Collins
(1982),
Liu and
Civan (1996) assumed
that
the
porosity variation
by
deposition
of
small amounts
of
particles
is
negligible (i.e.,
(|)
is a
constant).
Liu and
Civan (1996) considered
a
homogeneous wettability porous media, hence
f
js
=
1,
and
neglected
the
stationary
deposition, therefore
oc
y
=0.
Pore Throat Plugging
The
volumetric rate
of
retention
of
particles
in the
pore space following
the
pore throat plugging
can be
expressed
by
(Gruesbeck
and
Collins,
1982, Civan, 1996):
=
d
subject
to the
initial condition
(11-35)
(11-36)
Liu
and
Civan (1996) assumed
the
porosity change
is
negligible
in
Eq.
11-35
(i.e.,
(})
=
constant).
In Eq.
11-35,
k
tiJtS
denotes
the
rate
Two-Phase
Formation
Damage
by
Fines
Migration
249
constant
for
deposition
by
pore throat plugging. Civan (1990,
1996)
proposed
a
dimensionless
correlation
to
determine
the
conditions favorable
for
pore throat plugging
in
single phase
fluid
media. This equation
determines
the
critical ratio
of the
pore throat-to-particle diameters below
which
pore throat plugging
by
jamming
of
particles occurs. Thus,
(1
1-37)
(11-38)
where
the
pore throat-to-particle diameter ratio
and the
particle Reynolds
numbers
are
given,
respectively,
by:
k
tjjts
=
0
,
when
D
t
D
p
<
D./
For
multi-phase
flow,
this equation
can be
modified
as:
Per
=
A
(11-39)
(11-40)
in
which
the
total particle mass
flux
is
given
by:
V
J
J
(11-41)
and the
saturation weighted average particle diameter
is
given
by:
V
(11-42)
Liu
and
Civan
(1993,
1995, 1996)
have resorted
to a
simplified
approach
in
an
adhoc manner
and
demonstrated
by
comparison
of the
results
with
experimental
data that
it
works. They assumed that
the
fraction
of the
plugged
pore throats
is
proportional
to the
amount
of
particles detained
behind
the
plugged pore throats. Therefore, their expression
for the
fraction
of the
nonplugged pore throats
can be
written
as:
(11-43)
250
Reservoir
Formation
Damage
where
k
tjj
are
some empirical coefficients. They considered that there
is
a
minimum
characteristic
value
of
(/.)
. for
which
the
pore
throat
V^'/mm
r
blocking
happens.
Thus,
(11-44)
Colloidal Mobilization
The
volumetric rate
of
colloidally induced surface particle release
can
be
expressed
as, by
modifying
the
formulations
by
Khilar
and
Fogler
(1983)
and
Civan (1996):
QJJJS
=
d
^ejjjs/dt
=
subject
to the
initial condition
eejjjs=e°ejjjs>
'
=
0
Liu
and
Civan (1996) assumed
r\
e
=1
and
/)
y
=1.
Note that
=0
'
when
c
J<
c
crj
(11-45)
(H-46)
Hydraulic Mobilization
The
volumetric rate
of
surface particle mobilization
by the
fluid
shearing force
can be
expressed
by
modifying
the
formulations
by
Khilar
and
Fogler
(1983)
and
Civan (1996)
as:
S
^
e
^
3
f
S
ij-i
crJ
(11-48)
subject
to the
initial condition
Liu
and
Civan (1993,
1995,
1996) assumed
v\
e
=
1
,
f
js
= 1 and
$
*
constant
and
used
(i
y
-
i
crj
J
~
\Uj
-
u
crj
j.
Note
(11-50)
&,.,.„
= 0,
when
I.<
i
.
or u, < u
.
hjJjS
J
crj
J crJ
Two-Phase
Formation
Damage
by
Fines
Migration
251
Porosity
and
Permeability Variation
The
porosity
is
expressed
by
(Liu
and
Civan,
1996):
(11-51)
*JSj
J
S j
and
the
permeability
is
estimated
by
(Liu
and
Civan,
1996)
(11-52)
Filter Cake Formation
on the
Injection Face
When
the
suspended particles existing
in the
injected
fluid
are
large
enough they cannot invade
the
formation
or
when
a
sufficient
amount
of
fine
particles
are
deposited
in the
porous formation
to
prevent particle
invasion,
a
filter cake formation begins over
the
injection face.
Liu and
Civan
(1995,
1996)
applied
a
rate equation
for the
filter cake buildup
similar
to
(Peng
and
Peden, 1992):
d±
dt
(11-53)
Model Assisted Analysis
of
Experimental Data*
In
this
section,
the
application
of the
model
to the
analysis
of
formation
damage
in a
variety
of
core tests
is
demonstrated.
The
model
was
vali-
dated
and
model parameters were determined using
the
data
of
core tests.
Damage
by
Formation Fines Migration
Sarkar
and
Sharma
(1990)
examined fines migration
in two
Berea
core
samples,
one of
them containing residual
oil
(ROS). Data
for the two
core
tests
are
given
in
Table
11-1.
The
core
samples were first saturated with
3%
NaCl
brine. Formation damage
due to
fines
migration took place upon
fresh
water injection. Values
of
some model
parameters
were
gathered
from
Khilar
and
Fogler (1983) while
the
others were obtained
by
matching
the
model responses
to the
measured data,
as
summarized
in
Table
11-2.
Reproduced
by
permission
from
Liu and
Civan, ©1996
SPE;
reprinted
by
permission
of
the
Society
of
Petroleum
Engineers.
252
Reservoir
Formation
Damage
Table 11-1
Core
Test
Data
for
Fines
Migrations*
Data
Core
without
ROS
Core
with
ROS
Core
diameter
(cm)
Core
length
(cm)
Initial
porosity
(fraction)
Initial
permeability
(Darcy)
Residual
oil
saturation
End-point
relative
permeability
Injection
velocity
(cm/s)
Water
viscosity
(cp)
2.54
8.30
0.21
0.0654
0.0
1.0
4.31
x
10"
4
1.0
2.54
8.30
0.21
0.0825
0.367
0.038
4.31X10"
4
1.0
*
Information extracted
from
Sarkar
and
Sharma, 1990.
After
Liu and
Civan,
©1996
SPE; reprinted
by
permission
of the
Society
of
Petroleum Engineers.
Table 11-2
Model
Parameters
for
Fines
Migrations*
Parameter
Core
without
ROS
Core
with
ROS
<5
fpo
(gm/cm
3
)
C
sc
(mole/liter)
k
crjp,w
(
s
'
liter/mole)
k
hrfpw
(cm~
l
)
k
pt/pw
(cm"
1
)
k
fetfp
(cm
3
/gm)
f .
•J
mm
k
P
0.025
7.0 x
10~
3
0.435
0.0
5.25
35.4
0.0
0.0
0.02
7.0 x
10~
3
0.28
0.0
5.25
35.4
0.0
0.0
*
After
Liu and
Civan,
©1996
SPE; reprinted
by
permission
of the
Society
of
Petroleum Engineers.
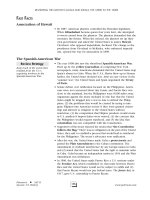
Figure 11-2 shows that
the
simulation results favorably represent
the
experimental data
for the two
core
tests.
The
simulation
study
also
confirms
that formation damage
in the
presence
of oil is
less pronounced.
As
can be
seen
in
Table
11-2,
the
amount
of
formation
fines
that
can be
released
from
the
pore surface,
°/
p
°,
is 20%
less
and the
rate constant
for
fines release
due to
colloidal
effects,
k
cr<fptW
,
is 35%
lower
in the
presence
of
residual oil.
Sarkar (1988) conducted
a
laboratory test using
a
Berea core
of
8.27
cm in
length
to
investigate fines migration
in
two-phase flow.
The
core porosity
and
permeability initially were 0.21 fraction
and
0.122
Darcy,
respectively.
The
core saturated with crude
oil was
displaced with
3%
Two-Phase
Formation
Damage
by
Fines
Migration
253
0.1
I"
0.01
5
2
0.001
0.5
1 1.5 2 2.5
Pore
Volume
of
Injected
Fluid
"
Exp.withROS
a
Exp.w/oROS
Simulation
Figure
11-2.
Instantaneous
to
initial
permeability
ratio
(or
permeability
alteration
factor)
vs.
pore
volume
during
formation
fines
migration
in
single-
phase
flow
(Liu
and
Civan,
©1996
SPE;
reprinted
by
permission
of the
Society
of
Petroleum
Engineers).
NaCl
brine. Berea sandstones generally
do not
suffer
from
permeability
reduction during
a
brine
flood.
Neglecting
the
effects
of
capillary pressure,
the
model
was
used
to
simulate
the
two-phase
flow
test. Relative perme-
ability data were obtained
by
matching
the
simulated results with
the
measured
pressure drop across
the
core
as
shown
in
Figure
11-3.
An oil
flood
was
then carried
out to
reestablish
the
connate water saturation.
The
core
was
finally
displaced
with fresh water
and
formation damage
took
place
due to
fines migration
in
two-phase
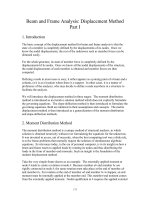
flow.
Using
the
relative perme-
abilities obtained
from
the
two-phase
flow
test without formation damage,
simulation
was
carried
out to
match measured pressure drop
as
shown
in
Figure
11-4.
Alteration
in the
rock permeability, predicted
in
Figure
11-5, indicates that formation damage
due to
fines migration
in
two-phase
flow
of
oil and
fresh
water
is
similar
to
that
of
single-phase
flow of
fresh
water
in the
presence
of
residual
oil.
Detailed information
on
core data
and
model parameters
in
this case
is
presented
elsewhere
(Liu
and
Civan,
1995).
Damage
by
Particle
Invasion
Experimental data
of two
similar core samples conducted
by
Eleri
and
Ursin
(1992) were used
to
analyze formation damage
due to
particle
invasion.
The two
samples were
labeled
as
Core
#26 and
Core
#27 in
the
Eleri
and
Ursin (1992) study. Prior
to flow
tests,
the
core samples
254
Reservoir Formation Damage
1.7-
o
I
1.4H
£
1.3H
'0.3
0.35
0.4
0.45
0.5
0.55
0.6
0.65
0.7
Pore
Volume
of
Injected
Fluid
«
Experiment
Simulation
Figure
11-3. Pressure drop across
an
undamaged core
vs.
pore volume
during two-phase flow (Liu
and
Civan, ©1996 SPE; reprinted
by
permission
of
the
Society
of
Petroleum Engineers).
35
30-
+3
9^"
o
20
O
2
1*><
3
15
g
10-
o.
5-
0
0.2 0.4 0.6 0.8 1 1.2
Pore
Volume
of
Injected
Fluid
«
Experiment
Simulation
Figure
11-4.
Pressure drop across
a
damaged core
vs.
pore volume during
two-phase
flow
(Liu
and
Civan, ©1996 SPE; reprinted
by
permission
of the
Society
of
Petroleum Engineers).
Two-Phase Formation Damage
by
Fines
Migration
255
0.1:
0.01
0.5 1 1.5
Pore
Volume
of
Injected Fluid
Figure
11-5.
Predicted instantaneous
to
initial permeability ratio
(or
perme-
ability alteration
factor)
vs.
pore volume during formation fines migration
in
two-phase
flow
(Liu
and
Civan, ©1996
SPE;
reprinted
by
permission
of the
Society
of
Petroleum Engineers).
were treated
to
eliminate formation
fines
migration. Latex particles
of
less
than
3
microns
in
size suspended
in
water were injected into Core
#26
at
the
concentration
of 0.5 x
10~
4
gm/cm
3
and
into Core
#27 at the
concentration
of 2.0 x
10"
4
gm/cm
3
.
Simulations were performed
to
examine
the
two
tests. Permeability alteration versus cumulative volume
of
injected
fluid
is
illustrated
in
Figure
11-6
including
a
comparison between experi-
mental
and
simulated results. Detailed information
on
core data
and
model
parameters
in
this case
is
presented
by Liu and
Civan (1993).
All
model
parameters
for the two
core tests
are the
same except
thatf
min
=
0.58
for
Core
#26
and/„,,-„
=
0.41
for
Core
#27.
The
difference reveals that higher
particle concentration causes more pores being plugged. Both experimental
and
simulation results indicate that particle concentration
is a
major factor
for
formation damage caused
by
particle invasion.
Damage
by Mud
Filtration
Rahman
and
Marx
(1991)
studied formation damage
by mud
filtration.
A
core sample
was
contaminated
by
circulating
a
drilling
fluid
over
the
surface
of
core inlet under
a
constant differential pressure
of
34.54
atm
across
the
core.
Before
mud
filtration,
the
core
was
saturated with
1.5%
KC1
water
to
prevent formation fines migration. Permeability
256
Reservoir Formation Damage
500
1000 1500 2000 2500 3000
Volume
of
Injected
Fluid
(ml)
Core
#26
Core
#27
Simulation
Figure
11-6.
Instantaneous
to
initial
permeability ratio
(or
permeability
alteration factor)
vs.
pore volume during external fines invasion
(Liu
and
Civan,
©1996
SPE;
reprinted
by
permission
of the
Society
of
Petroleum Engineers).
alteration along
the
core
was
measured
after
one
hour
of mud
con-
tamination.
Data
for the
core test
and
values
of
model parameters
for
simulation
are
presented elsewhere
by Liu and
Civan (1993). Experi-
mental
and
simulated results
for
drilling
fluid
loss versus time
and
permeability alteration versus core distance
after
one
hour
of mud
con-
tamination
are
illustrated
in
Figures
11-7
and
11-8. Simulation results
indicate
that
the
model
can
favorably represent
the
process
of mud
filtration.
Another
laboratory test involving dynamic
mud
filtration
was
con-
ducted
by
Jiao
and
Sharma (1992).
A
fresh
water-based
mud was
circu-
lated over
the
surface
of
core inlet
and
infiltrated into
a
Berea core under
an
average differential
pressure
of
6.29
atm
across
the
system. This
Berea
core
sample
was
previously saturated with
3%
NaCl
brine. Formation
damage
in
this test
is
caused
by
external solid invasion
and
formation
fines
migration. Pressure taps were placed
at
different
locations along
the
core
of
20.34
cm in
length
to
measure permeability change during
the
test.
Experimental
and
simulated
mud
filtration volumes
are in
good
agreement,
as
presented
in
Figure 11-9.
As
shown
in
Figure
11-10,
experimental results
of
permeability alteration
in the
core section between
6.35
cm and
11.43
cm
from
core inlet compare quite well with simulation
results.
Further discussion
on the
simulation
of
this test
is
presented
elsewhere (Liu
and
Civan, 1993).