Reservoir Formation Damage Episode 3 Part 7 potx
Bạn đang xem bản rút gọn của tài liệu. Xem và tải ngay bản đầy đủ của tài liệu tại đây (1.24 MB, 25 trang )
632
Reservoir
Formation
Damage
Models Separating
the
Internal
and
External Filtration Processes
For
convenience
in the
modeling, Pang
and
Sharma (1994) divide
the
entire filtration process into
two
phases:
(1) the
initial internal cake
filtration,
and (2) the
later external cake filtration. They separate these
two
filtration phases
by a
"transition
time"
after
which
the
particle
migration
into porous formation becomes negligible
and an
external
filter
cake begins forming over
the
injection well formation face. Sharma
and
Pang (1997) assumed that transition
from
the
internal
to the
external cake
filtration
occurs when
the
porosity,
((),
of the
formation face decreases
to
a
minimum critical value,
({>*,
by
particle deposition, below which particle
invasion
into porous media
is not
possible.
Their
models apply
for
single
phase water
flow in the
near wellbore region. Hence,
the
effect
of the
oil-water two-phase flow during
the
initial water injection period
is
neglected because this initial period
is
relatively short.
Transition Time
Wennberg
and
Sharma (1997) estimate
the
transition time based
on the
expressions given
by
Iwasaki (1937)
for
particle deposition rate
and the
filtration
coefficient, respectively,
as:
do/dt
=
(19-14)
and
(19-15)
where
b is an
empirical constant
and
X,
0
is the
filtration coefficient
without
particle deposition. Although more sophisticated expressions
are
available
in the
literature
(See
Chapter
8),
they used
Eq.
19-15
for
simplicity.
Thus, invoking
Eq.
19-15
into
Eq.
19-14
yields
the
following
expression, similar
to the
rate equation
for
particle
deposition
in
pluggable
pathways
given
by
Gruesbeck
and
Collins (1982):
(19-16)
They obtain
the
analytic solution
of Eq.
19-16
for
constant
flow
rate
and
suspension
particle concentration
for two
cases
as the
following:
1
*
1
f\
/
t
f\
t
T\
<5
=
huct
, b =
0
(19-1/)
Injectivity
of the
Waterflooding
Wells
633
(19-18)
At
the
transition time,
the
porosity attains
the
minimum critical porosity,
<|>*
,
and the
maximum critical volume fraction
of the
deposited particles
becomes
a*
=
(|)
0
-
(j)*
.
Under these conditions,
Eqs. 19-17
and 18
can
be
used
to
obtain
the
following expressions, respectively,
for the
transition
time:
(19-19)
(19-20)
Internal Filtration Models
Pang
and
Sharma
(1994,
1995)
and
Sharma
et
al.
(1997)
have pursued
their derivations
in
terms
of the
following variables:
V
=
M/(])
(19-21)
K'
=
Kv
(19-22)
n
=
o/<|)
(19-23)
Here,
v
represents
the
interstitial velocity
of the
fluid
phase
and n
denotes
the
fraction
of the
pore space occupied
by the
particle deposits
in
porous
media.
X'
is the
product
of the
deposition rate constant,
K,
and the
interstitial
velocity
of the
flowing suspension.
In the
following, their
formulations
are
presented
in a
manner consistent with
the
rest
of the
presentation
of
this chapter.
The
damage
of a
core plug
by the
injection
of a
dilute particulate
suspension
can be
described
by
means
of the
volumetric balance equations
of
the
suspended
and
deposited particles
in
porous media, given, respectively,
by
(Wennberg
and
Sharma, 1997):
„
—+
w
—+
—=
0
dt
3;c
3r
and
(19-24)
(19-25)
634
Reservoir
Formation
Damage
subject
to the
initial
and
boundary conditions given
by
(Pang
and
Sharma,
1994):
C
~
C
o\
X
)->
Q~®o\
X
)
i
>
X
^
V
'
t
—
\J
c
=
c
f
(t),
x =
0
,
t>0
The
instantaneous porosity
is
given
by:
(19-26)
(19-27)
(19-28)
The
analytical solution
of
Eqs.
19-24
through
27
used
by
Pang
and
Sharma (1994) implies some simplifications.
It
applies
for the
injection
of
dilute suspension
of
particles. Therefore,
the
effect
of
small amount
of
particle deposition,
a,
compared
to the
initial porosity
can be
neglected,
the
deposition rate coefficient
is
assumed constant,
and a
constant rate
injection
is
considered.
Thus,
the
analytic solution
for
constant
§~$
0
,
A,~X
0
,
and
u
=
u
0
can be
adopted
from
Rhee
et
al.
(1986)
as:
c(x,t)
=
c
0
\x-—
exp
-
Kut
ut
x> —
<D
(19-29)
, x<
—
(19-30)
where
the
term inside
the
square brackets expresses that
c
f
is a
function
of
(t-tyx/u).
Considering that
c
f
(t)
=
c
f
is
constant
and
c
0
(x)
=
Q
and
a
0
(jc)
=
0 in
the
laboratory core
flow
tests, Pang
and
Sharma (1994)
simplify
Eqs.
19-29
and 30,
respectively,
as:
c(x,t)
=
0,
x>utl§
(19-31)
c(x,t)
=
c
/
exp(-Xjc),
x<ut/$
(19-32)
and
using
Eqs. 19-31
and 32,
they obtain
the
solution
of Eq.
19-25
as:
o(jc,0
= 0,
x>ut/ty
(19-33)
Injectivity
of the
Waterflooding
Wells
635
G(x,t)
=
c
f
kutexp(-X*),
x>ut/ty
(19-34)
Pang
and
Sharma
(1995)
assumed that
the
permeability reduction
primarily
occurs
by
pore throat plugging. Therefore, they estimated
the
permeability
of the
porous formation
as a
harmonic average permeability
of
the
combined plugged
and
unplugged regions
as:
(19-35)
where
f
p
represents
the
volume fraction
of the
deposited particles
con-
tributing
to
pore throat plugging,
K
p
denotes
the
permeability
of the
plugged region near
the
pore throats,
and
K
m
is the
permeability
of
the
formation matrix, assumed
to
remain constant, which
is
equal
to the
initial nondamaged permeability,
K
0
(i.e.,
K
m
=K
0
}.
Therefore, Pang
and
Sharma (1995) rearranged
Eq.
19-35
for the
relative
or
fractional retained
permeability
of the
porous formation undergoing particle deposition
from
dilute suspensions
as,
inferred
by
Payatakes
et
al.
(1974):
K(x,t)
=
/L
where
P
is an
empirical damage factor given
by:
P
=
/,(*./*,-
1
)
(19-36)
(19-37)
Thus, they calculate
the
harmonic average permeability
of the
damaged
portion
of the
core
by:
K(t\-
Xf
{
dx
K(t)
-T
0
n^t
(19-38)
Substituting
Eqs. 19-33,
34, and 36
into
Eq.
19-38,
and
then inte-
grating, they derive
the
following expression:
(19-39)
in
which
636
Reservoir
Formation
Damage
N
=
(19-40)
Note that
Eq.
19-39
was
previously derived
by
Wojtanowicz
et
al.
(1987,
1988)
as
described
in
Chapter
10.
Applying
Eqs. 19-1
through
3,
10, 12, and 13, the
injectivity ratio
for the
linear cases, applicable
to
laboratory core plugs without external cake formation
(/?
c
=
0),
is
given
by:
a(t)
=
where
*(*/)
(19-41)
x
f
=
ut ut
<L
(19-42)
x
f
=
,
—>L
(19-43)
Pang
and
Sharma (1994)
simplify
Eq.
19-41
by
considering that
the
injection
front
reaches
the
outlet
end of the
core
rapidly. Therefore,
neglecting
the
damage during
the
short period
of
time until
the
front
reaches
the
core outlet,
Eqs. 19-39
and
41
yield
for
x
f
- L the
following
equation
indicating that
the
reciprocal
injectivity
ratio
is a
linear
function
of
time:
1
(19-44)
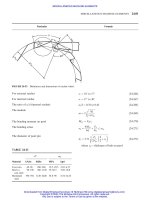
External Filtration Models
Considering
the
formation
of an
incompressible external cake with-
out
any
particle invasion into
the
core plug, Pang
and
Sharma (1994)
expressed
the
harmonic average permeability
of the
cake
and the
core
system
(Figure
19-2)
as:
h
h
_
K(t)
~
K
c
(t}
K
0
(19-45)
Injectivity
of the
Waterflooding
Wells
637
Sharma
et al.
(1997) determine
the
thickness
of the
external filter cake
by
means
of a
volumetric balance
of the
particles
in the
cake
as:
h
c
=
0,
t < t
*
(19-46)
h
=
,
t>f
(19-47)
where
A is the
cross-sectional area
of the
core plug
and
c
f
is the
volume
fraction
of the
fine
particles
in the
water injected
at a
flow
rate
of q.
For
constant
c
f
and
q,
Eq.
19-47
simplifies
as:
(19-48)
Thus, substituting
Eq.
19-48
into
45 and
considering that
the
filter cake
thickness
is
much smaller than
the
length
of the
core plug (i.e.,
h
c
«
L),
they
obtained
the
following expression indicating that
the
reciprocal
injectivity
ratio
is a
linear
function
of
time:
1
<x(0
where
(19-49)
(j>L
(19-50)
Filtration
Coefficient
Wennberg
and
Sharma (1997) point
out
that
the
filtration coefficient
varies
by
particle deposition according
to:
(19-51)
in
which
K
0
is the
filtration coefficient with
no
deposited particles
and
F(o)
is a
function
of the
volume fraction
of
particles deposited. Their
638
Reservoir Formation Damage
review
of the
various expressions available
for
prediction
of the
filtration
coefficient
is
summarized
and
presented
in the
following.
Ives
(1967) proposed
a
general expression
as:
(19-52)
in
which
x,
v,
z, and
p
are
some
empirical
parameters
and
a
M
is the
maximum
of the
volume
fraction
of the
deposited particles necessary
to
make
the
filtration coefficient
of
porous media zero. This equation
indicates that
the
filtration coefficient
is
equal
to one
when there
is no
deposited particles
in
porous media,
and the
filtration
coefficient
becomes
zero when
the
volume fraction
of
deposited particles reaches
a
certain
characteristic value
of
maximum
a
M
.
Chiang
and
Tien
(1985)
developed
an
empirical correlation
as:
X
2
)>a<10~
2
(19-53)
where
N
r
is the
suspended particle
to
porous media grain diameter ratio:
N
r
=
D
p
/D
g
(19-54)
Rajagopalan
and
Tien (1976) developed
the
following expression:
A,
=
Q.
+
2.4x10'
<0.18
(19-55)
in
which
the
dimensionless groups
are
defined
as
following.
A
s
is
Happel's
dimensionless geometric parameter.
A^
is the
London parameter given
by
(19-56)
where
H =
3.0x10
I3
erg
is
Hamaker's
constant.
N
g
is the
gravity number
given
by:
(19-57)
Injectivity
of the
Waterflooding
Wells
639
N
pe
is the
peclet number given
by:
N
pe
=vD
g
/D
(19-58)
v
is
velocity,
ILL
is
viscosity,
and
p
p
and
p
e
denote
the
particle
and fluid
densities, respectively.
(3
is a
packing parameter given
by
,1/3
(19-59)
where
0
is the
porosity
in
fraction.
D is the
coefficient
of
diffusion
for
the
Brownian motion
of
particles.
Wennberg
and
Sharma (1997) analyzed
the
measurements
of the
filtration
coefficient
reported
by
various investigators
and
determined that these
data mostly indicate power law-type relationships
to the
volumetric
flux,
the
suspended particle size,
and the
porous media grain size
as:
X~M-
a
,Z)P,zy
(19-60)
where
a, (3, and y are
some empirical exponents. They determined that
0<a
<
2; (3
>0
for
D
p
>
liim
and (3 < 0 for
D
p
<
Ijim;
0.6
<|3
< 1.2 for
Ottawa sand;
and y
=
0.9 and 2.
Diagnostic-Type Curves
for
Water Injectivity Tests
Pang
and
Sharma
(1994,
1997)
identified
four
distinct type curves that
can
be
used
for
interpretation
of the
water-quality tests. They justified
these
type curves with experimental data obtained
from
the
literature
as
shown
in
Figure
19-3.
Type curve
1 is a
straight line indicating
the
formation
of an
incompressible external filter cake
or a
thin internal
cake
near
the
injection
face
of the
core plug according
to Eq.
19-49.
The
slope
remains constant. Type curve
2 is for the
similar
case,
but
applies
for
compressible cakes.
In
this
case,
the
porosity
and
permeability
of the
cake
decrease
by
increasing filtration pressures.
As a
result,
the
slope
of the
curve
increases with
the
filtration time
or
pore
volume injected. Type
curve
3
refers
to a
deep
particle invasion
and
pore filling
in the
core
plug,
leading
to a
slower gradual permeability
decrease.
As a
result,
the
slope
of
the
curve
decreases
with
the
filtration time. Type curve
4 may be an
S-shaped
or
other types
of
curves indicating
a
shift
of the
dominance
of the
different
damage mechanisms during
the
filtration
process.
8
•5
•a
500
1000 1500
Pore Volumes Injected
(a)
2000
4000
8000
Pore Volumes Injected
(b)
12000
o
O
P
1-4
,3
1-3
1.2
1.1
2000
4000
6000
Pore Volumes Injected
(c)
8000
o
£
g
+3
B
S
•8
I
10
20 30 40
Pore
Volumes Injected
(d)
Figure
19-3. Diagnostic-type curves:
(a)
Type curve
1
(data from Todd
et
al.,
1979),
(b)
Type curve
2
(data from Todd
et
al.,
1984),
(c)
Type curve
3
(data from Todd
et
al.,
1979),
and (d)
Type curve
4
(data from Pautz
et
al.,
1989) (after
Pang
and
Sharma, ©1997 SPE; reprinted
by
permission
of the
Society
of
Petroleum Engineers).
Injectivity
of the
Waterflooding
Wells
641
Models
for
Field Applications
Pang
and
Sharma
(1994,
1995, 1997)
have also applied
the
above
methodology
and
derived
the
models
for
prediction
of the
injectivity ratio
given
in
Table
19-1
for
other cases. Specifically,
the
open-hole, perforated
and
fractured
wells
as
depicted
in
Figures
19-1,
19-4
and
19-5
are
con-
sidered separately
in
Table
19-1
for the
internal
and
external
filtration
phases.
Figure
19-4.
Details
of
perforation
for
analysis
of
internal filtration
(after
Pang
and
Sharma,
©1995
SPE;
reprinted
by
permission
of the
Society
of
Petroleum
Engineers).
wkf
Lf
Figure
19-5.
Details
of
vertical hydraulic fracture
for
analysis
of
internal
filtration (after Pang
and
Sharma,
©1995
SPE;
reprinted
by
permission
of the
Society
of
Petroleum Engineers).
642
Reservoir Formation Damage
Table
19-1
Models
for
Prediction
of the
Injectivity Ration
Open
hole well
a
k
r
(r
f
)
ln(r
e
/rj
\n(rjr
w
)
=J—
=
1
+
Mt
MO
M
=
8f
a
£
c
ln(r
e
/r
w
)
t
=
ln—2^-
8
=
f
=
exp(a)£/(a)
-
Ei(arJ
/r£
Ei(x)=
\~—du
J
*
U
r)
=
h=-
-
2itrh
for
for
qt/(nh$
m
)>r
e
2
-
Perforated well
-1
k(r,t)
=
C,-
=exp(w,)
tanhw,
=
rj/
H
=
c
G/iA^
n
Injectivity
of the
Water-flooding
Wells
643
Table
19-1
continued
Hydraulically
fractured
well
1
+
C7?
a
k
r
(x
f
)
x
f
= Vt for Vt <
r
e
x
f
-
r
e
for
Vt
>
r
e
1
MO
.
e
In
—
+ln
L)
\r
w
/L
f
+CR
CR
=
wk,
KL
f
k
0
wk
fi
CR:
=
~
=
l-exp(-Xr
e
/V)
k
=
fl
n(*,0
=
0
forjt>Vf
n(jt,
0
=
XQ
exp(-Xjc/V)
for
;c
<
W
(Fracture Damage)
After
Pang
and
Sharma, ©1995
SPE;
reprinted
by
permission
of the
Society
of
Petroleum Engineers.
Models Coupling
the
Internal
and
External Filtration
Processes
Liu
and
Civan (1996) have developed
a
differential,
phenomenological
model that couples
the
external cake formation
and the
near wellbore
invasion
and
deposition
of
fine
particles.
This
model
is
applicable
for the
oil-water
two-phase
flow
systems encountered during
waterflooding
of
oil
reservoirs. Whereas,
the
applicability
of the
models
by
Pang
and
Sharma (1994,
1995,
1997), Sharma
et
al.
(1997),
and
Wennberg
and
Sharma
(1997)
is
limited
to the
single-water phase system that occurs
during
late periods
of the
waterflooding
in the
near wellbore region
because these models neglect
the
initial, two-phase
flow
in the
near
wellbore region. Although
the
initial near wellbore, two-phase
flow
period
of
waterflooding
may be
short
and,
therefore,
negligible
for the
actual
oil
reservoirs,
it is not
negligible
for the
core plug flow tests.
The
description
of the Liu and
Civan
(1996)
model
for
impairment
of the
near
wellbore region
is
given
in
Chapter
11.
Therefore, this subject
is not
repeated here.
644
Reservoir
Formation
Damage
References
Barkman,
J. H., &
Davidson,
D. H.,
"Measuring Water Quality
and
Predicting
Well Impairment," JPT,
Trans.,
AIME,
Vol. 253,
July
1972,
pp.
865-73.
Chiang,
H. W., &
Tien,
C.,
"Transient Behavior
of
Deep-Bed Filters,"
Symp.
Adv.
in
Solids-Liquid
Separ.,
University College, London,
1983.
Chiang,
H.
W.,
&
Tien,
C.,
"Dynamics
of
Deep
Bed
Filtration, Part
I and
II,"
AIChE
J.,
Vol.
31,
August
1985,
p.
1349.
Civan,
F,
"Quadrature Solution
for
Waterflooding
of
Naturally Fractured
Reservoirs,"
SPE
Reservoir Evaluation
and
Engineering, April
1998,
pp.
141-147.
Davidson,
D.
H.,
"Invasion
and
Impairment
of
Formations
by
Particu-
lates,"
SPE
Paper
8210,
Presented
at the
54th Annual Fall Meeting
of
the
SPE,
Las
Vegas, Nevada, September
23-26, 1979.
Donaldson,
E.
C.,
Baker,
B.
A.,
&
Carroll,
H. B.,
Jr.,
"Particle Transport
in
Sandstone,"
SPE
Paper
6905,
Presented
at the
52nd Annual Tech-
nical
Conference
of
SPE,
Denver, Colorado, October
9-12, 1977.
Folger,
H. S.,
Elements
of
Chemical Reaction Engineering, Prentice-Hall,
Englewood
Cliffs,
New
Jersey,
1986,
pp.
197-198.
Gruesbeck,
C.,
&
Collins,
R.
E.,
"Entrainment
and
Deposition
of
Fine
Particles
in
Porous Media,"
SPEJ,
December
1982,
pp.
847-856.
Hofsaess,
T., &
Kleinitz,
W.,
"Injectivity
Decline
in
Wells with
Non-
uniform
Perforation Properties,"
SPE
39586 paper, Proceedings
of the
1998
SPE
International Symposium
on
Formation Damage Control,
February
18-19, 1998,
Lafayette, Louisiana,
pp.
631-640.
Ives,
K.
J.,
Deep Filters,
Filtr.
Sep.,
March/April
1967,
pp.
125-135.
Iwasaki,
T,
"Some Notes
on
Sand Filtration,"
J. Am.
Water
Works
Ass.,
Vol.
29,
1937,
pp.
1591-1602.
Liu,
X.,
&
Civan,
F.,
"A
Multi-Phase
Mud
Fluid
Infiltration
and
Filter
Cake Formation
Model,"
SPE
25215 paper, Proceedings,
SPE
Inter-
national
Symposium
on
Oilfield Chemistry, February 28-March
3,
1993,
New
Orleans, Louisiana,
pp.
607-621.
Liu,
X.,
&
Civan,
F.,
"Characterization
and
Prediction
of
Formation
Damage
in
Two-Phase Flow Systems,
SPE
25429
paper, proceedings
of
the SPE
Production Operations Symposium, March
21-23, 1993,
Oklahoma City, Oklahoma,
pp.
231-248.
Liu,
X.,
&
Civan,
F,
"Formation Damage
and
Skin Factors
Due to
Filter
Cake Formation
and
Fines Migration
in the
Near-Wellbore
Region,"
SPE
27364 paper, Proceedings
of the
1994
SPE
Formation Damage
Control Symposium,
Feb. 9-10, 1994,
Lafayette, Louisiana,
pp.
259-274.
Liu,
X.,
&
Civan,
F.,
"Formation Damage
by
Fines Migration Including
Effects
of
Filter Cake, Pore Compressibility
and
Non-Darcy
Flow—
Injectivity
of the
Waterflooding
Wells
645
A
Modeling Approach
to
Scaling
from
Core
to
Field,"
SPE
Paper
No.
28980,
SPE
International Symposium
on
Oilfield Chemistry, February
14-17, 1995,
San
Antonio,
TX.
Liu,
X.,
&
Civan,
F.,
"Formation Damage
and
Filter Cake Buildup
in
Laboratory Core Tests: Modeling
and
Model-Assisted
Analysis,"
SPE
Formation Evaluation
J.
(March
1996) Vol.
11, No. 1, pp.
26-30.
Pang,
S., &
Sharma,
M. M., "A
Model
for
Predicting Injectivity Decline
in
Water Injection Wells,"
SPE
Paper 28489, presented
at the SPE
69th
Annual
Technical
Conference
and
Exhibition
in New
Orleans,
September
25-28, 1994,
pp.
275-284.
Pang,
S.,
&
Sharma,
M.
M.,
"Evaluating
the
Performance
of
Open-Hole,
Perforated
and
Fractured Water Injection Wells,"
SPE
Paper 30127,
presented
at the SPE
European Formation Damage Control Conference,
the
Hague,
May
15-16, 1995.
Pang,
S.,
&
Sharma,
M.
M.,
"A
Model
for
Predicting
Injectivity
Decline
in
Water Injection Wells,"
SPE
Formation Evaluation, September
1997,
pp.
194-201.
Pautz,
J.
F.,
et
al.,
"Relating Water Quality
and
Formation Permeability
to
Loss
of
Injectivity,"
SPE
Paper
18888,
presented
at the SPE
Production
Operations Symposium, Oklahoma City, Oklahoma, March
13-14, 1989.
Payatakes,
A.
C.,
Rajagopalan,
R., &
Tien,
C.,
"Application
of
Porous
Media Models
to the
Study
of
Deep
Bed
Filtration,"
The
Canadian
Journal
of
Chemical
Engineering,
Vol.
52,
December
1974.
Rajagopalan,
R.,
&
Tien,
C.,
"Trajectory Analysis
of
Deep-Bed Filtration
with
the
Sphere-in-cell
Porous Media Model,"
AIChE
J.,
Vol.
22, May
1976,
pp.
523-533.
Rhee,
H. K.,
Aris,
R.,
&
Amundson,
N.
R.,
First-order Partial
Differential
Equations:
Volume
I,
Prentice-Hall,
1986.
Sharma,
M.
M.,
Pang,
S.,
&
Wennberg,
K. E.,
"Injectivity
Decline
in
Water Injection Wells:
An
Offshore
Gulf
of
Mexico Case Study,"
SPE
Paper
38180,
Proceedings
of the
1997
SPE
European Formation
Damage Conference held
in the
Hague,
The
Netherlands, June
2-3,
1997,
pp.
341-351.
Todd,
A.
C.,
et
al.,
"Review
of
Permeability Damage Studies
and
Related
North
Sea
Water Injection,"
SPE
Paper 7883, presented
at the SPE
International Symposium
on
Oilfield
and
Geothermal
Chemistry, Dallas,
Texas, January
22-24, 1979.
Todd,
A.
C.,
et
al.,
"The
Application
of
Depth
of
Formation Damage
Measurements
in
Predicting
Water Injectivity
Decline,"
SPE
Paper
12498, presented
at the
Formation Damage Control Symposium held
in
Bakersfield, California, February
13-14, 1984.
Todd,
A.
C.,
et
al.,
"The
Value
and
Analysis
of
Core-Based Water Quality
Experiments
as
Related
to
Water Injection Schemes,"
SPE
Paper
17148,
646
Reservoir Formation Damage
presented
at the SPE
Formation Damage Control Symposium held
in
Bakersfield,
California, February
8-9, 1988.
van
Oort,
E., van
Velzen,
J. F. G., &
Leerlooijer,
K.,
"Impairment
by
Suspended
Solids Invasion: Testing
and
Prediction,"
SPE
Production.
&
Facilities,
August
1993,
pp.
178-184.
Vetter,
O.
J.,
et
al.,
"Particle Invasion into Porous Medium
and
Related
Injectivity
Problems,"
SPE
Paper
16625,
presented
at the SPE
Inter-
national
Symposium
on
Oilfield
and
Geothermal Chemistry
in San
Antonio, Texas, February
4-6, 1987.
Wennberg,
K.
E.,
&
Sharma,
M. M.,
"Determination
of the
Filtration
Coefficient
and the
Transition Time
for
Water Injection Wells,"
SPE
Paper
38181,
Proceedings
of the
1997
SPE
European Formation
Dam-
age
Conference held
in the
Hague,
The
Netherlands, June
2-3, 1997,
pp.
353-364.
Wojtanowicz,
A.
K.,
Krilov,
Z.,
&
Langlinais,
J. P.,
"Study
on the
Effect
of
Pore Blocking Mechanisms
on
Formation Damage,"
SPE
16233
paper, presented
at
Society
of
Petroleum Engineers Symposium,
Oklahoma
City, Oklahoma, March
8-10, 1987,
pp.
449-463.
Wojtanowicz,
A.
K.,
Krilov,
Z.,
&
Langlinais,
J. P.,
"Experimental
Determination
of
Formation Damage Pore Blocking Mechanisms,"
Trans,
of the
ASME, Journal
of
Energy
Resources
Technology,
Vol.
110,
1988,
pp.
34-42.
Chapter
20
Reservoir Sand
Migration
and
Gravel-Pack
Damage:
Stress-Induced
Formation
Damage,
Sanding
Tendency,
Prediction,
and
Control
Summary
Characteristics
of
reservoir formations susceptible
for
sand production
are
reviewed.
The
mechanical
and
hydrodynamic
processes
causing sand
production,
migration,
and
retention
in
reservoir formations
are
described
and
modeled. Typical features
of
effective
gravel pack designs
are
explained.
The
various parameters
effecting
the
gravel-pack
efficiency
are
discussed.
A
predictive model
for
sand filtration
and
retention
in
gravel-packs
is
presented
and
verified
by
means
of
typical test data.
Introduction
As
stated
by
Geilikman
and
Dusseault (1997), "Sand production
is a
fluid-saturated
granular
flow." It has
been observed that fines migration
and
well sanding tend
to
increase
by
rising water cuts beyond
a
certain
threshold
as a
result
of
water-coning
(or
water
cresting)
induced
by
high
rate production
(Hayatdavoudi,
1999).
Hayatdavoudi
(1999) considers
that
five
important parameters control
the
sand liquefaction process:
(1)
buoyancy
of the
fine
particles,
(2)
variation
of the
effective
density
of
sand,
(3)
pressure build-up
in the
near-wellbore
region,
(4)
weak cohesive
647
648
Reservoir
Formation
Damage
cement
between sand grains,
and (5) low
internal
friction
angle. Hayatdavoudi
(1999) describes that
the
conditions inducing sand problems, include:
(a)
lack
of
grain
to
grain cement
(2-5
percent carbonates, oxides
of
iron,
and
oxides
of
silica cement),
(b)
very small sand grain
size
usually
less than
50-60
microns (very
fine
silt
and
clay sized
material),
(c)
under consolidation/compaction
due to the
deposition
of
sediments
in a
viscous,
low
energy environment (i.e., turbidities),
(d)
rise
of the
water table, water encroachment,
and
water coning,
and
. . . (e)
decreased submerged weight
of the
particle under vari-
able saturation conditions.
Hayatdavoudi
(1999)
explains that high production rates induce sand
production
for
several reasons. First,
the
pore pressure
(net
overburden
stress) increases because
of the
lowering
of the
pore
fluid
pressure.
Second, water invades
the
near-wellbore
formation
as a
result
of
water
coning
(or
cresting), which
in
turn
alters
the
petrophysical parameters,
including capillary pressure, osmotic pressure,
and
clay swelling pressure.
Consequently,
the
effective
shear resistance
of the
formation sand against
the
increasing
pore
pressure
(or
effective
net
overburden
stress)
diminishes
and
conditions favorable
for
sand liquefaction
are
created. Similar reasons
were also suggested
by
Dusseault
and
Santarelli
(1989).
Tremblay
et
al.
(1998)
report
a
communication being established
between injection
and
production wells
500
meters apart
in a
reservoir
through
a
wormhole
because
of
sand production.
In
fact, Tremblay
et al.
(1998) point
out
that even
in
primary production, such
as the
cold
pro-
duction
process
for
recovery
of
heavy
oil
from
unconsolidated formations,
essentially facilitates production
for
better access
to
heavy
oil by
forming
wormholes and/or cavities. Sanding also explains
the
high sand cuts
observed
in
some
oil
wells. Therefore, allowing sand production
and not
using
sand exclusion techniques, such
as
gravel pack
and
screen,
is
essential
for
economic production
of oil
(Geilikman
et
al.,
1994).
Sand Control
The
need
for
sand control
is
determined
by
weakness
of the
formation
and
the
maximum drawdown allowing
flow
without sand production
(Weingarten,
JPT,
1995).
No
measures
for
sand control
may be
necessary
when
drawdown allows production
at
desired rates, otherwise
the
well
may
be
hydraulically fractured
to
obtain
the
desired rate without needing
sand control (Weingarten,
JPT,
1995).
When
the
reservoir formation
is
highly weak,
or the
water
influx
due to
reservoir pressure loss
by
Reservoir
Sand
Migration
and
Gravel-Pack
Damage
649
production induces sand production, proper sand control measures should
be
taken (Weingarten, JPT, 1995).
There
are two
conventional strategies available
in
dealing with sand
production (Geilikman
and
Dusseault, 1997):
(1)
avoiding sand pro-
duction
problems
by
controlling pressure gradient
and fluid flow
rate,
selective perforation
of
zones, resin
injection
and
injecting resin-coated
sand
into formation,
and (2)
excluding sand production using gravel-
packs, screens,
and
slotted liners
in the
wellbore.
For
small zones, chemical sand consolidation treatments, such
as
resin applications,
may be
convenient (Weingarten, 1995). However,
gravel-packing
is
preferred
in
many cases. Gravel packing (GP), con-
ventional
gel
packs (CGP), high-rate water packs (HRWP),
and
frac-
packing
(FP)
are the
most
frequently
applied sand control methods (JPT,
1995). Weingarten (JPT, 1995) states that:
One
obvious measure
of
performance
is
that
the
well should
not
produce sand. This requires proper gravel sizing
and
effective
packing
to
prevent voids. Another
key
measure
of
success
is
pro-
ductivity,
both short
and
long term.
The
well should have
a low
skin,
and
productivity should
not
decline over time owing
to
fines
infiltration
of the
pack
or
perforation tunnels.
King
(JPT, 1995) states that
"reservoirs
with
gas or
water drive
are
bet-
ter
gravel-packing (GP) candidates."
McLarty
(JPT, 1995) explains that:
Laminated sands, severely damaged formations,
and
fines-migration
problems should
be
considerations
for
frac-packing (FP) applica-
tions. FP's
are not
recommended
in
cases where poor cement
has
resulted
or
where nearby water
or gas
zones
may
also
be
stimulated.
The
wellbore's mechanical integrity must
be
able
to
accommodate
higher treating pressures
and the
reservoir pressure should
be
suffi-
cient
to
produce back
the
larger volume
of fluids
required. FP's
would
also
be
applicable
in
situations where
a
well
has
sanded
up
and
it is
suspected that
the
overburden pressure
may
have collapsed
and
pinched
the
reservoir
off
from
the
wellbore.
As
explained
by
Gurley (JPT,
1995):
The
primary objective
of a
frac-packing (FP)
is to
open
and
pack
as
many perforations
as
possible,
and
crate
a
highly conductive
flow
path through
a
damaged zone
or
into
a
low-permeability formation
.
. . The
fracture
needs
to
extend only through
the
damaged zone
650
Reservoir
Formation
Damage
to be
effective,
but it is
necessary
to
penetrate
50 to 100 ft and to
achieve
a tip
screen
out so as to
achieve
a
wide fracture.
King
(JPT, 1995) states that
"reservoirs
with high peak demands
are
good candidates
for
FP's."
Cornette (JPT, 1995) primarily recommends frac-packs (FP), especially
for
sand formations, which
are
prone
to
fines
migration problems,
or of
low
permeability
or
highly laminated types.
Cornette (JPT, 1995) points
out
that conventional
gel
packs (CGP)
cause significant formation
and
perforation damage,
and
therefore
are not
favored,
although they tend
to
lead
to
productive completions
in
forma-
tions
less
than
20
feet
thick.
High-rate water
packs
(HRWP)
are
remedial short frac-packs, recom-
mended
for
formations that
are
clean, homogeneous,
and
high perme-
ability
(K > 50 md for
gas-bearing sands
and K > 100
md
for
oil-bearing
sands)
(Cornette, JPT,
1995).
They
are
less
damaging than
the
con-
ventional
gel
packs (CGP).
Gurley
(JPT, 1995) explains that
The
HRWP objective
is to
assure that
the
perforation tunnels
are
open
and
fully
packed with gravel
. . .
Average fracture width will
be
very limited because
the
fractures
do not
extend very
far
into
the
reservoir.
McLarty (JPT, 1995) explains that
Water packs provide good grain-to-grain contact
and
would probably
be the
recommended
GP
fluid
in
situations where
the
interval
is
particularly
hot (>
280°F),
excessively long
(> 60
ft),
or
highly
deviated
(> 60°
slope). They
may not be
economical
or
favorable
from
a
formation-damage standpoint
in
situations where high-density
brines must
be
applied.
When simultaneous water cut, fines migration,
and
well sanding
problems
are
encountered,
Hayatdavoudi
(1999)
recommends dropping
the
water level
by a
suitable completion technique, such
as (a)
horizontal
drilling,
(b)
producing water
from
below
the
oil/water contact level
and
disposing
it to
another zone,
and (c)
suppressing
the
water-coning
by
choke
adjustment.
Kanj
et
al.
(1996) state that
In
the
final
analysis,
the
decision
on the
sand control requirements
has
to be
based
on
experience
in the
area with natural, perforated
Reservoir
Sand
Migration
and
Gravel-Pack
Damage
651
completions. However, adjustments must
be
made
for
differences
in
completion method
and
efficiency,
hole deviation, well depth,
reservoir pressure, depletion
and
drawdown, water production expec-
tancy,
and
development plans.
Frequently,
sand production problems
are
alleviated
by
means
of
empirical
rules-of-thumb,
heuristic approaches,
and
know-how techniques
(Kanj
et
al.,
1996). Tables
20-1
and
20-2
by
Kanj
et
al.
(1996) compile
the
various heuristics
and
associated
points available from some
experts
that
can be
used
for
predicting
the
sanding potential,
and
suitability
of
potential methods
in
sand control, respectively.
Gravel Design Criteria
In
spite
of the
extensive
reported
work
in the
area
of
understanding
and
control
of
sand production, theoretical approaches
and
guidelines
for
predicting
the
sanding phenomena
and
techniques
for
sand control still
need
further
research
and
development.
As
demonstrated
by
Bouhroum
and
Civan (1995),
the
majority
of the
available gravel sizing criteria,
based
on the
gravel
to
sand grain size ratio
do not
actually agree with
each
other. Saucier
(1969)
and
others
developed
gravel sizing
criteria
based
on the
gravel
to
mean size
of the
formation sand
for
similar
percentile points
of
sieve analysis curves, solely
from
the
geometrical
point
of
view. Therefore, Bouhroum
and
Civan (1995) state:
A
major problem with gravel-pack design criteria
is the
significant
focus
given
by
researchers
to the
geometrical
retention
criteria
while
neglecting
the
other aspects
of the
filtration process, such
as
clog-
ging
and
hydrodynamics.
Table
20-3
by
Tiffin
et al.
(1998) outlines typical sand sorting ratios
that
can be
determined
by
sieve analyses.
In
this table,
the
cumulative
%
sieve
size
distributions
are
denoted
by the
letter
"D".
For
example,
D50
indicates
the
sieve opening above which
50% of the
sand particles
are
retained.
Tiffin
et al.
(1998) report that typical moderate size, well
sorted formation yields
a
D40/D90 value
of
2.8,
while
a
more poorly
sorted sample yields
a
value
of 10 for the
D40/D90
ratio. Formations
having
different
sizing
may
have
the
same sorting ratio. However, this
does
not
matter
because
the
focus
of
interest
here
is the
ability
of the
formation
sand particles
to
form
bridges
and
plug screens
or
gravel pack
(text
continued
on
page 654)
652
Reservoir
Formation
Damage
Table 20-1
Evaluation
Criteria
for
Formation
Assessment
FACTOR
_||
CONDITIONS
&
VALUES
Porosity
(<f>)
Clay
Content
Original
Pressure
Gradient
Current
Pressure
Gradient
Formation
Age
Formation
Depth
Water
Solubility
Water
Breakthrough
Injector
Well
Formation
Condition
API
Gravity
Drawdown
Special
Formation
Conditions
>30%
<30%
>15%
<15%
> 0.6
pn/ft
<O.G
pn/ft
> 0.3
pn/ft
< 0.3
pn/ft
Young
Old
Age
NotKnown
TVD
<15,000/t-
TVD
>
15,000/t
>
15,000
ft
8,
000
-15,
000
ft
<8,000/£
TRUE
FALSE
Water
Oil/Gas
TRUE
FALSE
TRUE
FALSE
Condition
NotKnown
Old
Young
Age
NotKnown
Friable
^>30%
^><30%
^>30%
^<30%
TVD
<15,000/t
TVD
>
15,000/t
^>30%
0<30%
4^>30%
^<30%
Well
Consolidated
Poorly
Consolidated
Water/Gas
Oil
Gas
Oil/Water
<15°
15°-25°
>25°
<750
jwi
>750
jw*
<400p«t
>400pst
(Well
Consolidated)
AND
(Not Water
Soluble)
Otherwise
Pit
+5
+0
+5
+0
4-10
+0
+0
+5
+5
+0
+5
+0
+5
+0
+5
+10
+0
+0
+5
+0
+15
+0
+6
+0
+10
+0
+10
+0
+6
+0
+5
+0
+15
+0
+0
+5
+10
+0
+15
+0
+15
-100
+0
After
Kanj,
M.,
Zaman,
M.,
&
Roegiers,
J-C.,
©1996; reprinted
by
permission
of
Computational
Mechanics
Inc.
Reservoir Sand Migration
and
Gravel-Pack Damage
653
O
2
•4^
O
U
-«
c
OS
1
< <
05
05
05
<
05
05
Q
»
•
*
-S
< BO
<0
•<
<
nao
o<o
QQ03
a
upa
Q85Q
Q<
Q
O«QB3<
3
a
a
ion
u^
Q<Q
«*&
e!
zz
Q<
W
Q<
OPQQ
zz
654
Reservoir
Formation
Damage
Table
20-3
Criteria
for
Formation Sand Sorting
Sorting
or
Comparison
D50
D40/D90
D10/D95
sub
325
mesh
Proposed
Purpose
Standard Saucier Criteria
Screen Damage Ratio
from
Pall
Size range between common
min
and max
particle sizes
Quantity
of sub 44
micron
particles
After
Tiffin
et
al.,
©1998
SPE;
reprinted
by
permission
of the
Society
of
Petroleum
Engineers.
(text
continued from page
651)
(Tiffin
et
al.,
1998). Based
on
their investigations,
Tiffin
et al.
(1998)
proposed
the
following sorting
criteria
and
completion
methods:
1.
(D10/D95<10,
D40/D90<3,
sub 325
mesh<2%)
the
lowest sorting
values with
low
fines content
may be
bare
screen
completion
candidates.
(Need
>1
Darcy formation permeability
for
cased
and
perforated completion, with possible
use of
prepacked screens).
2.
(D10/D95<10,
D40/D90<5,
sub 325
mesh<5%)
low to
medium
sorting ranges,
or
with
fines
just
out of
range
may
best
be
served
by
bare
screen
completions
with
new
technology, woven mesh
screens. (Need
>1
Darcy formation permeability
for
cased
and
perforated completion).
3.
(D10/D95<20,
D40/D90<5,
sub 325
mesh<5%)
medium ratio ranges
may
be
served
by
larger gravel
(7x or 8x
50%), placed
in
high
rate water pack, particularly
if the
formation sand size
is
consis-
tent over
the
zone
(no
laminations
and
minimum streaks).
4.
(D10/D95<20, D40/D90<5,
sub 325
mesh<10%)
medium ratio
ranges with
too
many fines
may use a
combination
of
larger
gravel
and a
fines-passing screen.
5.
(D10/D95<20,
D40/D90<5,
sub 325
mesh<10%)
the
highest
ratios, particularly those coupled with large amounts
of
fines
signal
a
critical need
for
enlarging
the
wellbore (move
the
gravel/
formation
sand interface away
from
the
wellbore), through
frac-
turing,
horizontal
or
multi-lateral well technology
underreaming,
or
large volume prepacking
to
minimize severe permeability
damage
at the
gravel/sand interface
due to flow.
Figure 20-1
by
Skjserstein
and
Tronvoll
(1997)
indicate
the
in-situ
stress conditions around
a
perforation cavity
and
replication
of
these
Reservoir Sand Migration
and
Gravel-Pack Damage
655
Downhole
Laboratory
z, ext
Figure
20-1.
Representation
of
downhole perforation conditions
in the
labora-
tory
(after
Skjaerstein
and
Tronvoll, ©1997
SPE;
reprinted
by
permission
of
the
Society
of
Petroleum Engineers).
conditions
in a
laboratory test sample. Figure
20-2
by
Burton (1998)
describes
the
typical flow pattern involving
a
perforated,
cased-hole
gravel-packed completion
and
delineates
the
location
of
various types
of
skin
effect.
As can be
seen, completion pressure losses involve
low-
and
high-velocity
flow
regions that
can be
classified
as
Darcy
and
non-Darcy
flow
regions, respectively.
Prediction
of
Sanding Conditions
Hayatdavoudi
(1999) developed
a
simplified model
by
modifying
the
Spangler
and
Handy (1982) model.
The
induced shear-stress,
T
(
,
in the
direction
of flow or its
equivalent
pressure drop
and the
induced acceleration,
a
t
,
of the
formation particles
can
be
related
by
Newton's second
law as
(Spangler
and
Handy, 1982):
T,
=
ma
;
(20-1)
where
m is the
mass
of the
sand particle.
On the
other hand,
the
maxi-
mum,
critical,
or
threshold shear resistance
of the
sand, including
the
additional factors resulting
from
water invasion,
is
expressed
as
following
by
Hayatdavoudi (1999):
[p.
+
fL
+
p.
(20-2)
656
Reservoir
Formation Damage
Reservoir
Skin
Reservoir-Flow Convergence Skin
U
Well-Entry Skin
Multiphase-Flow Skin
Intrawell-Flow
Skin
Figure
20-2.
Flow field around
a
perforated,
cased-hole
gravel-packed
completion (after
Burton,
©1998
SPE;
reprinted
by
permission
of the
Society
of
Petroleum Engineers).
where
a
c
is the
effective
cohesive
strength
of the
formation sand
(lb/
ft
2
)
and
a
v
is the
effective
vertical
stress
(lb/ft
2
).
P
,P
S
,P
OS
,
and
P
c
denote, respectively,
the
pore
fluid,
clay swelling, osmotic,
and
capillary
pressures.
Q
cyc
denotes
the
cyclic angle
of
internal
friction.
Therefore,
sand liquefaction
occurs
when
the
prevailing shear stress exceeds
the
threshold shear stress, that
is,
>
T.
(20-3)
Neglecting
the fluid
acceleration
effect,
Hayatdavoudi
(1999)
expressed
the
induced acceleration
of
particles
by
pv
(20-4)