Báo cáo vật lý: "Electrochemical Studies of Mild Steel Corrosion Inhibition in Aqueous Solution by Uncaria gambir Extract" doc
Bạn đang xem bản rút gọn của tài liệu. Xem và tải ngay bản đầy đủ của tài liệu tại đây (2.08 MB, 13 trang )
Journal of Physical Science, Vol. 21(1), 1–13, 2010 1
Electrochemical Studies of Mild Steel Corrosion Inhibition in
Aqueous Solution by Uncaria gambir Extract
Mohd. Hazwan Hussin* and Mohd. Jain Kassim
Material and Corrosion Chemistry Laboratory, School of Chemical Sciences,
Universiti Sains Malaysia, 11800 USM Pulau Pinang, Malaysia
*Corresponding author:
Abstract: The inhibition of the corrosion of mild steel in aqueous solutions by ethyl
acetate extract of Uncaria gambir containing catechin has been studied using weight
loss, potentiodynamic polarisation measurements, electrochemical impedance
spectroscopy (EIS) and scanning electron microscope technology with energy dispersive
X-ray spectroscopy (SEM-EDX). Inhibition was found to be highest at a concentration of
150 ppm in solutions with a pH of 5. The results obtained show that the ethyl acetate
extract of U. gambir acts as a mixed-type inhibitor and could serve as an effective
corrosion inhibitor of mild steel in aqueous solution.
Keywords: Uncaria gambir, catechin, corrosion inhibitor, weight loss, potentiodynamic
polarisation measurement
Abstrak: Pemerencatan kakisan besi lembut dalam larutan akueus oleh ekstrak etil
asetat Uncaria gambir yang mengandungi katekin dalam larutan akueus telah dikaji
dengan menggunakan kaedah kehilangan berat, pengukuran potensidinamik kekutuban,
spektroskopi elektrokimia impedans (EIS) dan mikroskop elektron imbasan dengan
spektroskopi sinar-X sebaran tenaga (SEM-EDX). Pemerencatan tertinggi dikesan pada
kepekatan 150 ppm dalam larutan pH 5. Keputusan yang diperolehi menunjukkan
bahawa ekstrak etil asetat U. gambir bertindak sebagai perencat jenis campuran dan
boleh bertindak sebagai perencat kakisan besi lembut yang efektif dalam larutan akueus.
Kata kunci: Uncaria gambir, katekin, perencat kakisan, kehilangan berat, pengukuran
potensiodinamik kekutuban
1. INTRODUCTION
Uncaria gambir, a native Southeast Asian herbal plant, can mostly be
found in countries such as Indonesia and Malaysia.
1
It had been widely used as an
astringent medicine for the treatment of spongy gums, tooth acne, diarrhea and
sore throat.
2
Besides being chewed, it is also imported in large quantities by the
West for tanning, calico printing and dyeing purposes.
3
Previous studies showed
that gambir consists mostly of the flavan monomer, which contains (+)-catechin,
(+)-epicatechin and alkaloids.
4
Catechins are flavonoids (C
6
-C
3
-C
6
) that are
Electrochemical Studies of Mild Steel Corrosion Inhibition 2
m
ostly found in fruits and plants such as tea leaves, wine and potatoes.
5
Interestingly, catechin exhibits an anti-oxidative activity that stops oxidation and
corrosion, the deterioration process and discoloration.
6
Corrosion affects most of the industrial sector and may cost billions of
dollars each year for prevention and replacement maintenance.
7
Thus, the modern
world has made investigations to overcome this problem by conducting
enrichment studies of corrosion inhibitors. Corrosion inhibitors will reduce the
rate of either anodic oxidation or cathodic reduction or both. This will give us
anodic, cathodic or a mixed type of inhibition. Most of the potential corrosion
inhibitors posses an active functional group, such as a nitro (-NO
2
) or a hydroxyl
(-OH)
8,9
group.
In an attempt to find corrosion inhibitors that are environmentally safe
and readily available, there has been a growing trend in the use of natural
products such as leaves or plant extracts as corrosion inhibitors for metals in acid
cleaning processes. This study was done to evaluate the inhibitive effect of ethyl
acetate extract of U. gambir as a green corrosion inhibitor of mild steel in
aqueous solution. The assessment of the corrosion behaviour was studied using
weight loss and potentiodynamic polarisation measurements, and the morphology
of inhibited mild steel surface was analysed by scanning electron microscope
technology with energy dispersive X-ray spectroscopy (SEM-EDX).
2. EXPERIMENTAL
2.1 Sample Preparation
Gambir samples were obtained from Medan Province, Indonesia. The
gambir cubes were grinded into fine powder and sieved with a 50-µm mesh.
Initially, 5 g of powdered gambir were dissolved in 80°C distilled water
(100 ml). Next, the aqueous extract was shaken at 200 rpm (IKA KS 260, IKA
Instruments, Sweden) continuously for 1 hour. The impurities were discarded by
vacuum filtration (70 mm), and the mother liquors were partitioned with
n-hexane (50 ml 3, QRëC) for purification purposes. The purified aqueous
extract was freeze-dried (Labconco Cooperation, Missouri, USA) for 2 days. As a
second partition, the resulting aqueous extract powder (1.0 g) was dissolved in
ethyl acetate (50 ml, QRëC). The ethyl acetate extract was concentrated at 45°C
under reduced pressure in a rotary evaporator (Heidolph Instruments GmbH@Co.
KG, Schwabach, Germany). Then, the concentrated extracts were dried in the
oven (50°C) and, finally, the dried extract was grinded into powder.
Journal of Physical Science, Vol. 21(1), 1–13, 2010 3
2.2 Electrode
s
Weight loss measurements were performed using specimens with a
composition (in wt%) of Fe: 0.97, C: 0.14, O: 0.15, and 3 cm 4 cm 1 mm in
dimension. The specimens were first polished to a mirror finish using 400 and
800 grit emery paper, immersed in methanol and finally washed with double
distilled water and dried before being weighed and immersed into the test
solution. Polarisation measurements were performed using 6 cm 4 cm 1 mm
specimens of equal composition. The working electrode (WE) is made of mild
steel with an exposing geometrical surface area of 0.785 cm
2
to the electrolyte,
platinum gauze as the auxiliary electrode (CE), and saturated calomel electrode
(SCE) as the reference electrode (RE). Prior to each measurement, the electrode
surface was pretreated in the same manner as the weight loss experiments. All
experiments were carried out using aerated unstirred solutions at 298 K.
2.3 Weight Loss Measurement
2.3.1 Effect of concentrations
Specimens in duplicate were immersed for a period of 7 days in 100 ml,
pH 5 aqueous solutions containing various concentrations of the studied
inhibitors. The mass of the specimens before and after immersion was determined
using an analytical balance of 0.001 mg accuracy. Averages of the duplicate
values were used. Inhibition efficiencies (gWL) were calculated from the
relation:
0
ww
gWL (%) = × 100
w
(1)
where w and w
0
are the uninhibited and inhibited corrosion rates, respectively.
2.3.2 Effect of pH
The same procedures were repeated as above in which the specimens
were immersed in 100 ml of various pH (1, 3, 5, 7 and 9) solutions of the
inhibitors.
2.4 Potentiodynamic Polarisation Measurement
Polarisation measurements were conducted in a conventional 3 electrode
Pyrex cell with an overall volume of 300 cm
3
. A platinum gauze and SCE were
used as the CE and the RE, respectively. Measurements were carried out using a
PC controlled Volta Lab PGP 201 system with Voltamaster 4 software
Electrochemical Studies of Mild Steel Corrosion Inhibition 4
(Radio
meter Analytical SAS, Villeubanne Cedex, France). The potentials were
scanned at a scan rate of 1 mVs
–1
from the corrosion potential (E
corr
) in the
cathodic direction and, subsequently, in the anodic direction. The electrode was
held in the test environment for 30 min prior to each experiment, which provided
sufficient time for E
corr
to attain a reliable stable value. Inhibition efficiencies,
(nPol), were calculated using the relation:
0
ii
nPol (%) = × 100
i
(2)
where i and i
0
are the uninhibited and inhibited corrosion current densities,
respectively.
2.5 Electrochemical Impedance Spectroscopy (EIS)
The electrochemical impedance spectroscopy, EIS, was carried out with
the open circuit potential, E
ocp
, for every sample; all of the samples were
immersed for 60 min over a frequency range of 100 kHz–1 Hz with a signal
amplitude perturbation of 5 mV and a scan rate of 1 mVs
–1
. Next, it was fitted
with sets of circuits that give the best value. The inhibition efficiency, IE, was
calculated by the following equation:
IE (%) = {1– (R
ct
/R'
ct
)} (3)
where R
ct
and R'
ct
refer to charge transfer resistance without and with the addition
of an inhibitor (ethyl acetate extract of gambir), respectively. The Nyquist plot
was calculated using Echem Analyst software (Gamry Instrument, Warminister,
PA, USA).
2.6 Scanning Electron Microscope
– Energy Dispersive X-Ray
Spectroscopy (SEM-EDX)
The surface morphology of the mild steel specimen was evaluated by
SEM-EDX analysis with Leo Supra 50 VP (Carl-Ziess SMT, Oberkashen,
Germany) and Oxford INCA400 (Oxford Instrument Analytical, Bucks, UK).
The specimen that shows high inhibition was examined with specimens without
inhibitors and fresh steel.
Journal of Physical Science, Vol. 21(1), 1–13, 2010 5
3. RESULTS AND DISCUSSION
3.1 Weight Loss Measurement
Using the experimental weight loss data, the percentage of gWL, was
calculated in the classical way. The value of gWL for all investigated
concentrations and pHs of ethyl acetate gambir extract are summarised in Tables
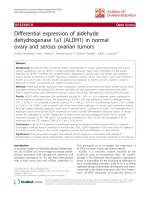
1 and 2, respectively. Based on the results, it is shown that the inhibitor is
concentration-independent as the concentration starts to decrease at 200 ppm
(Fig. 1). Thus, this means that the highest inhibition is at 150 ppm in pH 5 (Fig.
2). Interestingly, the colour changes of our electrolyte were observed and showed
a yellowish colour of ferrous or ferric hydroxide at the concentration of 0 ppm
and 10 ppm. The colour changes of dark blue magnetite were observed for the
rest of the concentrations. This means that the protective film of a stable oxide of
magnetite was formed on the mild steel. Magnetite will strongly adhere to the
metal and consequently results in an impermeable layer being formed to stop
further corrosion.
10,11
Table 1: Inhibition efficiencies for various concentration of ethyl acetate
extract of U. gambir for the corrosion of mild steel in pH 5 aqueous
solution.
Conc.
(ppm)
Weight before
(g)
Weight after
(g)
Weight loss
(g)
gWL
(%)
0 4.3201 4.2927 0.0274 –
10 4.4103 4.3914 0.0189 31.02
50 4.5139 4.4982 0.0157 42.70
100 4.3132 4.3012 0.0120 56.20
150 4.4394 4.4306 0.0088 67.88
200 4.4305 4.4210 0.0095 65.32
Table 2: Inhibition efficiencies for various pH of 150 ppm ethyl acetate
extract of U. gambir for the corrosion of mild steel in aqueous solution.
pH Weight before
(g)
Weight after
(g)
Weight loss
(g)
gWL
(%)
1 B: 4.5993 4.5251 0.0742 –
S: 4.5078 4.4428 0.0650 12.39
3 B: 4.8150 4.7842 0.0308 –
S: 4.7849 4.7677 0.0172 44.16
5 B: 4.3201 4.2927 0.0274 –
S: 4.4394 4.4306 0.0088 67.88
7 B: 4.6183 4.5955 0.0228 –
S: 4.5058 4.4935 0.0150 34.21
9 B: 4.6034 4.5808 0.0226 –
S: 4.5196 4.5001 0.0195 13.71
Note: B: blank, S: 150 ppm extract
Electrochemical Studies of Mild Steel Corrosion Inhibition 6
Figure 1: The relation between percentage of inhibition with concentration of ethyl
acetate extract of U. gambir.
Conc. (ppm)
Inhibition efficiency (%)
Inhibition efficiency vs Concentration
pH
Inhibition efficiency (%)
Inhibition efficiency vs pH
Figure 2: The relation between percentage of inhibition with pH of ethyl acetate
extract of U. gambir.
3.2 Potentiodynamic Polarisation Measurement
The evaluation of nPol can also be performed through electrochemical
experiments, which consist of the determination of Tafel curves. Tafel plots of
mild steel in pH 5 aqueous solutions with and without inhibitors for various
concentrations were summarised in Figure 3 and Table 3, whereas the corrosion
potential and the various kinetic data for all pH range were summarised in Table
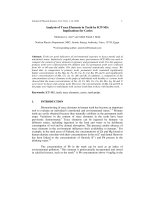
4. It should be noted that, with the addition of the compound, both the anodic and
cathodic current densities decrease, with the anodic domain being more
Journal of Physical Science, Vol. 21(1), 1–13, 2010 7
significant.
Although the marked positive shift (noble values) in the corrosion
potential, and the decrease in the anodic current density in the presence of the
inhibitor, suggests that these compounds act as an anodic-type inhibitor, there is
also a decrease in the cathodic current density, which indicates that these
compounds act as mixed-type inhibitors. In a nutshell, this test supports the fact
that the concentration of 150 ppm at pH 5 will give the best inhibition.
Figure 3: Polarisation curve for mild steel in pH 5 aqueous solutions with absence and
presence of various concentration of ethyl acetate extract of U. gambir.
Table 3: Corrosion parameters for mild steel in pH 5 aqueous solution with absence and
presence of various concentration of ethyl acetate extract of U. gambir.
Conc.
(ppm)
E (i = 0),
mV
I
corr
(µA/cm
2
)
Rp
(kΩ.cm
2
)
Ba
(mV)
–Bc
(mV)
Corr,
m/Y
IE (%),
I
corr
0 –502 3.2472 16.21 314.2 342.3 37.98 –
10 –439 0.8085 43.53 211.5 222.5 9.456 75.10
50 –302 0.4833 75.29 205.4 219.6 5.652 85.12
100 –188 0.4616 94.19 258.2 265.3 5.398 85.78
150 –159 0.2664 145.74 259.6 179.3 3.115 91.79
200 –181 0.4400 100.73 289.1 248.1 5.146 86.45
0
–
3
–
6
–9
–
800
–
600
–
400
–
200
0 200
Potential (mV)
Current density (log I)
200 ppm EA
Blank
150 ppm EA
10 ppm EA 50 ppm EA 100 ppm EA
Electrochemical Studies of Mild Steel Corrosion Inhibition 8
Table 4: Corrosion parameters for mild steel in aqueous solution with absence and
presence of various pH of 150 ppm ethyl acetate extracts of U. gambir.
pH E(i = 0) i
corr
(µA/cm
2
)
Rp
(kΩ.cm
2
)
Ba
(mV)
–Bc
(mV)
IE
(%)
1 –554 89.1 0.2657 89.5 198.1 –
–552 105.3 0.2971 101.7 235.0 –18.18
3 –673 26.1446 1.66 366.4 350.1 –
–631 24.2667 2.02 401.4 496.0 7.18
5 –502 3.2472 16.21 314.2 342.3 –
–159 0.2664 145.74 259.6 179.3 91.77
7 –245 0.2385 156.50 241.3 198.6 –
–238 0.1484 170.02 176.5 150.8 37.77
9 –315 0.6174 76.80 353.3 248.2 –
–340 1.4338 27.93 243.4 201.3 –56.94
3.3 Electrochemical Impedance Spectroscopy (EIS)
The EIS method is very useful in characterising electrode behaviour. The
electrode characterisation includes the determination of the polarisation
resistance (Rp), corrosion rate and the electrochemical mechanism. The
usefulness of these data permits the analysis of the alternating current (AC)
impedance data, which are based on modelling a corrosion process by an
electrical circuit. The EIS technique is based on the response of an equivalent
circuit for an electrode/solution interface. The response can be analysed by
transfer functions due to an applied small-amplitude potential excitation at
varying signals and sweep rates. In turn, a sine-wave perturbation of small
amplitude is employed on a corroding system being is modelled as an equivalent
circuit for determining the corrosion mechanism and polarisation resistance.
12
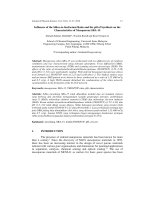
Table 5 lists the impedance parameters of the Nyquist plots of the ethyl acetate
extract of gambir in different concentrations. From this experiment, the Nyquist
plot shows that, at a concentration of 150 ppm, the percentages of inhibition
efficiency are highest when the charge transfer potential, R
ct
, is also in good
agreement (Fig. 4). In these spectra, the variation of impedance responses of mild
steel after the addition of the ethyl acetate extract of gambir to the pH 5 aqueous
solution is remarkable. The Randles CPE circuit was known as the equivalent
circuit in our study (Fig. 5).
Table 5: Impedance parameters and inhibition efficiency for mild steel in pH 5 aqueous
solution containing different concentrations of ethyl acetate extract of gambir.
Conc
.
(ppm)
R
ct
(Ω) 10
3
R
s
(Ω)
Yo 10
–6
N 10
–3
IE
(%)
0 1.471 24.39 908.9 746.8 0
10 1.628 26.41 669.3 829.9 9.6
50 1.582 73.43 375.7 805.9 7.01
100 1.755 14.71 641.6 836.7 16.18
150 2.494 13.40 289.6 909.7 41.02
200 2.135 3.231 245.7 991.4 31.1
Figure 4: Nyquist plot for mild steel in pH 5 aqueous solution in presence of ethyl acetate
extract of gambir.
Figure 5: The Randles CPE circuit which is the equivalent circuit for the
impedance spectra.
Z real (ohm)
-Z imag (ohm)
Electrochemical Studies of Mild Steel Corrosion Inhibition 10
3.4 Scanning Electron Microscope – Energy Dispersive X-Ray
Spectroscopy (SEM-EDX)
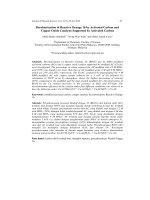
Figure 6 shows the SEM micrographs of different slides of mild steel
after immersion in the aqueous solution with the absence and presence of the
inhibitor. Here, the micrograph exhibited a cocoon-like structure for solution with
the absence of the inhibitor. This explains the fact that the surface was already
undergoing a localised attack, which resulted in a cocoon-like structure, whereas
there was an improvement in the surface morphology of mild steel that was
treated with the inhibitor. From the EDX evaluation, it is clear that the upraising
value of O is due to the formation of the ferrous hydroxide, whereas, for C, it is
due to the presence of catechin that acts as the active inhibitor and complexes
with the mild steel surface (Table 6 and Fig. 7).
(a)
(b)
Figure 6: SEM micrographs of mild steel in (a) fresh steel, (b) without inhibitor, 0 ppm
(c) with inhibitor, 150 ppm (continued on next page).
(c)
Figure 6: (continued).
Table 6: The composition of the sample regarding the EDX analysis.
Element (%)
Sample
Fe O C
Fresh mild steel 97.02 1.54 1.44
Mild steel without inhibitor 74.87 23.63 1.49
Mild steel with inhibitor 96.18 1.23 2.59
(a)
Figure 7: The EDX spectra of mild steel in (a) fresh steel, (b) without inhibitor, 0 ppm
(c) with inhibitor, 150 ppm (continued on next page).
Electrochemical Studies of Mild Steel Corrosion Inhibition 12
(b)
(c)
Figure 7: (continued).
4. CONCLUSION
The electrochemical studies proved that the ethyl acetate extract of
U. gambir displays inhibitor properties that work best at a concentration of 150
ppm and at a pH of 5. The polarisation measurement demonstrates that the extract
under investigation acts as a mixed-type inhibitor, and the electrochemical
impedance spectra shows inhibition when the sample was fitted with the Randles
Journal of Physical Science, Vol. 21(1), 1–13, 2010 13
CPE circuit. SEM-EDX analysis shows that there was some improvement in the
surface morphology of inhibited mild steel compared with uninhibited mild steel.
5. ACKNOWLEDGEMENT
The authors would like to thank Universiti Sains Malaysia for the
financial support given through the USM Short-Term Grant Scheme
(304/PKIMIA/635055) and the RU-USM-Postgraduate Research Grant Scheme
(1001/PKIMIA/831016).
6. REFERENCES
1. Hayani, E. (2003). Analisis kadar katekin dari gambir dengan berbagai metode.
Bul. Tek. Pertanian, 8(1), 31.
2. Perry, L. M. (1980). Medicinal plant of East and Southeast Asia. Cambridge:
MIT Press, 359.
3. Remington, J. P. & Wood, H. C. (1918). The dispensatory of the United States of
America. Retrieved 23 January 2009, from .
4. Taniguchi, S., Kuroda, K., Doi, K., Inada, K., Yoshikado, N., Yoneda et al.
(2007). Evaluation of gambir quality based on quantitative analysis of
polyphenolic constituents. Yakugaku Zasshi, 127(8), 1291–1300.
5. Ramos-Tejada, M. M., Duran, J. D. G., Ontiveros-Ortega, A., Espinosa-Jimenez,
M., Perea-Carpio, R. & Chibowski, E. (2002). Investigation of alumina/(+)-
catechin system properties. Part 1: A study of the system by FTIR-UV-Vis
spectroscopy. Colloids Sur. B, 24, 297–308.
6. Kyung, H. R. & Yinzhe, J. (2006). Recovery of catechin compounds from
Korean tea by solvent extraction. Bioresour. Technol., 97(5), 790–793.
7. Roberge, P. R. (2008). Corrosion engineering principles and practice. USA:
McGraw- Hill, 19.
8. Davis, J. R. (2000). Corrosion: Understanding the basic. USA: ASM
International, 402–405.
9. Schweitzer, P. A. (2007). Corrosion of linings and coatings: Cathodic and
inhibition protection and corrosion monitoring. UK: Taylor & Francis Group,
55–59.
10. Lahodny-Sarc, O. & Kapor, F. (2002). Corrosion inhibition of carbon steel in the
near neutral media by blends of tannin and calcium gluconate. Mater. Corros.,
53(4), 264–268.
11. Almeida, E., Pereira, D., Figueiredo, M. O., Lobo, V. M. M. & Morcillo, M.
(1997). The influence of the interfacial conditions on rust conversion by
phosphoric acid. Corros. Sci., 39(9), 1561–1570.
12. Perez, N. (2004). Electrochemistry and corrosion science. USA: Kluwer
Academic Publisher, 97.