Bài giảng môn học thí nghiệm cầu part 8 docx
Bạn đang xem bản rút gọn của tài liệu. Xem và tải ngay bản đầy đủ của tài liệu tại đây (698.09 KB, 17 trang )
Hồ sơ Kiểm định cầu Ô Môn, Km 20+600- QL91
29
Ei ho hi pi Lực ngang Tay đòn M
E1 1.5 0.73 3.01 0.50 1.51
Eh1 0.09P 0.04P 0.33P 0.75 0.25P
1. H30 đặt trên lăng thể phá hoại
=
35
0
= 0.61
tc (T/m3)=
1.80
n
h
= 1.12
n
đ
= 1.20
H= 1.50
(450-/2) đổi ra radian
0.48
tg(450-/2)=
0.52
Chiều dài lăng thể trợt lo=Htg(45
0
-
/2)
0.78
Khoảng cáchgiữa mép ngoài của hai bánh xe S=
5.50
Chiều rộng của diện phân bố tải trọng giả thiết H=10cm, b=
0.40
Ta thấy: 2b+d=2b+1.6-b=0.4+1.6=2 > lo ta có:
Chiều cao quy đổi
h
0
=nh*P/(n
đ
Sb')=nh*2*2*0.4P/(nđ*1.8*5.5*2)
0.08P
tg =
0.52
=
0.48
Hệ số áp lực =tg
2
() =
0.27
Cờng độ áp lực do đất nền đờng đắp: p
i
=n
đ
x
tc
x x h
i
Eh=n
đ
xxh
0
xhxxS
Ei ho hi pi Lực ngang Tay đòn M
E1 1.5 0.73 3.01 0.50 1.51
Eh1 0.08P 0.04P 0.33P 0.75 0.25P
Tổ hợp tải trọng
Tổ
hợp
Ký
hiệu
Công thức xác định n Lực Ngang Lực Đứng Tay
đòn
Mô men
1 Tại trọng tại vị trí ngàm
Tĩnh tải bản thân (G1-G4) 1.1 49.90 -0.01 -0.72
Tĩnh tải do kết cấu nhịp >1 109.98 0.75 11.00
áp lực ngang của đất
1.2 3.01 3.55 10.69
H30 trên lăn
g
thể
p
há hoại;
=35
0
;nh=1.4;nt=1.2
1.2 0.33P 0.76 0.25P
2H30 và ngời trên nhịp 1.4 7.42P 0.74P+ 0.784
Bai giang Thi nghiờm cõu - Page 120 of 168
Hồ sơ Kiểm định cầu Ô Môn, Km 20+600- QL91
30
Tổng cộng:
0.33P+ 3.01 7.42P+
159.88
0.74P+ 21.75
2 Tại trọng tâm vị trí ngàm cọc
Tĩnh tải bản thân (G1-G4) 1.1
49.90
-0.01 -0.72
Tĩnh tải do kết cấu nhịp >1
109.98
0.00 11.00
áp lực ngang của đất
1.2 3.01
3.55 10.69
H30 trên lăn
g
thể
p
há hoại;
=35
0
;nh=1.12;nt=1.2
1.12 0.33P
0.76 1.99P
2H30 và ngời trên nhịp 1.12 5.94P
8.75
0.75 0.59P+ 0.63
Lực hãm 0.34P
5.40 1.84P
Tổng cộng: 0.67P+ 3.01 5.94P+
168.63
2.43P+ 21.60
Chiều sâu ngàm: 2.7
Khả năng chịu lực của một cọc [N]= 40.00 T
Số lợng cọc 14
Trọng lợng cọc 35*35 ở độ sâu ngàm 11.58 T
Khoảng cách giữa hai hàng cọc 1.00
Tổ hợp 1
Lực tác dụng lớn nhất lên 1 do lực đứng 0.53P+12.25
Lực tác dụng lớn nhất lên 1 domô men: 0.11P+3.11
0.64P+15.36
Nmax<[N] > P= 38.50 T
Vậy với tổ hợp 1 Mố 1 đủ khả năng chịu lực lớn hơn kết cấu nhịp
Tổ hợp 2
Lực tác dụng lớn nhất lên 1 cọc do lực đứng: 0.42P+12.045
Lực tác dụng lớn nhất lên 1 cọc do Mô men: 0.35P+3.086
0.77P+15.131
Nmax<[N] > P= 32.30 T
Vậy với tổ hợp 2 Mố 1 có thể chịu đợc đoàn xe theo sơ đồ H30 là 31Tấn
Vậy mố có khả năng chịu tải lớn hơn kết cấu nhịp
Bai giang Thi nghiờm cõu - Page 121 of 168
Hồ sơ Kiểm định cầu Ô Môn, Km 20+600- QL91
31
4. Kết luận v kiến nghị
Liên kết ngang giữa các dầm cha thật đảm bảo tốt. Sơ đồ làm việc của kết cấu
nhịp hiện tại không đúng với thiết kế ban đầu. Các liên kết ngang yếu, đặc biệt là đối
với nhịp 18.6m .
Các trụ có thể coi nh đang trong tình trạng bình thờng, không ảnh hởng đáng
kể đến khả năng chịu lực và tuổi thọ của cầu,
Tải trọng cho phép: Xe ô tô 22 tấn.
Kiến nghị
Cần có kế hoạch sửa chữa, gia cố hệ thống liên kết ngang.
Sửa chữa, gia cố khe co giãn, phần tiếp giáp giữa cầu và đờng, để khắc
phục tình trạng h hỏng và ngăn chặn tai nạn đáng tiếc có thể xẩy ra.
Trong thời gian cha thực hiện đợc việc sửa chữa, phải thờng xuyên theo
dõi khả năng đứt rời hẳn các mối nối ngang, hiện tợng nứt dọc tại cổ dầm,
để có biện pháp xử lý kịp thời.
Khống chế tải trọng xe qua cầu không vợt quá 22 tấn.
TT Ký hiệu Công thức xác định
Lực
(T)
Cánh tay
đòn (m)
Mô men
(T.m)
I
Tĩnh tải bản thân mố - Cánh tay
đòn lấy với trọng tâm bệ móng
Tiết diện I-I (qua đáy bệ
cọc)
G1 (1.5*(2+10))*2.5 45 0.00 0.00
G2 2*2*1.2*.03*2.5 0.36 -1.80 -0.65
Tổng cộng theo tiết diện I-I 45.36 -0.65
n=
1.
1 49.90 -0.72
n=
0.
9 40.82 -0.59
Vị trí hợp lực đối với trọng
tâm bệ móng -0.0143
V Tĩnh tải nhịp
Tĩnh tải I ,II 122.60 0.10 12.26
Cộng 122.60 12.26
n >1 122.60 12.26
Bai giang Thi nghiờm cõu - Page 122 of 168
Hồ sơ Kiểm định cầu Ô Môn, Km 20+600- QL91
32
VI
Phản Lực gối do hoạt tải H30
gây ra (tính theo phơng dọc
cầu)
Tải trọng ô tô: 2.21P
Hệ số phân phối ngang 2.00
Hệ số làn xe 1.00
Hệ số xung kích (1+)
1.20
Phản lực do 2 đoàn H30
(T) 5.30P 0.10 0.53P
VII
Phản Lực gối do hoạt tải ngời
gây ra (tính theo phơng dọc
cầu)
Tải trọng ngời trên 1m2 lề
đờng 0.30
Hệ số phân phối ngang của
ngời 2.00
Diện tích Đah 9.30
Phản lực do ngời (T) 5.58 0.10 0.56
Cộng phản lực do H30 và
ngời (T) 5.30P+ 5.58 0.53P+ 0.56
n=
1.
4 7.42P+ 7.81 0.74P+ 0.78
n=
1.
1 5.94P+ 8.75 0.59P+ 0.63
IX Lực hm
Lực hãm =0.3P 1 0.30P
n=
1.
1 0.34P
Đối với tiết diện đáy bệ cọc
1.
1 0.34P
áp lực đẩy ngang khi có hoạt tải trên lăng thể trợt
1. H30 đặt trên lăng thể phá hoại
=
35
0
= 0.61
tc (T/m3)=
1.80
n
h
= 1.40
n
đ
= 1.20
H= 1.50
(45
0
-/2) đổi ra
radian 0.48
tg(45
0
-/2)=
0.52
Chiều dài lăng thể trợt lo=Htg(45
0
-/2)
0.78
Bai giang Thi nghiờm cõu - Page 123 of 168
Hồ sơ Kiểm định cầu Ô Môn, Km 20+600- QL91
33
Khoảng cáchgiữa mép ngoài của hai bánh xe S=
5.50
Chiều rộng của diện phân bố tải trọng giả thiết H=10cm, b=
0.40
Ta thấy: 2b+d=2b+1.6-b=0.4+1.6=2 > lo ta có:
Chiều cao quy đổi h
0
=nh*P/(n
đ
Sb')=nh*2*2*0.4P/(nđ*1.8*5.5*2)
0.09P
tg =
0.52
=
0.48
Hệ số áp lực =tg
2
() =
0.27
Cờng độ áp lực do đất nền đờng đắp: p
i
=n
đ
x
tc
x x h
i
Eh=n
đ
xxh
0
xhxxS
Ei ho hi pi Lực ngang Tay đòn M
E1 1.5 0.73 3.01 0.50 1.51
Eh1 0.09P 0.04P 0.33P 0.75 0.25P
1. H30 đặt trên lăng thể phá hoại
=
35
0
= 0.61
tc (T/m3)=
1.80
n
h
= 1.12
n
đ
= 1.20
H= 1.50
(450-/2) đổi ra
radian 0.48
tg(450-/2)=
0.52
Chiều dài lăng thể trợt lo=Htg(45
0
-/2)
0.78
Khoảng cáchgiữa mép ngoài của hai bánh xe S=
5.50
Chiều rộng của diện phân bố tải trọng giả thiết H=10cm, b=
0.40
Ta thấy: 2b+d=2b+1.6-b=0.4+1.6=2 > lo ta có:
Chiều cao quy đổi h
0
=nh*P/(n
đ
Sb')=nh*2*2*0.4P/(nđ*1.8*5.5*2)
0.08P
tg =
0.52
=
0.48
Hệ số áp lực =tg
2
() =
0.27
Cờng độ áp lực do đất nền đờng đắp: p
i
=n
đ
x
tc
x x h
i
Eh=n
đ
xxh
0
xhxxS
Ei ho hi pi Lực ngang Tay đòn M
E1 1.5 0.73 3.01 0.50 1.51
Bai giang Thi nghiờm cõu - Page 124 of 168
Hồ sơ Kiểm định cầu Ô Môn, Km 20+600- QL91
34
Eh1 0.08P 0.04P 0.33P 0.75 0.25P
Tổ
hợp
Ký
hiệu
Công thức xác định n Lực Ngang Lực Đứng Tay đòn Mô men
1
Tại
trọng
tại vị
trí
ngàm
Tĩnh tải bản thân (G1-
G4) 1.1 49.90 -0.01 -0.72
Tĩnh tải do kết cấu
nhịp >1 122.60 0.75 12.26
áp lực ngang của đất 1.2 3.01 3.55 10.69
H30 trên lăng thể phá
hoại;
=35
0
;nh=1.4;nt=1.2
1.2 0.33P 0.76 0.25P
2H30 và ngời trên
nhịp 1.4 7.42P 0.74P+ 0.784
Tổng cộng: 0.33P+ 3.01 7.42P+ 172.50 0.74P+ 23.01
2
Tại
trọng
tâm vị
trí
ngàm
cọc
Tĩnh tải bản thân (G1-
G4) 1.1 49.90 -0.01 -0.72
Tĩnh tải do kết cấu
nhịp >1 122.60 0.00 12.26
áp lực ngang của đất 1.2 3.01 3.55 10.69
H30 trên lăng thể phá
hoại;
=35
0
;nh=1.12;nt=1.
2 1.12 0.33P 0.76 1.99P
2H30 và ngời trên
nhịp 1.12 5.94P 8.75 0.75 0.59P+ 0.63
Lực hãm 0.34P 5.40 1.84P
Tổng cộng: 0.67P+ 3.01 5.94P+ 181.25 2.43P+ 22.86
Chiều sâu ngàm: 2.2
Khả năng chịu lực của một cọc [N]= 70.00T
Số lợng cọc 5
Trọng lợng cọc 35*35 ở độ sâu ngàm 3.37T
Bai giang Thi nghiờm cõu - Page 125 of 168
Hồ sơ Kiểm định cầu Ô Môn, Km 20+600- QL91
35
Tổ hợp 1
Lực tác dụng lớn nhất lên 1 do lực đứng 1.48P+35.17
Nmax<[N] > P= 23.53T
Vậy với tổ hợp 1 Mố 1 đủ khả năng chịu lực lớn hơn kết cấu nhịp
Tổ hợp 2
Lực tác dụng lớn nhất lên 1 cọc do lực đứng: 1.19P+36.25
Nmax<[N] > P= 28.36T
Vậy với tổ hợp 2 Mố 1 có thể chịu đợc đoàn xe theo sơ đồ H30 là 28,36 Tấn
Vậy mố có khả năng chịu tải lớn hơn kết cấu nhịp
Bai giang Thi nghiờm cõu - Page 126 of 168
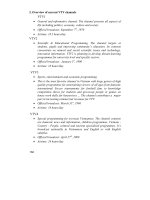
Load Test and Rating Report
Steel Truss Bridge, Bonham 1.603
Butler County, Ohio
SUBMITTED TO:
Butler County Engineer’s Office
1921 Fairgrove Avenue (S.R. 4)
Hamilton, Ohio 45011
BY:
BRIDGE DIAGNOSTICS, Inc.
5398 Manhattan Circle, Suite 100
Boulder, Colorado 80303-4239
(303) 494-3230
March, 1999
Bài giảng Thí nghiệm cầu - Page 127 of 168
Table of Contents
Introduction 1
Description of Structure 1
Instrumentation Procedures 1
Load Test Procedures 2
Preliminary Investigation of Test Results 3
Modeling, Analysis, and Data Correlation 7
Load Rating Procedures and Results 10
Conclusions and Recommendations 13
Measured and Computed Strain Comparisons 14
Appendix A - Field Testing Procedures 26
Attaching Strain Transducers 27
Assembly of System 28
Performing Load Test 28
Appendix B - Modeling and Analysis: The Integrated Approach 31
Introduction 31
Initial Data Evaluation 31
Finite Element Modeling and Analysis 32
Model Correlation and Parameter Modifications 33
Appendix C - Load Rating Procedures 36
Appendix D - References 39
Bài giảng Thí nghiệm cầu - Page 128 of 168
List of Figures
Figure 1 Bonham 1.603 Instrumentation Plan 2
Figure 2 Load Configuration of Test Truck 3
Figure 3 Stringer 4 @ West Bay - Abutment beam-end not in contact 5
Figure 4 Reproducibility of test procedure and data acquisition 5
Figure 5 Asymmetric Stresses on North and South Truss 6
Figure 6 Strain Histories from Slow and Fast Truck Crossings. 7
Figure 7 Computer generated display of bridge model 9
Figure 8 Measured and Computed Stresses - North Truss L0-L2 14
Figure 9 Measured and Computed Stresses - North Truss L2-L4 15
Figure 10 Measured and Computed Stresses - North Truss L4-L4'. 15
Figure 11 Measured and Computed Stresses - North Truss L0-U1. 16
Figure 12 Measured and Computed Stresses - North Truss U1-U3 16
Figure 13 Measured and Computed Stresses - North Truss U3-U5 17
Figure 14 Measured and Computed Stresses - North Truss U1-L2. 17
Figure 15 Measured and Computed Stresses - North Truss L2-U3. 18
Figure 16 Measured and Computed Stresses - South Truss L0-L2. 18
Figure 17 Measured and Computed Stresses - South Truss L0-U1 19
Figure 18 Measured and Computed Stresses - South Truss U1-U3. 19
Figure 19 Measured and Computed Stresses - South Truss U1-L2 20
Figure 20 Measured and Computed Stresses - Stringer 2 Midspan Bay 1. 20
Figure 21 Measured and Computed Stresses - Stringer 3 Midspan Bay 1. 21
Figure 22 Measured and Computed Stresses - Stringer 4 Midspan Bay 1. 21
Figure 23 Measured and Computed Stresses - Stringer 5 Midspan Bay 1. 22
Figure 24 Measured and Computed Stresses - Stringer 6 Midspan Bay 1. 22
Figure 25 Measured and Computed Stresses - Stringer 7 Midspan Bay 1. 23
Figure 26 Measured and Computed Stresses - Stringer 8 Midspan Bay 1. 23
Figure 27 Measured and Computed Stresses - Stringer 9 Midspan Bay 1. 24
Figure 28 Measured and Computed Stresses - Stringer 7 Midspan Bay 2. 24
Figure 29 Measured and Computed Stresses - Floor Beam at Midspan 25
Figure 30 Measured and Computed Stresses - Floor Beam at Quarter Span 25
Figure 31 Typical Deck Layout for Load Position Monitoring 29
Figure 32 Illustration of Neutral Axis and Curvature Calculations 32
Figure 33 AASHTO rating and posting load configurations 38
List of Tables
Table 1 Maximum measured stresses on truss, stringers and floor beam. 7
Table 2 Initial and Final Values of Variable Parameters 9
Table 3 Accuracy of initial and refined models 9
Table 4 Inventory and Operating Component Capacities 11
Table 5 Inventory and Operating Load Rating Factors for H-20 (20 tons) 12
Table 6 Inventory and Operating Load Rating Factors for HS-20 (36 tons) 12
Table 7 Measured Lateral Distribution Factor for Stringers. 13
Table 8. Error Functions 34
Bài giảng Thí nghiệm cầu - Page 129 of 168
1
Introduction
The Bonham 1.603 steel truss bridge was selected for load testing by the Butler County
Engineers Office (BCEO) because it was representative of several structures currently
posted with restricted load limits. The structure was built in the 1950's and was based
on a standard pony truss design with an H-15 load requirement.
Description of Structure
Structure Identification
Bonham Road 1.603
Location
Bonham Rd. Butler County, Ohio
Structure Type
5 panel steel pony truss
Span Length(s)
69'-0"
Skew
Perpendicular
Roadway/Structure Widths
24'-0" / 25'-6"
Truss Connections
Welded connections with gusset plates.
Stringer Spacing
9 stringers @ 2'-8"
Deck type
10 Ga. corrugated steel deck filled with asphalt.
Stringers
W12x31 typical
Exterior Beams
Pony truss: 8'-0" deep
Abutments
Concrete abutment with steel plates providing truss
bearings. No pin or roller mechanisms.
Structural Steel
Fy = 33 ksi, E=29000 ksi ASTM A-7 Typical.
Comments
Truss in good to excellent condition. Significant rust and
corrosion on floor deck, stringers, and floor beams.
Instrumentation Procedures
The primary goal of the instrumentation plan was to measure the live-load
response behavior of the main truss members and to determine the load distribution
characteristics of the floor system. The superstructure of the bridge was instrumented
with 32 re-usable strain transducers as shown in Figure 1. Based on previous tests on
similar trusses, it was known that the truss connections would resist moment and must
be analyzed as semi-rigid frames as opposed to being pinned (free rotation). In general,
truss member gages were located as near to the cross-sectional centroid to determine
the axial force experienced by each member and minimize the effects of bending. Floor
beam and stringer gages were typically attached to the bottom flange to measure the
strain at the extreme tension fiber. Additional gages were attached to the top flange at
several stringer cross-sections to verify that the beams were non-composite with the
deck and to detect any unusual responses.
Based on the construction details of the superstructure and prior experience with
similar structures, it was desired to obtain the following stiffness parameters:
• Determine the axial resistance of truss support conditions.
• Floor system contribution to the bottom chord stiffness.
• Transverse load distribution provided by the corrugated steel deck.
Bài giảng Thí nghiệm cầu - Page 130 of 168
2
Evaluation of these parameters was necessary to accurately assess the load
effect on each component due to an applied load condition.
Figure 1 Bonham 1.603 Instrumentation Plan.
Load Test Procedures
A fully loaded, three-axle dump truck with a gross weight of 43.85 kips and wheel
weights and axle configurations shown in Figure 2 was used for the controlled load
tests. Two transverse truck paths (north and south lane lines) were defined so that the
lateral load transfer characteristics of the deck could be established. The load tests
were performed by driving the truck across the bridge at crawl speed along the
prescribed paths. Data was recorded continuously at 32 Hz during each pass and the
truck position was monitored in order to record strain as a function of vehicle position.
Truck crossings from each path were performed twice to ensure data reproducibility.
Bài giảng Thí nghiệm cầu - Page 131 of 168
3
11.0 Kips
27.90 Kips
6.5’
6.1’
12.0’
4.3’
Axle loads:
Figure 2 Load Configuration of Test Truck
All of the instrumentation and testing procedures were completed on August 13
th
,
1998 with traffic control and a loading vehicle being supplied by BCEO.
Preliminary Investigation of Test Results
A visual examination of the field data was first performed to assess the quality of
the data and to make a qualitative assessment of the bridge’s live-load response.
Conclusions made directly from the field data were:
• All responses were primarily elastic. Readings from all top chord, diagonal, floor-
beam and stringer gages returned to zero after each load cycle. Slight residual
tension was present in some of the bottom chord gages indicating friction in the
truss bearing pads. The residual strains were in the range of 2% of the maximum
bottom chord strain.
• Midspan strain histories obtained from interior Stringers 4, 5, and 6 indicated that
the stringer ends are not firmly seated at the West abutment bearing locations.
Strains obtained from the midspan, bottom-flange gage locations in Bay 1 initially
went into compression (negative moment) when the axles where on the west-end of
the stringers. This response could only be caused by the beam not being in contact
with the abutment beam seat. The beam to be pushed down to make contact with
the bearing. Once contact was made with the abutment, the interior stringer
responses were similar to the other stringers. The reversal of flexural responses on
Stringer 4 can be seen in Figure 3.
• Reproducibility of the load responses from identical truck crossings was excellent as
shown in Figure 4. Some differences in load response were detected at the bottom
chord near the abutment. These gages also showed the largest degree of inelastic
behavior. These responses indicate that some movement does occur in the truss
bearings, the slight nonlinear and inelastic behavior is due to the friction in the
support system.
• The end bottom chord member (L0-L2) went into compression while the truck was
on the first span indicating that the truss support conditions have a significant
amount of axial force resistance. This response implies that pin/roller support
conditions cannot be assumed in a subsequent analyses.
Bài giảng Thí nghiệm cầu - Page 132 of 168
4
• Comparison of similarly-placed gages on the North and South Trusses indicated that
the response behavior was reasonable symmetric. Gages nearest the abutment had
the largest difference indicating that the degree of friction in each bearing is not
consistent. Figure 5 contains stress history comparisons from the bottom chord (L0-
L2) from both trusses. It is apparent that both truss bearings have nearly the same
axial resistance during the initial loading while member L0-L2 experienced tension.
However, the south truss bearing was approximately twice as stiff as the north truss
when the load reversal occurred and member L0-L2 experienced compression.
• Maximum measured live-load compression and tension stresses of -3.76 ksi (-
130µε) and +4.47 ksi (154µε) were obtained from the floor beams and stringers.
Maximum stresses obtained from the truss were -3.25 ksi (-112µε) and 2.65 (91µε).
Because of the gage placement, the strains measured in the truss members were
induced by axial force only and do not include bending responses. Maximum axial
stresses from each gage are provided in Table 1 for each truck path.
• Measurements made during high-speed truck crossings (25mph) resulted in
maximum stresses of -3.82 ksi in compression and 4.59 ksi in tension. The largest
stress cycle from the dynamic component was approximately 0.85 ksi resulting in an
impact factor of 19%. The use of the AASHTO impact factor of 26% for the 69' span
truss would therefore be reasonable. However, a 30% impact factor as specified by
AASHTO for the floor beams and stringers was found to be conservative. Figure 6
contains a graphical comparison between stresses for slow and high-speed truck
crossings.
All of the above information was extracted directly from the field data just by
looking at the shapes and magnitudes of the strain histories. This illustrates how a
"qualitative" look at the data can provide significant insight into its live load behavior.
The following section illustrates how the field data was used to generate and “calibrate”
an analytical model of the structure.
Bài giảng Thí nghiệm cầu - Page 133 of 168
5
Figure 3 Stringer 4 @ West Bay - Abutment beam-end not in contact.
Figure 4 Reproducibility of test procedure and data acquisition.
Bài giảng Thí nghiệm cầu - Page 134 of 168
6
Figure 5 Asymmetric Stresses on North and South Truss.
Bài giảng Thí nghiệm cầu - Page 135 of 168
7
Figure 6 Strain Histories from Slow and Fast Truck Crossings.
Table 1 Maximum measured stresses on truss, stringers and floor beam.
Member
Gage
Truck Path 1 (ksi)
Truck Path 2 (ksi)
C
T
Range
C
T
Range
North Truss
Top Chord U1-U3
13
-1.17
0.00
1.17
-3.25
0.02
3.27
Diagonal U1-L2
14
0.00
0.69
0.70
0.00
1.97
1.97
Bottom Chord L0-L2
15
-0.28
0.47
0.75
-0.68
1.32
2.00
End Post L0-U1
16
-0.78
0.01
0.79
-2.11
0.01
2.13
Top Chord U3-U5
21
-1.12
0.01
1.13
-3.09
0.01
3.09
Bottom Chord L4-L4'
22
-0.01
0.71
0.72
-0.01
2.11
2.11
Diagonal L2-U3
23
-0.41
0.20
0.61
-1.24
0.82
2.06
Bottom Chord L2-L4
24
-0.02
0.92
0.94
0.00
2.65
2.65
South Truss
Top Chord U1-U3
1
-3.20
0.00
3.21
-1.27
0.01
1.28
Diagonal U1-L2
2
-0.01
2.04
2.05
-0.01
0.80
0.81
End Post L0-U1
3
-2.88
0.02
2.90
-1.14
0.01
1.15
Bottom Chord L0-L2
4
-1.35
1.30
2.65
-0.56
0.43
0.99
Floor Beam & Stringers
Floor Bm - midspan
6
-0.05
3.00
3.06
-0.09
4.34
4.43
Floor Bm - 1/4 pnt
8
-0.02
1.42
1.44
-0.06
3.82
3.88
Stringer 2 midspan btm
29
-0.33
4.43
4.76
-0.17
0.66
0.83
Stringer 3 midspan btm
30
-0.31
3.20
3.51
-0.21
1.03
1.24
Stringer 4 midspan btm
31
-0.60
3.02
3.63
-0.21
0.97
1.18
Stringer 5 midspan btm
32
-0.53
1.41
1.94
-0.74
1.64
2.38
Stringer 6 midspan btm
18
-0.15
0.69
0.85
-0.98
3.63
4.61
Stringer 7 midspan btm
20
-0.18
1.04
1.22
-0.36
4.47
4.82
Stringer 8 midspan btm
10
-0.12
0.56
0.69
-0.29
4.01
4.31
Stringer 9 midspan btm
12
-0.14
0.13
0.26
-0.24
2.75
2.98
Stringer 7 3/4 pnt bay 1
26
-0.09
0.87
0.95
-0.49
2.95
3.43
Stringer 7 1/4 pnt bay 1
27
-0.11
0.66
0.77
-0.26
2.49
2.75
Stringer 7 midspan bay 2
28
-0.09
0.49
0.58
-0.18
3.93
4.11
Modeling, Analysis, and Data Correlation
From the above discussion, it is apparent that field data alone can provide a
considerable amount of useful information. But it is important to realize that strain values
can be influenced by a large number of factors, some of which are not obvious or may not
be reliable at higher load levels. In addition, the maximum strains did not necessarily
occur at the gage locations and the critical responses may not have been measured.
Therefore, it is important to verify measured responses through analysis and then
determine the critical responses throughout the entire structure. The most rational load
rating approach is to use sound engineering principles along with a realistic analysis. With
this reasoning, the best use of strain measurements is to aid in the generation of an
accurate model of the structure.
A 3-D finite element model of the superstructure was defined and the entire field
testing operation was essentially reproduced in the modeling and analysis procedures. 3-
Bài giảng Thí nghiệm cầu - Page 136 of 168