Báo cáo lâm nghiệp: "Spatial and temporal diversity of wood decomposer communities in different forest stands, determined by ITS rDNA targeted TGGE" potx
Bạn đang xem bản rút gọn của tài liệu. Xem và tải ngay bản đầy đủ của tài liệu tại đây (347.45 KB, 10 trang )
Ann. For. Sci. 63 (2006) 547–556 547
c
INRA, EDP Sciences, 2006
DOI: 10.1051/forest:2006037
Original article
Spatial and temporal diversity of wood decomposer communities in
different forest stands, determined by ITS rDNA targeted TGGE
Ariana K
´
´
a,b
*
, Thierry B
´
b
, Judicaël M
a,b
,
Jacques B
b
, Jacques R
a
a
INRA, Centre de Nancy, Unité Biogéochimie des Écosystèmes Forestiers, 54280 Champenoux, France
b
LIMOS, CNRS UHP UMR 7137, Université Henri Poincaré, BP 239, 54506 Vandœuvre-les-Nancy, France
(Received 3 March 2005; accepted 22 March 2006)
Abstract – The aim of this study was to determine the dynamics of colonisation and composition of the wood-decomposer community in a native forest
and four monocultures over time. A fingerprinting method of TGGE (temperature gradient gel electrophoresis) with rDNA amplified by ITS1F and
ITS2 primer pairs was optimized and used as a culture-independent approach to determine the dominant fungal species and biodiversity over a two-year
period of decomposition of beech-wood samples. The bacterial community after two years was also investigated. Data showed that each tree species, as
well as sampling date, displayed the characteristic community structure. There was no strong decrease in microbial species richness or Shannon-Wiener
diversity index caused by a change of tree species. Nevertheless, a strong shift in decomposer community structure was evident among the tree species
both for fungi and bacteria. The effect of environmental conditions was also significant.
wood / decomposers / forest / ITS / TGGE
Résumé – Étude par TGGE de la diversité spatiale et temporelle des communautés de décomposeurs du bois en fonction des essences fores-
tières. L’objectif de cette étude était de caractériser la dynamique de colonisation d’un matériau modèle (du bois de hêtre) par les lignivores au cours
de la décomposition, dans une forêt native et sous quatre essences de substitution à la forêt native feuillue. La technique d’empreinte génétique de
TGGE (électrophorèse sur gel en gradient de température) ciblée sur l’ADN ribosomique, amplifié par les amorces ITS1F et ITS2, a été optimisée et
utilisée pour déterminer les espèces fongiques dominantes ainsi que la diversité totale au cours des deux années d’incubation in situ des échantillons. La
diversité bactérienne a également été étudiée sur les échantillons prélevés après deux années d’incubation. Les données indiquent que le peuplementet
la durée d’incubation modifient la structure des communautés fongiques. Il n’y a cependant pas de forte diminution du nombre d’espèces ni de l’index
de diversité de Shannon-Wiener associée au changement d’essence forestière. Toutefois, il y a une forte évolution dans la structure des communautés
de décomposeurs entre les peuplements, à la fois pour les champignons et les bactéries. Les effets des paramètres environnementaux sont discutés.
bois / lignivores / forêt / ITS / TGGE
1. INTRODUCTION
A significant part of European forests has been replaced by
even-aged plantations of native or alien tree species, especially
during the last century. Such large changes modify soil condi-
tions such as microclimate or organic and mineral chemistry of
the litter. This can significantly influence the abundance, struc-
ture and activity of the soil microbial community regarding its
and, thus, the functional integrity of the forest soil.
Plant litter decomposition is an important factor controlling
organic matter decay, nutrient turnover and humus formation
in forest ecosystems. It is also relevant at the biosphere level,
because decomposition releases significant amounts of green-
house gases. Thus, soil organic matter represents a major sink
for carbon [6]. Therefore, research of belowground species di-
versity, with respect to the environment and microbial activity,
is required to achieve a full understanding of forest ecosystem
functioning. It is an important goal in regards to sustainable
* Corresponding author:
forestry as well as having a potential role in global climate
change.
The decay activity is expected to be positively related to
the number of decomposer taxa. Even recalcitrant substrates,
such as lignin, should degrade faster in diverse systems rela-
tive to simple ones, probably due to the complementary roles
of different fungal species [26]. Fungal succession during lit-
ter decomposition has been recently studied for several forest
floors under different tree species [22,27,31].
However, the dynamics of complex systems are not easy
to describe. The behaviour of a single, isolated species or a
simple community in a micro- or mesocosm study might not
reflect its behaviour in a more complex natural environment.
The use of model material decomposing in a tree monoculture
could be a possible way to control variability by decreasing
the effects of total natural complexity.
Suitable molecular techniques to study microbial species
composition are based on direct extraction of DNA from envi-
ronmental samples, thereby circumventing the culturing step
Article published by EDP Sciences and available at or />548 A. Kulhánková et al.
and giving a more realistic view of total diversity [1]. The use
of internal transcribed spacer (ITS) primers to amplify fungal
ITS of rDNA was originally described by White et al. [32]
and pioneered by Gardes et Bruns [9]. Studies based on the
ITS region showed that intraspecific variation was very small
when studying fungal isolates from the same geographical
area, while interspecific variation was large enough to distin-
guish different species [16]. Moreover, analysis of the ITS re-
gion was more specific and taxonomically more informative
than other genomic regions(e.g. 18S) [19]. Molecular methods
to describe microbial succession were used in different studies,
e.g. for investigating the decomposition of spruce and pine lit-
ter across a moisture gradient [33], beech and spruce litters [3]
or to study wood-inhabiting fungi [14,15,29].
The present study deals with microbial colonisation of
wood samples incubated for two years below five different
tree species under the same ecological conditions. The first
objective was to improve the method of ITS1F and ITS2 tar-
geted TGGE. It was hypothesized that the samples would show
differences in decomposer patterns when compared (i) be-
tween native forest and corresponding broadleaved planta-
tions, (ii) among forest species and (iii) within the duration of
the decay process. We also expected to identify the key species
which characterise the stands, as well as the temporal succes-
sion.
2. MATERIALS AND METHODS
2.1. Site description
The experimental site of Breuil-Chenue forest is situated in the
Morvan Mountains, Burgundy, France. Its altitude is 640 m, latitude
47
◦
18’ 10” and longitude 4
◦
4’ 44”. Mean annual temperature is 9
◦
C,
with 1280 mm precipitation and evapotranspiration of 640 mm. The
substrate is granite with desaturated acid soil (pH 4–4.5, 60% of sand,
20% of clays). The natural potential vegetation would be a mixed
broadleaf forest. It evolved with management towards a semi-natural
coppice with a forest dominated by Fagus sylvatica L. and Quercus
sessiliflora Smith, associated with several other dominant species like
Betula verrucosa Ehrh. and Corylus avelana L. This native forest
was partially cut down in 1976 and replaced by various monocultures
planted in 1000 m
2
plots each. Five different stands were selected
for the treatment: four young plantations, namely beech (Fagus syl-
vatica L.), oak (Quercus sessiliflora Smith.), Norway spruce (Picea
abies Karst.) and Douglas fir (Pseudotsuga menziesii Franco.) and
the native forest as a reference plot. All of these stands had the same
environmental conditions. Thus, all variations in physical and chem-
ical properties are expected to be caused by the forest tree species.
For the same reasons, changes in the biological characteristics, such
as the structure, of the decomposer community were supposed to be
driven by the tree species.
2.2. Field experiment
Beech-wood pieces (4.5 × 3.5 × 0.5 cm) were incubated in the
five different forest stands using the classical litter-bag method. Mesh
size of the bags was 5 µmandtheinsidearea5× 5 cm. The distance
between two replicates was 0.5 m and 1.5 m between two blocks. The
bags were placed in the stands in late November 2002. They were
collected after either 3, 9, 12 or 24 months (February, September and
November 2003, and early December 2004). Three replicates were
sampled and stored in a deep freezer until analysis.
2.3. Molecular analyses
The surface layer, including mostly fungal mycelia and a small
amount of degraded wood, was scraped from each sample. Total
genomic DNA was isolated from these prepared samples using the
Dneasy plant mini kit (Qiagen) following the manufacturer’s proto-
col without any modification.
Fungal communities were analysed using ITS1F and ITS2 primer
pairs to amplify by PCR the 300bp fragment of the fungal ITS
rDNA. The primer ITS1F (5’-CTT GGT CAT TTA GAG GAA GTA
A-3’) [13] is higher fungi ITS specific, while ITS2 (5’-GCT GCG
TTC TTC ATC GAT GC-3’) is a universal primer amplifying the
ITS region from Eucaryotes, including both Ascomycetes and Basid-
iomycetes [32]. A 40 bp GC-clamp was attached to the 5’ end of the
primer ITS2 to avoid a complete separation of DNA strands during
denaturing electrophoresis. The reaction medium consisted of 5 µL
of PCR buffer (Sigma, 100 mM Tris-HCl, pH 8.3, 500 mM KCl,
15 mM MgCl
2
), 1 µLofdNTP(10mM),1µL of each primer
(20 µM), 0.5µL of Taq-polymerase (5 units/µL, Sigma), 1 µLofGC-
rich solution (Sigma) and 2 µL of genomic DNA brought to a final
volume of 50 µL. The amplification regime consisted of an initial
cycle of denaturation at 95
◦
Cfor3minfollowedby35cyclesof
denaturation at 94
◦
C for 45 s, annealing at 55
◦
C for 45 s and exten-
sion at 72
◦
C for 1 min 15 s. The amplification concluded with a final
elongation step at 72
◦
Cfor8min.
Bacterial communities were analysed using the eubacterial primer
set, 968f and 1401r, to amplify by PCR a 475-bp fragment of 16S
rDNA from the same DNA extract as above [13]. A 40-bp GC clamp
was attached to the 5’ end of the primer 968f. A 50 µLPCRmix-
ture containing 5 µLofPCRbuffer (Sigma, 100 mM Tris-HCl, pH
8.3, 500 mM KCl), 1µLofdNTP(10mM),1µL of each primer
(100 µM), 0.5 µL of Taq-polymerase (Fastart, Roche Diagnostic),
2 µLofMgCl
2
,1µL of GC-rich solution (Sigma), 2 µLofBSA(3%)
and 2 µL of genomic DNA was used. The amplification regime con-
sisted on an initial cycle of denaturation at 94
◦
C for 5 min, followed
by 35 cycles of denaturation at 94
◦
C for 40 s, annealing at 56
◦
Cfor
30 s and extension at 72
◦
C for 1 min concluded with an elongation
step at 72
◦
Cfor5min.
All PCR reactions were performed using an iCycler Thermal cy-
cler (Biorad). PCR products(7.5 µL, 1.5 µL of loading buffer) were
loaded onto 1.5% (wt/vol) agarose gels and electrophoresed (1× TAE
buffer, 110 V, 45 min). Then the gels were stained with ethidium bro-
mide (0.5 mg/L, Biorad) and the DNA bands visually inspected under
UV light to verify the size and quality of the generated amplicons.
TGGE was performed with a Dcode Universal Mutation Detection
system (Biorad). In the case of fungi, polyacrylamide gels ((8% acry-
lamide (wt/vol), 8 M urea, 1.25 × TAE and 0.2% glycerol (vol/vol),
300 µL of ammonium persulphate (10%) (wt/vol) and 30 µLof
TEMED) were allowed to polymerize over 1.5 h. Amplified DNA
samples with the same volume of loading buffer (10 µL each) were
separated by electrophoresis in 1.25 × TAE at a constant voltage
(145 V) at a temperature gradient from 50
◦
Cto55
◦
C with a temper-
ature increment of 1 degree per hour. For bacteria, TGGE conditions
Wood decomposer diversity in forests 549
differed by using 7% acrylamide gels (wt/vol) and a temperature gra-
dient from 58
◦
Cto63
◦
C with the same temperature increment. Gels
were stained with ethidium bromide after electrophoresis and eval-
uated under UV light. Twenty of the most important fungal bands
were excised from the gel and re-amplified with the previous primers
set (non-clamped), purified (Quiagen purification kit) and sequenced
(MWG Biotech). The DNA sequences obtained were compared to
sequences available in the Genbank database of the National Centre
Biotechnology Informatics (NCBI) using the Blast software.
2.4. Statistics
Species distribution and relative abundance were calculated based
on data analyses using the Quantity One software (Biorad) with a po-
sition tolerance of 2 mm, giving a maximum of 50 detectable species.
Bands with intensities less than 5% of the intensity of the dominant
band were excluded from the analysis. For each profile, the total num-
ber of species (species richness) and the Shannon-Wiener diversity
index (referred to as SW hereafter) were calculated based on a natu-
ral logarithm transformation of the abundance data [10].
The significance of time and tree species on microbial species
richness and SW diversity was tested by ANOVA using the Statis-
tica software. The banding patterns of TGGE profiles were analyzed
using multivariate techniques, reviewed in Fromin et al. [8]. These
methods facilitate finding the variation in a multidimensional data
set in a reduced space and assessing the association between species
present and selected environmental factors. An initial DCA analysis
was used to assess the trend of the data along the gradient. Because
the structure was mostly linear, PCA and RDA were calculated using
the square-root transformed relative abundances for each species in a
profile. DCA and CCA were used in two cases of unimodal distribu-
tion. In the ordination plots presented, arrows indicate the direction
in which the scores would move if the value of the environmental
variable increased. The length of the arrows indicates the relative im-
portance of the species/variable in explaining the variability between
profiles. The angle between the arrows indicates the degree to which
they are correlated. Monte Carlo permutation tests calculated the sig-
nificance of a given factor. Forward selection was used to rank envi-
ronmental variables in importance for determining the species data.
All ordinations were computed using the Canoco software package.
The significance level was set at p < 0.05 for both the ANOVA and
multivariable analyses.
3. RESULTS
3.1. Fungal species richness and diversity
All fifty potential fungal species were detected in the whole
stands-time matrix. The number of species per TGGE profile
ranged from 5 to 22. Generally, the total number of species
present in all stands increased with time from 36 species at the
firstsamplingdateto45after2yearsofincubation(Tab.I).
The average number of species per sample exhibited the same
trend (from 10.5 to 16.5 species detected) as did the average
SW diversity index (0.866–1.083 in 4 months and 2 years, re-
spectively). The only exception was the 8 month sampling,
which had the lowest values of all of these characteristics. The
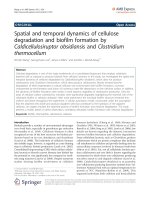
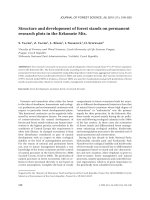
Figure 1. Fungal species distribution (arrows with numbers) and tree
species position (circles and tree names) in ordination space accord-
ing to the fungal community composition, based on the whole tree
species-time matrix (5 tree species, 4 samplings together). Each ar-
row points in the direction of the steepest increase of abundance for
the corresponding fungal species. The angles between arrows indi-
cate correlations between them. The numbers correspond to the fun-
gal species codes used in the text and Table II.
effect of time was found to be significant both for species rich-
ness and SW diversity (p < 0.001).
Tree species had a negligible influence on the total number
of species detected, which varied from 40 to 43 within all the
samplings (Tab. I). There were no significant differences either
in average species richness or SW index for individual stands,
although the native forest showed the highest measures (13.5
species in each sample, SW = 0.993) and the spruce site the
lowest (only 11 species and SW = 0.904). Intermediate values
were found in the oak, beech and Douglas-fir stands (12.6 and
0.937; 12.3 and 0.920; 12.2 and 0.934, respectively).
Twenty of the selected bands of the more common species
were sequenced. The most similar species in the Genbank
database are listed in Table II, together with the percent simi-
larity to the reference sequences.
3.2. Fungal community structure over time and among
stands
The first PCA component expressed 13.5% of the fungal
species variability within all tree species and sampling dates.
In RDA, the community composition was shown to be signifi-
cantly affected by both time and tree species, together explain-
ing 16.3% of total variation for the whole data set. A slightly
higher weight could be noted for the tree species effect (8.8%)
than for the time effect (7.5%). These values matched 9.5 and
8.2%, respectively when analysed with the second factor as a
covariable. Random tests confirmed the influence of both vari-
ables with p-values of 0.001. Beech was the most discrimi-
nating tree species given by forward selection, followed by
spruce, native forest, oak and Douglas-fir (Fig. 1).
Sampling dates were analysed separately (five tree stands
together for each sampling date) in order to obtain a clearer
550 A. Kulhánková et al.
Table I. Results of the multivariable analyses, together with the total number of species present, average species per sample (“richness”) and
Shannon-Wiener (SW) diversity index values. Scores for fungal communities in the sampling dates and tree species, for all stands and dates
together, and bacterial diversity after 2 years are given. Variability explained by the 1st axis of indirect analyses (mostly PCA), all canonical
axes (mostly RDA) and results of Monte Carlo permutation tests of stand or time effect (bold where significant) can be found.
Species Undirect Direct anal. p value F ratio Species SW index
number
1
st
axe
ytisrevid fossenhcirsexa .nac
F All matrix Time*
0.001
4.807 12.3 0.937
All matrix Stand* 50 13.5 9.5
0.001
1.797
F 4 months Stand
0.010
1.629 10.5
8 months
12 months 42 19.1 42.3
0.002
1.829 13.6
24 months 45 17.6 30.0
F Native f. Time
0.002
2.144 13.5
Spruce *** 40 21.5 14.7
0.018
1.700 11.0
Beech *** 41 22.0 12.0
Oak 40 24.2 15.9
0.016
1.188 12.6
Douglas 43 19.6 14.0
0.016
1.623 12.2
B 24 months Stand
0.020
1.507 12.4
Data set
1.088 8.6
1.071 16.5
0.076
1.340 12.3
0.300
0.350
effect
6−22**
0.995
1.083
0.993
0.866
0.806
0.904
0.920
0.937
0.934
0.931
0 .52−1.28**
Tested
43 22.9 17.7
36 22.5 39.5
32 26.5 30.4
50 13.5 8.2
41
23.5
37.5
* Unimodal analysis used (DCA and CCA), ** second effect (time or stand) as covariable, *** total range of values. F: Fungi; B: Bacteria.
Table II. Blast comparison of the sequenced bands. The most particular species (identity), their database match and percentage of similarity
are given (sequenced fragments of 210-220 pb were compared).
ytiralimiShctam tsalBytitnedIselpmas fo .N.n seicepS
6 27 Leaf litter ascomycete strain its408 isolate A AF502889 96
737 Megacollybia platyphylla B AF498289 100
10 19 Unpublished species −−
12 32 Epacris microphylla root associated fungus AY268197 98
14 16 Uncultured fungus clone B1c from forest AY324159 98
17 23 Leaf litter ascomycete strain its356 A AF502859 97
19 17 Trametes versicolor B AY673076 93
21 27 Gerronema strombodes BU66433 92
23 16 Phlebia albida B AY219368 94
25 22 Dactylaria sp. P24 A AY265332 88
26 35 Phanerochaete sordida B AY219383 96
28 26 Fungal endophyte WMS13 A AY063309 94
30 25 Cryphonectria sp. CMW 11302 A AY214324 98
33 10 Epacrid root endophyte E4-5-5 A AF148952 91
35 9 Menispora tortuosa A AF178558 92
37 10 Coniosporium apollinis A AJ244271 90
39 17 Helotiales sp. sd2aN4b(A) A AY465452 95
41 16 Ascomycete sp. olrim349 A AY354279 95
42 23 Woollsia root associated fungus XVIII A AY230788 90
46 11 Chaetosphaeria pulviscula A AF178544 94
Species n. is the number used in the text and images, N. of samples implies in how many samples the species was detected. A: Ascomycetes,
B: Basidiomycetes.
Wood decomposer diversity in forests 551
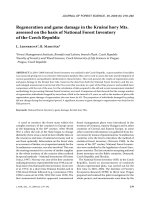
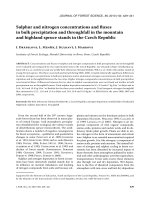
Figure 2. RDA bi-plot showing fungal species (arrows with numbers)
responses and succession over time in all tree species together. The
five tree species and four samplings were analysed together, with time
as the independent variable (arrow connected to x-axis).
picture of the relationship between fungal community com-
position and tree species effect. The tree species effect was
detected as significant in the first and third samplings (4 and
12 months) (Tab. I). In those cases, the variability of commu-
nity structure explained by RDA canonical axes also achieved
higher values (39.5 and 42.3%, respectively), the expressed
portion was weaker (30.4 and 30.0%, respectively) for non sig-
nificant sampling times (8 and 24 months). A slight decrease in
the importance of the first PCA axis appeared with time (from
22.5 to 17.6%) with the exception of the 8th month sampling
in late summer 2003 (26.5%).
Simultaneously, the time effect on species succession was
tested in individual tree stands (four sampling dates together in
each tree stand) (Tab. I). Its significant influence was detected
for all tree species except beech, where a trend could still be
seen (p = 0.076). Beech, together with spruce, also displayed
a non-linear species distribution along the time gradient so that
unimodal analyses (DCA) had to be used. The first component
of the indirect analyses explained from 19.6 to 22.9% of the
variability, whereas it ranged between 12.0 and 17.7% for lin-
ear techniques. The largest portion of the temporal community
evolution was expressed for oak and native forest by both anal-
yses.
There was a relationship between fungal species numbers
and occurrence with particular tree species (Fig. 1). Fungal
species numbers also changed over time (Fig. 2). Fungal com-
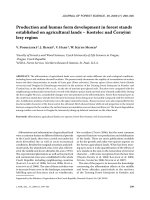
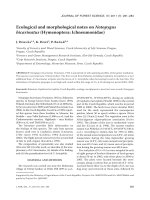
munity composition differed clearly among tree stands both in
the first (Fig. 3a, 4 months) and the last (Fig. 3b, 2 years) sam-
pling time. A distinct temporal shift can be detected. Conifer-
ous and deciduous stands were separated along the y-axis in
the first sampling period. This trend was less obvious in the
last sampling, with the native forest situated above the x-axis.
Coniferous stands tended to occupy the upper left portion of
the ordination plane in both cases even when the Douglas-fir
site displayed only low species specificity later. There were
(a)
(b)
Figure 3. RDA ordination plots illustrating the tree species position
at (a) the first sampling time (4 months) and (b) the last sampling time
(24 months) according to the fungal species distribution.
noticeable shifts in the young beech and native forest stands.
At the beginning of the study, a specific fungalcommunity was
found in the beech stand while its structure in the native for-
est was similar to that in the oak stand. By the end, the native
forest had a separate species structure and the young broadleaf
monocultures were grouped together.
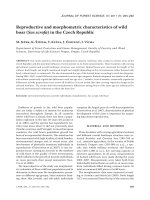
3.3. Stand condition effect on fungal communities
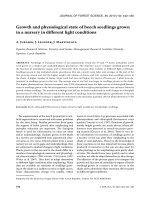
There were definite relationships between tree species and
their environment, as shown by the PCA of the important char-
acteristics of forest floor, upper soil layer and soil solution
(Fig. 4). The native forest, young broadleaf monocultures and
coniferous stands were well separated along the x-axis. The
oak site was positioned separately along the y-axis in the up-
per right quarter.
The importance of soil temperature and moisture were
tested separately, based on average values for the month before
sampling. The native forest was not included in the analyses
because of missing data. Both factors had significant impacts
on the species composition (p = 0.002 for both) and explained
5.7 and 5.8% of the total data set variability, respectively. As
expected, temperature and moisture were correlated.
3.4. Bacterial communities
Forty-one different bacterial species from the 50 potentially
detectable ones were found under the different tree species in
552 A. Kulhánková et al.
Figure 4. PCA ordination plot displaying relations of the environ-
mental variables (arrows) in the studied tree species. ff means nutri-
ent concentration in forest floor (C, N, C/N, P, K, Ca, Mg); sol means
concentration in soil solution in the top 5 cm (K, Ca, Mg). Other
variables in solution are also shown (pH, PO
3−
4
,NO
3−
,NH
4+
, DOC);
concentrations of available P, organic C and N were also measured
in the top 5 cm of the soil profile. The length of arrow indicates the
relative importance of the variable in explaining the position of the
tree species in the ordination space. The angle between the arrows
indicates the degree to which they are correlated.
the last sampling time (24 months). There were 12.4 species on
average per sample. The highest species richness was detected
in the native and oak forests (24 different species), followed
by beech (23), Douglas-fir (22) and spruce (20 species). The
native forest also had the highest average number of species
present per sample (14), followed by oak (12.7), spruce (12.3),
Douglas-fir (11.7) and lastly beech (11.3). The highest diver-
sity index value was also associated with the native forest
(SW = 0.998), followed by the conifers and oak (approxi-
mately 0.95), with the lowest rate in beech (0.745). However,
the influence of tree species on bacterial species richness and
diversity was not significant.
The first PCA component explained 23.5% of the bacte-
rial data set variability. The canonical axes of RDA, with tree
species as independent variables, expressed 37.6% of the vari-
ability. Permutation tests showed a significant influence of tree
species on the bacterial community composition (p = 0.02,
Tab. I). The distribution of the tree species, as a function of
bacterial species distribution, showed a clear separation along
the visualized axes (Fig. 5). The native forest appeared to have
a similar bacterial composition as the spruce stand. Young de-
ciduous monocultures were grouped in the lower left part of
the plot while the Douglas-fir stand differed clearly from the
others, being located in the upper left quarter. The Douglas-fir
stand was the most discriminating, based on the forward selec-
tion of environmental variables, followed by oak and then the
three other stands.
Figure 5. RDA ordination plot showing tree species position accord-
ing to bacterial species distribution after 2 years of samples colonisa-
tion. The native forest and spruce did not differ either by position on
the x or y-axis and thus they had similar bacterial communities.
4. DISCUSSION
4.1. Molecular approach
The fungal ITS region was targeted because it appeared
to be taxonomically more informative than other genomic re-
gions [19]. We also tried the 18S amplification with the same
DNA samples. The number of visible bands after electrophore-
sis was lower than in the case of ITS. In addition Anderson
et al. [2] noted that the ITS1F and ITS2 primers gave the
sharpest and most consistent electrophoresis profiles in their
fungal diversity study in organic soils. The primer pair effi-
ciently amplified both asco- and basidiomycetes species in the
present study as well as in Gardes and Bruns’ study [9]. TGGE
has been shown to be a sensitive and robust method for inves-
tigating soil fungal communities, particularly where the aim
was to investigate shifts or changes in community composi-
tion [1, 30]. The ordination methods allowed comparison of
both the position and the relative intensity of different bands
within gels, as well as the interpretation of ecological signifi-
cance [8].
In total, 20 fungal bands were sequenced and compared to
similar sequences present in the GenBank database. A cer-
tain limitation imposed by existing databases must be noted
when characterizing natural communities. Therefore, blasting
did not completely provide determination at the species level.
The majority of sequences had a high similarity to the fungal
ITS sequences of the database. However, four of them matched
uncultured fungi generated from previous molecular studies,
but were not named to species, while one sequence had nosim-
ilarity to any in the database. Despite only approximate identi-
fication, it was assumed that all sequences belonged to fungal
species that occur in forest stands and are mostly saprophytic.
It is also possible that there are un-cultivable species present,
which are not currently represented in databases.
It was also realized that single bands did not necessarily
originate from one species and that one band could contain
Wood decomposer diversity in forests 553
different sequences [20]. We tried to sequence several bands
at the same position, as well as to have more replicates of
the same bands. The results obtained by the sequencing were
always similar. Thus, it was possible to assume that TGGE
provided a quick and high resolution in the separation of mi-
crobial DNA fragments.
It is likely that the decomposer community present in the
forest soil, as well as the site conditions, were more impor-
tant for the resulting diversity than the origin of the incubated
material (beech-wood). Thus, both non specific and specific
fungi should be present in all of the stands. An advantage
of this is that it gives the ability to compare situations using
only a single probe. Nevertheless, it is a disadvantage to use a
model material which is one of the set of species being inves-
tigated. It would be interesting to make a comparison with a
wood probe from a different species. It has been documented
that fungal mycelial ingrowths and the rates of mass loss and
respiration could differ with litter material when incubated in
the same site [31]. The sample size used in the study should
be adequate to ensure high diversity, since small diameter de-
bris has a relatively larger surface area per volume than larger
ones [11]. Accordingly, Kruys and Jonsson [17] found smaller
spruce logs to host more cryptogams than logs with diameters
over 10 cm. Moreover, spatial heterogeneity within the soil is
high and can be linked to the distribution of micro-organisms;
there is a close relationship between sampling strategy and the
observed species richness [28]. However, the PCA analyses
(not shown) confirmed high variability of diversity between
stands but a relatively low variability between sample repli-
cates. Therefore, our design recorded well the species distri-
bution patterns.
4.2. Tree species and time effect
Each tree species, as well as sampling time, displayed a
characteristic fungal community structure. The effect of both
factors was highly significant. Oak and native forest had quite
similar species structure over the whole observation period.
There were also other species that are present in other stands,
except for spruce whose species composition was highly spe-
cific. Douglas-fir had some species in common with Norway
spruce but tended to converged more towards the oak site.
There was very little species overlap between Douglas-fir and
beech at the same time. The species composition of the young
beech stand was rather similar to the community observed in
the native forest. Nevertheless, both beech and spruce stands
had fewer species that were common in the three other stands.
The fungal communities in some particular spruce and
Douglas-fir samples seemed to be less variable than over the
whole period of incubation. This might be caused by the pres-
ence of some species typical for coniferous sites at a given
time (e.g. species 10 or 17). There were clear shifts over
time in the fungal communities of the native forest and beech
stands. At the beginning of the incubation, the fungal species
composition of the native forest resembled that of oak, while
the beech fungal communities were distinct from these stands.
The situation was reversed in the last sampling. Similar fungi
were present in the young deciduous monocultures whereas
the native forest had a unique species composition. This might
not be so surprising, because the native stand was composed of
both oak and beech trees. Rather, it could reflect the presence
of several species typical for broadleaf stands but differing in
certain ecological demands (e.g. species 42, present in the na-
tive forest at first, but in the oak and beech monocultures at
the end) or to the greater importance of ecological conditions
in earlier rather than later stages of decay. This could be de-
termined by the analyzing the stands distribution in relation
to environmental variables (Fig. 4) and within the first sam-
pling time (Fig. 3a). Interestingly, the time effect was highly
significant in the oak and native stands whereas the beech was
the only one where its role was not evident. Moreover, several
characteristic of the native forest, such as a greater amount
of dead wood on the forest floor, age differentiation of the
trees, species mixture and more energy reaching the soil sur-
face, would support greater niche complementarity for both
specialist and generalist fungal species.
Both species richness and SW diversity clearly increased
over time. No substantial changes between the stands were
found in overall quantity of species present during the whole
period. Nevertheless, the average species number per sam-
ple was slightly higher in the native forest and lowest in
spruce. Even though no significant decrease was observed
in the wood-colonizing species number caused by a change in
tree species, other ecological effects could be expected. For ex-
ample, microbial biomass could be reduced in response to less
favourable litter quality or certain functional changes might
occur. Previous studies in the same research site [23] showed
the highest amount of both saprophytic and ectomycorrhizal
fungal species occurred in the native forest (104 species to-
gether), while the lowest was in the oak and beech stands
(26 species only). Lejon et al. [18], using the ARISA molec-
ular approach, also showed a strong discrimination of fun-
gal communities under the studied tree species. They showed
by comparing that the microbial biomass in the upper layer
was highest in the native forest, followed by oak, spruce and
Douglas-fir (beech was not included) [18]. Plant species rich-
ness was also highly affected [23], being highest in the oak
stand followed by beech, spruce and Douglas, with 16, 10, 7
and only 2 species present in the under-storey respectively (no
data was available for native forest).
Several recent studies have screened macro-fungal species
richness on decaying wood. Bader et al. [5] found the greatest
number of species at intermediate stages of wood decay and
a negative correlation between species number and logging
activities in a Swedish boreal forest. Accordingly, Heilmann-
Clausen and Christensen [12] detected a decrease in fungal
species number with forest age in beech sites in Denmark.
This could be caused by a loss of weakly competitive non-
specialized species, to the benefit of highly competitive or
narrow niche specialists, as the fungal community matures,
whereas wood that has started to soften may contain a mix-
ture of early, intermediate and late successional species. A
meta-analysis of diversity studies showed high macro-fungal
diversity associated with high tree species richness [25]. Ro-
driguez et al. [24] found no significant difference in the total
554 A. Kulhánková et al.
population of lignin and lignocellulosis degrading fungi im-
perfecti from laurel and pine forests on Tenerife. Species of
Penicillium and Fusarium were identified as the most efficient
lignin degraders. Cox et al. [7] illustrated the importance of
the effects and interactions of specific fungi during lignin de-
composition in a Scots pine forest.
Bacterial communities were also specific for each forest
stand. The greatest numbers of species were detected in na-
tive and oak stands, followed by beech and conifers. Accord-
ingly, the highest average species number per sample was in
the native forest whereas the beech site had the lowest value.
Similarly as for fungi, ARISA profiles showed that tree species
induced a specific genetic structure of the bacterial communi-
ties [18].
4.3. Fungal species patterns
Ascomycetes comprised the highest portion of identified
fungi rather than basidiomycetes. Nordén et al. [21] found
more basidiomycetes than ascomycetes species in their study
of wood-inhabiting fungi in temperate broadleaved forests.
However, their study was based on recording stroma and fruit-
body diameters of 1 mm or more. The molecular approach
could offer a for more reliable detection of fungal mycelium
in belowground wood debris than the distribution of fruit bod-
ies [15].
Five of the fifty defined fungal species occurred only once
(these were not shown in the ordination plots), while twelve
species occurred in more than one third of all samples. The
most abundant were species 7, 26 and 12, appearing in 37, 35
and 32 TGGE profiles, respectively.The most common species
(number 7) was identified as Megacollybia platyphylla, the or-
der Agaricales. This was the only one with a 100% similar-
ity with the Genebank database. It was also the only species
detected in the same forest site where carpophore diversity
was studied [23]. Twenty-eight species were found in all sam-
pling times and 31 under all tree species. The 23 species rep-
resenting the intersection of these categories were present in
all stands in all sampling times, but varying in the number
of occurrences. Some species were associated with coniferous
species (e.g. 7, 8, 10, 17, 27 or 44), young deciduous trees (14,
26, 28, 33, 38, 40, 45) or with the native forest (9, 23, 29, 36
and 49). Others seemed to prefer sites dominated by beech, i.e.
native forest and young monoculture (13, 23, 39). Species (8,
10, 17 or 19) were identified mostly in the early stages of colo-
nization (Fig. 2). Species (6, 13, 36, 40, 42, 46) were positively
correlated with the later stages. Species appearing largely in
intermediate periods were distributed along the positive part
of the y-axis (14, 21, 24, 25, 33).Species mostly absent during
the second sampling (26, 28, 30) were in the negative range.
Species which showed no time response are presented only by
short arrows (9, 15, 23). Only a few fungi species displayed no
or only weak tree stand or sampling time preferences (e.g. 11,
12, 15, 16, 18 and 31).
For bacteria, nine of forty-one species occurred at least
once in each tree species after 2 years of incubation. Five
species were present in more than two-thirds of the TGGE
profiles. Conversely, 12 species appeared in only one profile.
Also, characteristic bacteria species for different stands could
be found.
4.4. Relation with environmental conditions
All differences in the studied forest site conditions were
assumed to be caused by the dominant tree species, because
geology and meso-climate conditions were very homogenous
and site histories were the same (plantations were made af-
ter clear-cutting the broadleaf semi-native forest). Coniferous
stands appeared to have certain specific characteristics when
compared to broadleaved stands three decades after planta-
tion establishment. They had low concentrations of total or-
ganic carbon and nitrogen in the forest floor and higher C/N
ratios. Coniferous stands also had higher pH of the soil solu-
tion and phosphate and potassium concentrations. There was
more inorganic nitrogen in the spruce and Douglas-fir stands.
Douglas-fir stands displayed extremely high concentrations of
nitrates. On the contrary, both nitrate and ammonium concen-
trations were very low in the native forest, as was phosphate
content. Low pH was also typical of the native forest.
Conifers had the lowest phosphorus and potassium amounts
in the forest floor. Oak had a nutrient-rich forest floor, which
could lead to higher concentrations of organic carbon and ni-
trogen in the humus, together with high amounts of DOC,
ammonium, available phosphorus, calcium and magnesium.
Beech seemed to have intermediate values for most of these
characteristics.
Native and beech forests differed in stand age and certain
ecological characteristics, but had similar dominant species.
The native forest could be assumed to be a climax-like ecosys-
tem with well balanced processes unlike in the young mono-
cultures, as shown by the high values of mineral nitrogen and
phosphorus in conifers, compared to the strong retention of
organic forms in the native forest.
Physical conditions that significantly changed according to
season, such as temperature and moisture, might control both
species composition and their decaying activity. Meso and
pedo climatic conditions (air temperature and relative humid-
ity, soil temperature and moisture) were monitored continu-
ously since 2001 [23]. Beech was the warmest stand in all
samplings, spruce the coldest one, while oak and Douglas-fir
were intermediate (no data for the native forest). The highest
soil moisture content was observed in the oak site, followed
by spruce and beech, with lower soil moistures observed in the
Douglas-fir [4,34]. Thus, the oak and spruce stands were rela-
tively cold and humid, while the beech and Douglas fir stands
were warmer and drier [23]. The soil conditions at the first
sampling time in late February 2003 were the coldest and most
humid of all. Conditions were slightly drier and warmer in the
late November samplings. The second sampling in September
2003 occurred during extremely warm and dry conditions. The
effect of both soil temperature and moisture content was sig-
nificant, even though these factors were less discriminating for
community composition than tree species and time.
Wood decomposer diversity in forests 555
Cold or dry months could cause a reduction in species rich-
ness or fungal biomass. Such conditions would also favour
less competitive species allowing them to be detected in pro-
files. This was noted in the second sampling time in September
2003, which followed an extremely warm and dry summer pe-
riod. For that sampling time, species number was lower and the
structure was different from the general trend with some char-
acteristic species present only there. Such a seasonal variation,
if present at all, was dependent more on the site conditions
than on the tree species effect. The influence of environmen-
tal conditions could also change with the decay phase, being
greatest in the early stages [6]. On the contrary, the stand effect
was not significant even in the last sampling.
5. CONCLUSION
Each tree stand and sampling time had the characteristic
wood decomposer species community structure. There was no
strong decrease of microbial species number caused by change
of tree dominant but strong shift in community structure was
evident. In order to better understand the complex effect of tree
species change it is necessary to consider also other factors,
such as functional diversity, biodiversity of other organisms or
fungal groups, soil development or ecosystem function at the
landscape level. Thus more research is still needed in this field.
Acknowledgements: The authors thank the technician team of the
INRA “Biogéochimie des Écosystèmes Forestiers” Unit, in charge
of building the database of the site, Dominique Gelhaye, responsible
for the experimental site, and Séverine Bienaime, Pascal Bonnaud,
Louisette Gelhaye and Benoît Pollier for laboratory assistance. The
authors thank also GIP-Ecofor for providing subsidies for monitoring
the Breuil site experiment, the French Ministry of Research for sup-
porting the “Effet des substitutions d’essences et de l’augmentation
du CO
2
atmosphérique sur les communautés microbiennes inter-
venant dans le fonctionnement d’un écosystème forestier” project
coordinated by Dr Francis Martin (UMR Interactions Arbres Micro-
organismes), the Marie-Curie association (grant fellowship of Ari-
ana Kulhánková in 2004) and the Czech Science Foundation (grant
No. 206/03/H137). We are also very grateful to Marta Ruth and Keith
Edwards for the language corrections.
REFERENCES
[1] Anderson I.C., Cairney J.W.G., Diversity and ecology of soil fungal
communities: increased understanding through the application of
molecular techniques, Environ. Microbiol. 6 (2004) 769–779.
[2] Anderson I.C., Campbell C.D., Prosser J.I., Diversity of fungi in
organic soils under a moorland – Scots pine (Pinus sylvestris L.)
gradient, Environ. Microbiol. 5 (2003) 1121–1132.
[3] Aneja M.K., Sharma S., Munch J.C., Schloter M., RNA fingerprint-
ing – a new method to screen for differences in plant litter degrading
microbial communities, J. Microbiol. Meth. 59 (2004) 223–231.
[4] Aussenac G., Interactions between forest stands and microclimate:
Ecophysiological aspects and consequences for silviculture, Ann.
For. Sci. 57 (2000) 287–301.
[5] Bader P., Jansson S., Jonsson B.G., Wood-inhabiting fungi and sub-
stratum decline in selectively logged boreal spruce forests, Biol.
Conserv. 72 (1995) 355–362.
[6] Berg B., McClaugherty C., Plant litter – decomposition, humus for-
mation, carbon sequestration, Springer-Verlag, Berlin, 2003.
[7] Cox P., Wilkinson S.P., Anderson J.M., Effects of fungal inocula on
the decomposition of lignin and structural polysaccharides in Pinus
sylvestris litter, Biol. Fertil. Soils 33 (2001) 246–251.
[8] Fromin N., Hamelin J., Tarnawski S., Roesti D., Jourdain-Miserez
K., Forestier N., Teyssier-Cuvelle S., Gillet F., Aragno M., Rossi P.,
Statistical analysis of denaturing gel electrophoresis (DGE) finger-
printing patterns, Environ. Microbiol. 4 (2002) 634–643.
[9] Gardes M., Bruns T.D., ITS primers with enhanced specificity for
basidiomycetes: application to the identification of mycorrhizae and
rusts, Mol. Ecol. 2 (1993) 113–118.
[10] Griffiths B.S., Ritz K., Wheatley R., Kuan H.L., Boag B.,
Christensen S., Ekelund F., Sorensen S.J., Muller S., Bloem J., An
examination of the biodiversity-ecosystem function relationship in
arable soil microbial communities, Soil Biol. Biochem. 33 (2001)
1713–1722.
[11] Heilmann-Clausen J., Christensen M., Does size matter? On the
importance of various dead wood fractions for fungal diversity in
Danish beech forests, Forest Ecol. Manage. 201 (2004) 105–119.
[12] Heilmann-Clausen J., Christensen M., Wood-inhabiting macrofungi
in Danish beech-forests – conflicting diversity patterns and their im-
plications in a conservation perspective, Biol. Conserv. 122 (2005)
633–642.
[13] Heuer H., Smalla K., Application of denaturing gradient gel elec-
trophoresis and temperature gradient gel electrophoresis for study-
ing soil microbial communities, in: van Elsas J.D., Wellington
E.M.H., Trevors J.T. (Eds.), Modern Soil Microbiology, Marcel
Dekker, Inc., New York, 1997, pp. 353–373.
[14] Jasalavich C.A., Ostrofsky A., Jellison J., Detection and identifica-
tion of decay fungi in spruce wood by restriction fragment length
polymorphism analysis of amplified genes encoding rRNA, Appl.
Environ. Microbiol. 66 (2000) 4725–4734.
[15] Johannesson H., Stenlid J., Molecular identification of wood-
inhabiting fungi in an unmanaged Picea abies forest in Sweden,
Forest Ecol. Manage. 115 (1999) 203–211.
[16] Karén O., Hogberg N., Dalgberg A., Jonsson L., Nylund J.E., Inter-
and intraspecific variation in the ITS region of rDNA of ectomycor-
rhizal fungi in Fennoscandia as detected by endonuclease analysis,
New Phytol. 136 (1997) 313–325.
[17] Kruys N., Jonsson B.G., Fine woody debris is important for species
richness on logs in managed boreal spruce forests of northern
Sweden, Can. J. Forest Res. 29 (1999) 1295–1299.
[18] Lejon D.P.H., Ranger J., Chaussod R., Ranjard L., Effect of tree
species on the density and genetic structure of microbial communi-
ties in an acid forest soil (Morvan, France), Microb. Ecol. (in press).
[19] Lord N.S., Kaplan C.W., Shank P., Kitts C.L., Elrod S.L.,
Assessment of fungal diversity using terminal restriction fragment
(TRF) pattern analysis: comparison of 18S and ITS ribosomal re-
gions, FEMS Microbiol. Ecol. 42 (2002) 327–337.
[20] Muyzer G., DGGE/TGGE a method for identifying genes from nat-
ural ecosystems, Curr. Opin. Microbiol. 2 (1999) 317-322.
[21] Nordén B., Ryberg M., Gotmark F., Olausson B., Relative impor-
tance of coarse and fine woody debris for the diversity of wood-
inhabiting fungi in temperate broadleaf forests, Biol. Conserv. 117
(2004) 1–10.
[22] Osono T., Takeda H., Organic chemical and nutrient dynamics in
decomposing beech leaf litter in relation to fungal ingrowth and suc-
cession during 3-year decomposition processes in a cool temperate
deciduous forest in Japan, Ecol. Res. 16 (2001) 649–670.
556 A. Kulhánková et al.
[23] Ranger J., Andreux B.S.F., Berthelin B.P., Boudot J.P., Bréchet
C., Buée M., Calmet J.P., Chaussod R., Gelhaye D., Gelhaye L.,
Gérard F., Jaffrain J., Lejon D., Le Tacon F., Léveque J., Maurice
J.P., Merlet D., Moukoumi J., Munier-Lamy C., Nourrisson G.,
Pollier B., Ranjard L., Simonsson M., Turpault M.P., Vairelles
D., Zeller B., Effet des substitutions d’essence sur le fonction-
nement organo-minéral de l’écosystème forestier, sur les commu-
nautés microbiennes et sur la diversité des communautés fongiques
mycorhiziennes et saprophytes (cas du dispositif expérimental de
Breuil-Morvan). Final report of contract INRA-GIP Ecofor 2001-
24, N
◦
INRA 1502A, INRA BEF Nancy, Champenoux, 2004.
[24] Rodriguez A., Perestelo F., Carnicero A., Regalado V., Perez R., De
la Fuente G., Falcon M.A., Degradation of natural lignins and lig-
nocellulosic substrates by soil-inhabiting fungi imperfecti, FEMS
Microbiol. Ecol. 21 (1996) 213–219.
[25] Schmit J.P., Mueller G.M., Leacock P.R., Mata J.L., Wu Q., Huang
Y., Assessment of tree species richness as a surrogate for macrofun-
gal species richness, Biol. Conserv. 121 (2005) 99–110.
[26] Setala H., McLean M.A., Decomposition rate of organic sub-
strates in relation to the species diversity of soil saprophytic fungi,
Oecologia 139 (2004) 98–107.
[27] Setala H., Aarnio T., Vertical stratification and trophic interactions
among organisms of a soil decomposer food web – a field experi-
ment using 15N as a tool, Eur. J. Soil Biol. 38 (2002) 29–34.
[28] Taylor A.F.S., Fungal diversity in ectomycorrhizal communities:
sampling effort and species detection, Plant Soil 244 (2002) 19–28.
[29] Vainio E.J., Hantula J., Direct analysis of wood-inhabiting fungi us-
ing denaturing gradient gel electrophoresis of amplified ribosomal
DNA, Mycol. Res. 104 (2000) 927–936.
[30] Van Elsas J.D., Duarte G.F., Keijzer-Wolters A., Smit E., Analysis
of the dynamics of fungal communities in soil via fungal-specific
PCR of soil DNA followed by denaturing gradient gel electrophore-
sis, J. Microbiol. Meth. 43 (2000) 133–151.
[31] Virzo De Santo A., Rutigliano F.A., Berg B., Fioretto A., Puppi G.,
Alfani A., Fungal mycelium and decomposition of needle litter in
three contrasting coniferous forests, Acta Oecol. 23 (2002) 247–
259.
[32] White T.J., Bruns T.D., Lee S.B., Taylor J.W., Amplification and
direct sequencing of fungal ribosomal RNA Genes for phyloge-
netics, in: Innis N., Gelfand D., Sninsky J., White T. (Eds.), PCR
– Protocols and Applications – A Laboratory Manual, Academic
Press, New York, 1990, pp. 315–322.
[33] Wilkinson S.C., Anderson J.M., Scardelis S.P., Tisiafouli M., Taylor
A., Wolters V., PLFA profiles of microbial communities in decom-
posing conifer litters subject to moisture stress, Soil Biol. Biochem.
34 (2002) 189–200.
[34] Yang Y.S., Chen G.S., Guo J.F., Lin P., Decomposition dynamic
of fine roots in a mixed forest of Cunninghamia lanceolata and
Tsoogiodendron odorum in mid-subtropics, Ann. For. Sci. 61
(2004) 65–72.
To access this journal online:
www.edpsciences.org