Báo cáo lâm nghiệp: "Variation in wood properties among five full-sib families of Norway spruce (Picea abies)" ppt
Bạn đang xem bản rút gọn của tài liệu. Xem và tải ngay bản đầy đủ của tài liệu tại đây (342.09 KB, 8 trang )
Ann. For. Sci. 64 (2007) 799–806 Available online at:
c
INRA, EDP Sciences, 2007 www.afs-journal.org
DOI: 10.1051/forest:2007062
Original article
Variation in wood properties among five full-sib families of Norway
spruce (Picea abies)
Arne Steffenrem
a
*
, Pekka S
aranp
¨
a
¨
a
b
, Sven-Olof Lundqvist
c
,ToreSkrøppa
a
a
The Norwegian Forest and Landscape Institute, PO Box 115, 1431 Ås, Norway
b
Finnish Forest Research Intstitute, PO Box 18, 01301 Vantaa, Finland
c
STFI-Packforsk, PO Box 5604, 114 86 Stockholm, Sweden
(Received 27 November 2006; accepted 11 May 2007)
Abstract – Genetic- and environmental variation and correlation patterns were characterized for modulus of elasticity (MOE), modulus of rupture
(MOR) and related wood traits: latewood proportion, wood density, spiral grain, microfibril angle and lignin content in five full-sib families of Norway
spruce. The families were evaluated on the basis of clearwood specimens from the juvenile -mature wood transition zone of 93 sampled trees at age
30 year from seed. Family-means varied significantly (p < 0.05) for all wood traits studied except lignin content. MOE varied between 7.9–14.1 GPa
among trees and 9.4–11.0 GPa among families. MOR varied between 47–87 MPa among trees and 61–71 MPa among families. Families remained
significantly different in an analysis of specific MOE (MOE/density) and MOR (MOR/density). Hence, solely relying on wood density as a wood
quality trait in tree breeding would not fully yield the potential genetic gain for MOE and MOR. Correlations between wood structural traits and
specific MOE and MOR are presented and discussed.
genetic variation / wood quality / modulus of elasticity / modulus of rupture / tree improvement
Résumé – Variabilité des propriétés du bois pour cinq familles de pleins-frères d’épicéa commun (Picea abies). La variabilité génétique et
environnementale pour le module d’élasticité (MOE), le module de rupture (MOR) et certaines autres propriétés de base du bois (proportion de bois
final, densité du bois, angle du fil, angle des microfibrilles et teneur en lignine) ont été étudiées au sein de cinq familles de pleins-frères d’épicéa
commun ainsi que la liaison entre caractères. L’analyse a été réalisée à partir d’échantillons sans défaut issus de la zone de transition entre bois juvenile
et bois mature de 93 arbres âgés de 30 ans (depuis la graine). Des différences significatives (p < 0.05) entre familles ont été observées pour tous les
caractères sauf pour la teneur en lignine. Les valeurs de MOE variaient entre 7.9–14.1 GPa entre arbres et entre 9.4–11.0 GPa entre familles. Pour
MOR, ces valeurs s’échelonnaient entre 47–87 MPa entre arbres et entre 61–71 MPa entre familles. Les différences entre familles pour MOE et MOR
sont restées significatives après normalisation pour la densité du bois. Il est noté que l’utilisation seule de la densité du bois comme critère de sélection
ne permettrait pas d’obtenir les gains génétiques potentiels escomptés d’une sélection directe pour MOE et MOR. Les corrélations entre propriétés de
base du bois et les valeurs normalisées de MOE et MOR sont présentées et discutées.
variabilité génétique / propriétés du bois / module d’élasticité / module de rupture / amélioration génétique
1. INTRODUCTION
The versatility of the wood and its large geographic dis-
tribution makes Norway spruce (Picea abies (L.) Karst.) a
widely used tree species in the European forest industry. It
is utilized in a vast number of products including load car-
rying constructions, panelling, furniture, paper and other fiber
products. Many end-uses require that forest production yields
wood of good mechanical properties expressed in stiffness,
strength and dimensional stability. Since the required rate of
return from investments calls for fast growth and short rota-
tions, this can be in conflict with interests in high quality.
Tree breeding programs aim to provide forestry with genet-
ically improved reproductive materials. The programs, which
traditionally have focused on climatic adaptation and vol-
ume production, could in addition emphasize on wood qual-
ity traits. This, however, requires knowledge about the genetic
* Corresponding author: arne.steff
variation in these traits and the genetic correlations among the
traits.
Mechanical stiffness and strength of wood must be consid-
ered as composite traits that depend on physical, chemical and
anatomical properties of wood. Consequently, genetic varia-
tion in such properties can theoretically be related to the basic
factors causing genetic variation in stiffness and strength.
According to many reports, wood density is the most im-
portant trait controlling wood stiffness and strength (summa-
rized in [50]). It has a strong and positive correlation with both
tensile- and compression strength (summarized in [20]) but
wood density is only moderately correlated with wood stiff-
ness. This is particular the case with juvenile wood [2]. In ad-
dition, the orientation of the cellulose microfibrils in the S2
layer of the cell wall (MfA), has been shown to be an important
trait characterizing wood stiffness in softwoods [2,4, 7, 9,29].
The effect of MfA seems to be considerable on tensile elas-
ticity and strength [38] while its effect is less important on
Article published by EDP Sciences and available at or />800 A. Steffenrem et al.
compression strength [11]. The effect of spiral grain on stiff-
ness and strength is reported to be considerable when grain
angles of mature wood exceed 3
◦
in spruce [31, 49]. Spiral
grain is more important for tensile- than compression strength
(summarized in [20]). Lignin is an important cell wall com-
pound but its effect on strength and stiffness is hardly ever re-
ported in literature. Gindl and Teischinger [11] reported of a
weak positive correlation with compression strength.
Density is the most frequently studied wood quality trait in
genetic studies of Norway spruce. Previous studies show that
its heritability is intermediate to high and that genotype by en-
vironment interaction is low [3,13]. Unfortunately, the genetic
correlation with growth rate is reported to be negative [18], im-
plying that selection for growth rate could reduce wood den-
sity in the long run. Little is known about genetic variation in
MfA and its correlations with growth rate in Norway spruce,
but Hannrup et al. [13] found intermediate broad sense heri-
tability values and no genetic correlations with growth. Heri-
tability for spiral grain in Norway and Sitka spruce has been
reported to be intermediate to high, the genotype by environ-
ment interaction low, and the genetic correlation with growth
weak [3, 13–16]. Lignin content is summarized to be under
strong genetic control, although the range of variation is small
[50].
Hannrup et al. [13] studied how the joint effects of several
wood quality traits add up to wood stiffness when they esti-
mated low broad sense heritability values for wood stiffness
in clones of Norway spruce. This is in contradiction to reports
of intermediate to high narrow sense [23,24] and high broad
sense heritability [28] reported for radiata pine (Pinus radi-
ata).
Forest tree improvement based on artificial selection meth-
ods rely on the existing genetic variation to achieve genetic
gain. However, the knowledge regarding genetic variation
within natural stands of Norway spruce is very limited for
traits affecting wood quality. In addition, knowledge about
how wood quality traits correlate genetically with each other
and with growth rate is scarce and sometimes contradicting.
Hence, the on-going selection for growth traits might cause
unintentional adverse effects on wood quality. The aim of this
study was to characterize the genetic variation and correlation
patterns for clearwood modulus of elasticity (MOE) and rup-
ture (MOR) among offspring from a natural Norway spruce
stand grown in a long term progeny test.
2. MATERIALS AND METHODS
Controlled crosses were performed in the spring of 1973 in a nat-
ural stand of Norway spruce at Veldre in Ringsaker, (61
◦
00’ N, 11
◦
00’ E, at 500 m elevation) in southern Norway. Pollen was collected
from ten randomly selected trees with both male and female flowers
standing at least 50 m apart, and controlled pollinations were made
with all pollen lots on female flowers on the same ten trees. This com-
plete diallel mating included reciprocal crosses and self-pollinations
[10]. In addition, open pollinated seed was collected from the selected
trees. A detailed description of the stand and the crossing procedures
is given by Skrøppa and Tho [44].
Table I. Traits investigated with abbreviations used in text, units of
measurement and total number of observations.
Trait Abbreviation Unit N
Tree height Height m 93
Diameter at breast height DBH cm 93
Average ring width RW mm 92
Latewood proportion LWP % 92
Wood density at 12% RH Density kg m
−3
93
Spiral grain angle Spiral grain degrees 85
Microfibril angle MfA degrees 93
Lignin proportion Lignin % 93
Modulus of elasticity MOE GPa 93
Modulus of rupture MOR MPa 87
The seed lots were sown and germinated in the spring of 1974.
In 1976, two years from seed, a half diallel of 45 full-sib families
was planted together with 10 open pollinated families and three con-
trol seed lots in a long term progeny trial at Bjugstad in Gjøvik (60
◦
50’ N, 10
◦
40’ E, at 350 m elevation). Each family was replicated in
12 blocks. Randomly within each block, each family was planted in a
square four-tree plot. This design is a randomized complete block ex-
periment (summarized in [30]). Each block contained 232 trees and
with a 2.0 m spacing the size of the blocks were nearly 1/10 of ha.
The trial has not been subject to any thinning, fertilizing or pruning
until 2001 when some trees from the open pollinated families were
sampled for a genetic study of branching traits (unpublished master
thesis).
Five genetically independent full-sib families located next to the
diagonal in the mating design were selected in 2003. From these fami-
lies intermediate or co-dominant trees that had no visible major dam-
ages or rot, and were not edge trees of large gaps, were sampled.
Thus, the sampling was not completely random. In addition to ∼ 5%
mortality and edge effects, the sampling restrictions made it impos-
sible to sample all five families from all blocks. This imbalance was
controlled by dividing the trial into three sampling units based on tree
height. Each unit of four blocks is aimed to be as homogenous as pos-
sible in respect to site quality. Five to seven trees from each family
were randomly selected within each sampling unit.
The trees were felled, and tree height and diameter at breast height
(DBH) were recorded. Two succeeding internodes were collected be-
tween 2 and 3 m above ground. This sampling height was chosen to
avoid basal sweep and thereby reaction wood. The upper internode
collected was analysed in this study. A number of traits were mea-
sured and an overview of the traits and their abbreviations are given
in Table I. Some of the samples were too damaged after the destruc-
tive MOR test to measure spiral grain. Therefore the sample size is
lower for this trait.
Boards, sized 20 × 20 × 340 mm, were sawn from the transition
between juvenile and mature wood on the north facing side of stem.
One board was studied per log. The exact radial position of each sam-
ple was described as the distance and number of rings from the pith.
The moisture content of the samples was stabilised at 12% relative
moisture content by storing them at 20
◦
C and 65% relative humidity
for a minimum of two weeks. The dimensions of the samples were
measured with a digital caliper and their weights were determined in
order to obtain the weight density values (ρ12). Longitudinal MOE
and MOR were determined by a four-point bending test [21] accord-
ing to Saranpää and Repola [40]. Load was applied in the tangential
direction with a modified Lloyd universal testing machine (England).
Variation in wood properties of spruce 801
Six boards had internodal branches that were considered to affect
MOR. These boards were removed from the material. Specific MOE
and MOR were calculated as MOE/density and MOR/density respec-
tively.
Lignin content was estimated by Fourier transform infrared
(FTIR) spectroscopy [34]. Principal component regression (PCR)
models were built for predicting the relative amount of lignin in wood
analysed with the FTIR spectroscopy. The method was calibrated
with the total lignin amounts determined with the Klason method [6].
The calibrated model was tested with an independent estimation data
set. The model was then applied for predicting of lignin content in
the samples in our material that can be regarded as very similar to
those in the estimation data. Lignin content was determined on sec-
tions representing wood from pith to bark on the south facing side of
stem.
After MOE and MOR testing, a 12 mm piece of wood was sawn
as close to the fracture as possible and MfA was measured by the
X-ray diffractiometry method implemented in the SilviScan-3 [8] at
STFI-Packforsk in Sweden.
The reflected light intensity method implemented in WinDendro
[37] was used to asses ring width (RW) and latewood proportion
(LWP) on the radial surface of the boards. The demarcation be-
tween earlywood and latewood in each ring was set to be the point
where light intensity was 30% of the difference between the mini-
mum and maximum within ring light intensity. This demarcation cri-
terion would resemble the 2/3rd of maximum-minimum wood density
threshold often used for Norway spruce [19].
The grain angle (spiral grain) was measured by pulling a needle
attached to an arm along the pith- and bark facing side of the boards.
The needle followed the grain and left a track in the wood. The angle
of this track relative to the longitudinal direction of the boards was
measured by a protractor in degrees. The mean of the pith- and bark
facing readings was used in the analysis.
Data analysis
The analyses of growth traits are here based on measurements only
on sampled trees. The family-mean correlation between the height of
all trees in trial and sampled trees was 0.96, which indicate that the
families were well represented by the sampled trees.
Analyses of variance and covariance were performed for all traits,
including specific MOE and MOR, based on the type III sum of
squares in SAS PROC GLM [43]. The coefficient of variation (CV)
was calculated as (
√
MS
E
/y) ·100. Since wood properties are known
to vary rapidly with increasing distance from pith in the juvenile
wood of conifers [1,5,22], distance from pith to the location of the ex-
tracted boards was treated as a covariate in all analysis of RW, LWP,
density, spiral grain, MfA, MOE and MOR. Total mean, p-value and
CV are reported.
General mixed models for analysis of variance and covariance
used were,
y
ijn
= μ + α
i
+ γ
j
+ βX
ijn
+ αγ
ij
+ ε
ijn
(1)
where, y
ijn
is the observation on the sample from tree n in family i in
block j. μ is the total mean, α
i
is the fixed effect of family i, γ
j
is the
random effect of the blocks, βX
ijn
is the covariate term of which X is
the observed distance from pith for the sample from tree n in family i
in block j, αγ
ij
is the random interaction between family i and block
j and ε
ijn
is the random residual. The random terms are assumed to
Table II. Total means, p-values, and coefficient of variation (CV)
from the analysis of variance and covariance. Covariate (distance to
pith) indicated by “–” was not analysed for respective trait. Effects
significantly different from 0 (p 0.05) is indicated in bold types.
Model terms
Trait Mean Distance Family Block Family × Block CV
Height 12.7 – < 0. 001 0.002 0.007 5.8
DBH 14.3 – 0.13 0.04 < 0.001 9.5
RW 3.2 0.09 0.76 0. 03 0.19 16.0
LWP 29.0 0.73 0.02 0.06 0.36 15.2
Density 410 0.19 0.02 < 0. 001 0.43 6.5
Spiral grain 1.0 0.90 0.004 0.69 0.02 69.9
MfA 11.2 0.51 0.05 0.88 0.71 21.7
Lignin 25.5 – 0.12 0.55 0.002 2.1
MOE 10.3 0.19 0.003 0.005 0.46 10.1
MOE/density 0.025 0.72 0.009 0.83 0.41 8.1
MOR 66.7 0.55 0.002 0.004 0.38 9.6
MOR/density 0.16 0.47 < 0.001 0.30 0.78 5.4
have expectation equal zero and respective variances. The covariate
term was not included in the model when analyzing height, DBH and
lignin content. There was no difference whether distance to pith was
measured in metric units or as ring number from pith. Therefore only
the metric distance is used. Since more than one tree could have been
sampled from each family in the same block, the αγ
ij
estimates the
plot effect. The plot effect was not significant for any of the wood
quality traits investigated.
Least-squares means (LS-means) for families and best linear un-
biased predictior (BLUP) [17] for blocks were computed according
to the mixed model (1) in SAS PROC MIXED [43]. Phenotypic-,
family-mean- and environmental correlations where then estimated
by computing Pearson correlation coefficients based on phenotypic
values, LS-means and BLUP values, respectively, in SAS PROC
CORR [43].
3. RESULTS
The estimated production potential varied from 11 to 15 m
3
ha
−1
y
−1
[47] among blocks. This affected height and DBH
with significant variation among blocks (p < 0.05) (Tab. II).
There were significant differences among families for height
(p < 0.001) but not for DBH (p = 0.13) and the most vigor-
ously growing family had 10% higher height than the average
of all families. Family by block interaction (plot effects) was
significant for both traits (p < 0.01).
The variation in the radial distance from clearwood speci-
men to pith did not prove to be a significant regressor for any
of the traits analysed (p > 0.05) (Tab. II).
Significant differences among families (p < 0.05) were
found for LWP, density, spiral grain and MfA but not for RW
and lignin content (Tab. II). Significant variation among blocks
were found for RW and density (p < 0.05) and almost for LWP
(p = 0.06). Of the traits showing significant family variation,
only spiral grain had a significant plot effect.
The CVs for the majority of the traits varied between 2
and 22% (Tab. II). However, the CV for spiral grain was high
(∼ 70%) indicating a very high experimental error.
802 A. Steffenrem et al.
Density (kg m
-3
)
350 375 400 425 450 475 500 525
MOR (G P a)
40
50
60
70
80
90
Density (kg m
-3
)
350 375 400 425 450 475 500 525
MOE (G P a)
6
8
10
12
14
RW (mm)
12345
Density (kg m
-3
)
350
375
400
425
450
475
500
525
LWP (%)
15 20 25 30 35 40 45
Density (kg m
-3
)
350
375
400
425
450
475
500
525
r
i
= 73*
r
f
= 21
r
b
= 93*
r
i
= .50*
r
f
= .18
r
b
= .48
r
i
= .91*
r
f
= .76
r
b
= .98*
r
i
= .74*
r
f
= .59
r
b
= .94*
)b)a
)d)c
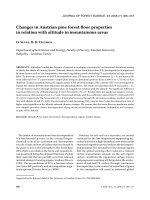
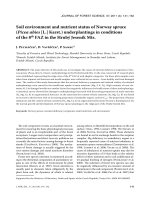
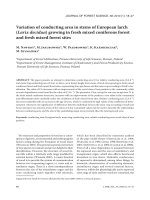
Figure 1. The relationship between (a) RW and density, (b) LWP and density, (c) density and MOE and (d) density and MOR on three levels:
individual tree (.), family mean (•) and block mean (◦). Pearson correlation coefficients for individual tree (r
i
), family-mean (r
f
) and block-
mean (r
b
) correlations are shown. Coefficients marked with * are significantly different from 0 (p ≤ 0.05). A family that broke with several
correlations is indicated (
).
There were highly significant differences among families
for MOE and MOR (p < 0.01) (Tab. II). There were also sig-
nificant variation among blocks (p < 0.01) but no significant
plot effect existed (p ≈ 0.4). The family variation remained
significant when the analysis was performed on specific MOE
and MOR (p < 0.01). The variation due to blocks did, how-
ever, vanish completely (p > 0.3) and the CVs were reduced
by 2% points for MOE and nearly 5% points for MOR.
Correlations
Relationships among traits are presented on three levels in
Figure 1. These levels are: individual tree, family-mean and
block-mean level. Since no variation among blocks was found
for specific MOE and MOR, no block means based on BLUP
could be estimated. Hence, the analysis of relationships be-
tween wood structural traits and specific MOE and MOR are
based on individual tree and family-mean level correlations
(Figs. 2 and 3).
The negative individual tree correlation between RW and
density (r
i
= −0.73) had its parallel in the very strong and neg-
ative block-mean correlation (r
b
= −0.93) (Fig. 1a). The corre-
lations between LWP and density were positive but somewhat
weaker than what was the case for RW (Fig. 1b). The block-
mean correlation (r
b
= 0.48) was on the same magnitude as
the individual tree correlation (r
i
= 0.50). The family-mean
correlations for RW and LWP with density were weaker the
but showed the same sign (r
f
= −0.21 and r
f
= 0.18, respec-
tively).
The individual tree correlation between density and MOE
was moderate (r
i
= 0.74, Fig. 1c) compared to the very strong
correlation between density and MOR (r
i
= 0.91, Fig. 1d).
The block-mean correlations were very strong in both cases
(r
b
> 0.94). The family-mean correlations were in general
weaker since one family in particular broke with this relation-
ship (0.59 < r
i
< 0.76). This family is indicated in all figures.
There were strong correlations between MOE and MOR for
individual trees (r
i
= 0.89), family-means (r
f
= 0.94) and
block-means (r
b
= 0.94) (data not shown).
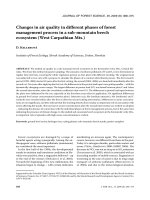
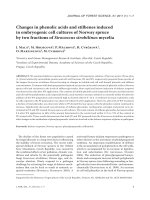
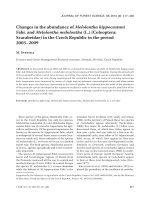
Weak, but significant (p 0.05) and negative individual
tree correlations were found for specific MOE with MfA and
lignin (Figs. 2b and 2c), and for specific MOR with LWP and
lignin (Figs. 3a and 3c). The family-mean correlations were
not significant (p > 0.05) and in some cases contradicting the
individual tree correlations in respect to the sign. The corre-
lation between MfA and specific MOE (and MOR), e.g., was
negative on individual tree level but positive on family mean
level.
Spiral grain was negatively correlated with both specific
MOE and MOR on individual tree level (Figs. 2d and 3d, re-
spectively), but the correlation was weak and not significant
(p ≈ 0.25). The family-mean correlations were, however, very
strong (r
f
> −0.93) and significant (p 0.05).
4. DISCUSSION
The variations in wood quality traits within a stand of Nor-
way spruce would be due to both environmental and genetic
origin. The results clearly show that there exists significant
Variation in wood properties of spruce 803
Spiral grain ( )
-2 -1 0 1 2 3 4
MOE / Density
0.018
0.020
0.022
0.024
0.026
0.028
0.030
0.032
Lignin (%)
23 24 25 26 27 28
MOE / Density
0.018
0.020
0.022
0.024
0.026
0.028
0.030
0.032
LWP (%)
15 20 25 30 35 40 45
MOE / Dens ity
0.018
0.020
0.022
0.024
0.026
0.028
0.030
0.032
MfA ( )
6 8 10 12 14 16 18 20 22
MOE / Density
0.018
0.020
0.022
0.024
0.026
0.028
0.030
0.032
r
i
= .06
r
f
= .78
r
i
= 32*
r
f
= .27
r
i
= 13
r
f
= 93*
r
i
= 34*
r
f
= 34
)b)a
)d)c
°
°
Figure 2. The relationship between specific MOE (MOE/density) and (a) LWP, (b) MfA, (c) lignin and (d) spiral grain on individual tree level
(.) and family mean level (•). Pearson correlation coefficients for individual tree (r
i
) and family mean (r
f
) correlations are shown. Coefficients
marked with * is significantly different from 0 (p 0.05). A family that broke with several correlations is indicated (
).
Spiral grain (
°
)
-2 -1 0 1 2 3 4
MOR / Dens ity
0.12
0.13
0.14
0.15
0.16
0.17
0.18
0.19
Lignin (%)
23 24 25 26 27 28
MOR / Dens ity
0.12
0.13
0.14
0.15
0.16
0.17
0.18
0.19
LWP (%)
15 20 25 30 35 40 45
MOR / Density
0.12
0.13
0.14
0.15
0.16
0.17
0.18
0.19
MfA ( )
6 8 10 12 14 16 18 20 22
MOR / Density
0.12
0.13
0.14
0.15
0.16
0.17
0.18
0.19
r
i
= .32*
r
f
= .80
r
i
= 19
r
f
= .47
r
i
= 16
r
f
= 97*
r
i
= 24*
r
f
= 45
)b)a
)d)c
°
Figure 3. The relationship between specific MOR (MOR/density) and a) LWP, b) MfA, c) lignin and d) spiral grain on individual tree level
(.) and family mean level (•). Pearson correlation coefficients for individual tree (r
i
) and family mean (r
f
) correlations are shown. Coefficients
marked with * is significantly different from 0 (p 0.05). A family that broke with several correlations is indicated (
).
804 A. Steffenrem et al.
environmental and genetic variation for clearwood MOE and
MOR in progenies from a natural stand of Norway spruce.
The relationships between density and MOE and MOR are
well known [20]. Since the dependency of density on the me-
chanical properties of wood often is regarded to be functional,
normalization by dividing with sample density is often used
(e.g. [9,29]). However, the family variation persists even when
the normalized traits, specific MOE and MOR, were analyzed.
Hence, genetic variation in traits correlated with MOE and
MOR, other than density, is likely to contribute to the observed
genetic variation in MOE and MOR.
The genetic variation found for wood traits is supported
by earlier reports of significant genetic variation in Norway
spruce for LWP [13,18], wood density [3,13,18], spiral grain
[3, 13] and MfA [13]. The low variation found for lignin con-
tent is supported by earlier results from trials with sexually
reproduced families of Norway spruce [13], but contradict-
ing the high broad sense heritabilities obtained from clones
[13]. The latter study does also discuss whether the inheritance
could predominantly be non-additive which would explain the
contradicting results obtained from families and clones. In ad-
dition, results from eucalyptus (Eucalyptus globulus) [33] in-
dicate that the degree of genetic control might be different for
different types of lignin.
After 27 years in field there were significant family differ-
ences in height but not in DBH. DBH and RW were only in-
termediately correlated (r
i
= 0.60, data not shown). RW was
measured on the boards and since these only represent a part
of the diameter RW can only indirectly be seen as a growth
parameter in this study.
4.1. Correlations
Correlations based on the measured values on individual
trees, phenotypic correlations, include all genetic and environ-
mental variation [48]. The block-mean correlations based on
BLUP are environmental correlations caused by differences
between blocks in factors such as growth conditions and com-
petition. Family-mean correlations based on LS-means are ad-
justed for the imbalanced sampling of families across blocks.
It is however not fully a genetic correlation and caution must
be taken when drawing conclusions based on a material with
only five families.
Wood density is a physical property that is directly re-
lated to tracheid width, tracheid wall thickness and the wall-
to-lumen ratio of the tracheids [36]. These characteristics are
again closely related to radial growth (RW) since the propor-
tion of latewood (LWP) tends to decrease with increasing ring
width (RW) [32,39]. The phenotypic correlation between RW
and LWP were only intermediate (r
i
= −0.42, data not shown)
and density correlated stronger with RW (Fig. 1a) than with
LWP (Fig. 1b). It could be discussed if the light intensity
method used in WinDendro [37] could introduce some experi-
mental error which makes correlations with LWP vague in this
material.
The results support that density has large impact on MOE
(Fig. 1c) and MOR (Fig. 1d). The relatively stronger influence
of density on MOR compared to MOE is supported by e.g.
Saranpää and Repola [40] and Raiskila et al. [35]. The envi-
ronmental correlation between RW and density is very strong
(r
b
= −0.93) and so is the correlations between density and
bothMOEandMOR(r
b
> 0.94). Hence, the environmental
variation found for MOE and MOR can be attributed to the
effect environment has on diameter growth and consequently
wood density. This conclusion is supported by the results of
the analysis of variance; the significant variation among blocks
for MOE and MOR vanished when analyzing specific MOE
and MOR.
There seems to be some negative impact of MfA on spe-
cific MOE (Fig. 2b) and MOR (Fig. 3b) even if it is less sig-
nificant in comparison to the findings in loblolly and radiata
pine [4, 29]. However, the observed MfA values, with a mean
of 11
◦
and a variation from 8
◦
to 20
◦
, indicates that the ma-
jority of wood measured has reached maturity in respect to
MfA [26, 41, 42]. The boards were extracted between ring 4
and cambium, which varied to be 13–21 rings from pith. This
is in the transition zone between juvenile and mature wood in
Norway spruce [5, 22], or in the zones of juvenile corewood
and juvenile transition wood according to Burdon et al. [1].
The maturity of the wood measured could partly explain the
weak correlations with MOE, since also the reports from radi-
ata pine indicate that MfA is more important in juvenile wood
[4]. No phenotypic correlation between MfA and RW or den-
sity existed (data not shown) and since there were no effect of
blocks in the analysis of variance (Tab. II), it can be concluded
that the growth rate and site quality variation observed among
blocks has no or very limited effect on MfA.
It is difficult to find support for the observed negative
phenotypic correlation between lignin and specific MOE and
MOR (Figs. 2d and 3d, respectively) in the literature. The con-
trary was reported by Gindl and Teischinger [11] when they
found a weak, but significant, positive relationship between
compression strength and lignin content. Since the cell struc-
ture in earlywood contains higher proportions of lignin-rich
middle lamella than latewood (summarized in [20]), the effect
of lignin on MOE and MOR could be confounded with other
correlated traits such as RW, LWP and density.
There is one family that in some cases weakens and in other
cases strengthens the family-mean correlations compared to
the phenotypic and environmental correlations. This family
is indicated in Figures 1–3. This particular family has lower
MOE and MOR than what would be expected in relation
to its density (Figs. 1c and 1d). The family has lower LWP
(Fig. 1b) than the rest, but most striking is the higher spi-
ral grain (Figs. 2d and 3d). The scatter plots (Figs. 2d and
3d) show that this family is relatively alone about causing the
strong negative relationship between spiral grain and specific
MOE and MOR on family-mean level. Increased spiral grain
is expected to reduce MOE and MOR [20]. But the limited
number of families and the low spiral grain values observed
do not allow for any definite conclusions.
Mild compression wood is likely to occur to some extent
in wood samples extracted near the juvenile wood in Norway
spruce. Compression wood is known to contain more lignin,
have higher density and MfA and have lower MOE and MOR
Variation in wood properties of spruce 805
than normal wood [46]. Since the highest MfA values ob-
served in this material is lower than 20˚ it is unlikely that com-
pression wood had strong influence on the results.
4.2. Implications for br eeding
The ten parent trees in the diallel mating design were se-
lected to sample the genetic variation in a natural stand of
Norway spruce in this region of Norway. This survey had to be
limited to a subset of the families in the half diallel planted at
Bjugstad. The five families analysed here is the highest num-
ber of genetically independent families among the 45 families
and can not fully represent the total genetic variation in the
natural stand. Nevertheless, our results show that wood density
alone might not be sufficient as a wood quality selection cri-
terion in a tree improvement program. Wood density is corre-
lated with stiffness and strength, but this trait could notexplain
all the variation observed among families. This suggests that
other traits, such as spiral grain, MfA and lignin content, could
cause genetic variation in MOE and MOR. Hence, implemen-
tation of wood quality traits in breeding programs for Nor-
way spruce should not alone rely on density measurements.
Improvement of spiral grain and MfA is in addition likely to
have a positive effect on shape stability in lumber from Nor-
way spruce [45].
Clearwood MOE and MOR are direct measurements of
wood quality traits that are important for the utilization of
wood in load carrying constructions. The strong correlations
found between MOE and MOR, both on individual tree level
and family-mean level, suggest that they can be treated as the
same trait in practical tree breeding. By direct measurements
of wood stiffness or MOE on standing trees in field [12,25,27],
selection for improved wood strength would be possible inde-
pendently of whether the variation is caused by wood density
or other underlying traits. Differences were found among fam-
ilies within a natural stand of Norway spruce, indicating that
there is genetic variation present that can be utilized to im-
prove the future wood quality by the means of tree breeding.
Acknowledgements: This study was supported by a grant from the
Nordic Forest Research Co-operation Committee. The diallel exper-
iment was initially established by Jon Dietrichson. We would like to
thank: Björn Hannrup for initiating and leading the project; Tapio
Järvinen, Tapio Nevalainen and Kari Sauvala for sample prepara-
tion and determing MOE and MOR; Irmeli Luovula for analysing the
FTIR samples; Åke Hansson and Örjan Hedenberg for preparing and
analysing the samples on SilviScan-3; Christian Kierulf for collecting
the samples in field; the forest owner, Hans Bjugstad for all coopera-
tion; Øystein Johnsen for comments and feedback on manuscript.
REFERENCES
[1] Burdon R.D., Kibblewhite R.P., Walker J.C.F., Megraw R.A., Evans
R., Cown D.J., Juvenile versus mature wood: A new concept, or-
thogonal to corewood versus outerwood, with special reference to
Pinus radiata and P. t a e d a, For. Sci. 50 (2004) 399–415.
[2] Cave I.D., Walker J.C.F., Stiffness of wood in fast-grown planta-
tion softwoods – The influence of microfibril angle, For. Prod. J. 44
(1994) 43–48.
[3] Costa e Silva J., Borralho N.M.G., Wellendorf H., Genetic param-
eter estimates for diameter growth, pilodyn penetration and spiral
grain in Picea abies (L.) Karst, Silvae Genet. 49 (2000) 29–36.
[4] Cown D.J., Hébert J., Ball R., Modelling radiata pine lumber char-
acteristics. Part 1: Mechanical properties of small clears, N.Z. J. For.
Sci. 29 (1999) 203–213.
[5] Danborg F., Juvenile wood in Norway and sitka spruce. Anotomy,
density, drying properties, visual grading and strength proper-
ties, Forskningsserien nr. 18-1996, Forskningscenteret for Skov &
Landskap, Hørsholm, 1996, 1996, pp. 1–40.
[6] Dence C.W., The Determination of lignin, in: Lin S.Y., Dence C.W.
(Eds.), Methods in Lignin Chemistry, Springer-Verlag, Heidelberg,
1992, pp. 33–61.
[7] Downes G.M., Nyakuengama J.G., Evans R., Northway R.,
Blakemore P., Dickson R.L., Lausberg M., Relationship between
wood density, microfibril angle and stiffness in thinned and fertil-
ized Pinus radiata, Iawa J. 23 (2002) 253–265.
[8] Evans R., A variance approach to the X-ray diffractometric estima-
tion of microfibril angle in wood, Appita J. 52 (1999) 283–289, 294.
[9] Evans R., Ilic J., Rapid prediction of wood stiffness from microfib-
ril, angle and density, For. Prod. J. 51 (2001) 53–57.
[10] Fins L., Friedman S.T., Brotschol J.V., Handbook of quantitative
forest genetics, Kluwer Academic Publishers, London, 1992.
[11] Gindl W., Teischinger A., Axial compression strength of Norway
spruce related to structural variability and lignin content, Compos.
Part A - Appl. Sci. Manuf. 33 (2002) 1623–1628.
[12] Grabianowski M., Manley B., Walker J.C.F., Acoustic measure-
ments on standing trees, logs and green lumber, Wood Sci. Technol.
40 (2006) 205–216.
[13] Hannrup B., Cahalan C., Chantre G., Grabner M., Karlsson B., Le
Bayon I., Jones G.L., Müller U., Pereira H., Rodrigues J.C., Rosner
S., Rozenberg P., Wilhelmsson L., Wimmer R., Genetic parameters
of growth and wood quality traits in Picea abies, Scand. J. Forest
Res. 19 (2004) 14–29.
[14] Hannrup B., Grabner M., Karlsson B., Müller U., Rosner S.,
Wilhelmsson L., Wimmer R., Genetic parameters for spiral-grain
angle in two 19-year-old clonal Norway spruce trials, Ann. For. Sci.
59 (2002) 551–556.
[15] Hansen J.K., Roulund H., Genetic parameters for spiral grain, stem
form, pilodyn and growth in 13 years old clones of Sitka spruce
(Picea sitchensis (Bong.) Carr.), Silvae Genet. 46 (1997) 107–113.
[16] Hansen J.K., Roulund H., Genetic parameters for spiral grain in two
18-year-old progeny trials with Sitka spruce in Denmark, Can. J.
For. Res. 28 (1998) 920–931.
[17] Henderson C.R., Selection index and expected genetic advance, in:
Hanson W.D., Robinson H.F. (Eds.), Statistical genetics and plant
breeding, National Academy of Sciences and National Research
Council, Publ. No. 982, Washington, DC, 1963, pp. 141–163.
[18] Hylen G., Genetic variation of wood density and its relationship
with growth traits in young Norway spruce, Silvae Genet. 46 (1997)
55–60.
[19] Hylen G., Age trends in genetic parameters of wood density in
young Norway spruce, Can. J. For. Res. 29 (1999) 135–143.
[20] Kollmann F.F.P., Côté Jr. W.A., Principles of wood science and tech-
nology. I. Solid wood, Springer-Verlag, Berlin, 1968.
[21] Ku
ˇ
cera B., Skandinaviske normer for testing av små feilfrie prøver
av heltre, Skogforsk, Norwegian Forest Research Institute, Ås,
1992.
[22] Ku
ˇ
cera B., A hypothesis relating current annual height increment
to juvenile wood formation in Norway spruce, Wood Fiber Sci. 26
(1994) 152–167.
[23] Kumar S., Genetic parameter estimates for wood stiffness, strength,
internal checking, and resin bleeding for radiata pine, Can. J. For.
Res. 34 (2004) 2601–2610.
806 A. Steffenrem et al.
[24] Kumar S., Dungey H.S., Matheson A.C., Genetic parameters and
strategies for genetic improvement of stiffness in radiata pine,
Silvae Genet. 55 (2006) 77–84.
[25] Kumar S., Jayawickrama K.J.S., Lee J., Lausberg M., Direct and
indirect measures of stiffness and strength show high heritability in
a wind-pollinated radiata pine progeny test in New Zealand, Silvae
Genet. 51 (2002) 256–261.
[26] Lichtenegger H., Reiterer A., Stanzl-Tschegg S.E., Fratzl P.,
Variation of cellulose microfibril angles in softwoods and hard-
woods – A possible strategy of mechanical optimization, J. Struct.
Biol. 128 (1999) 257–269.
[27] Lindström H., Harris P., Nakada R., Methods for measuring stiffness
of young trees, Holz Roh- Werkst. 60 (2002) 165–174.
[28] Lindström H., Harris P., Sorensson C.T., Evans R., Stiffness and
wood variation of 3-year old Pinus radiata clones, Wood Sci.
Technol. 38 (2004) 579–597.
[29] Megraw R., Bremer D., Leaf G., Roers J., Stiffness in loblolly pine
as a function of ring position and height, and its relationship to mi-
crofibril angle and specific gravity, in: Nepveu G. (Ed.), Connection
between silviculture and wood quality trough modelling approaches
and simulation software, Proceedings of IUFRO WP S5.01-04
Third Workshop, La Londe-Les-Maures, France, 1999, pp. 341–
349.
[30] Montgomery D.C., Design and analysis of experiments, John Wiley
& Sons, inc., New York, 1997.
[31] Northcott P.L., The effect of spiral grain on the usefulness of wood,
Forest Products Laboratory, Canada. Reprint from Proceedings of
the meeting of IUFRO section 41, Melbourne, Australia, Vancouver,
BC, 1965, pp. 1–18.
[32] Olesen P.O., The interrelation between basic density and ring
width of Norway spruce, Rapport fra Det Forstlige Forsøgsvæsen
i Danmark 35 (1976) 340–359.
[33] Poke F.S., Potts B.M., Vaillancourt R.E., Raymond C.A., Genetic
parameters for lignin, extractives and decay in Eucalyptus globulus,
Ann. For. Sci. 63 (2006) 813–821.
[34] Raiskila S., Pulkkinen M., Laakso T., Fagerstedt K., Löija M.,
Mahlberg R., Paajanen L., Ritschkoff A.C., Saranpää P., FTIR spec-
troscopic prediction of Klason and acid soluble lignin variation in
Norway spruce clones, Silva Fenn. 41 (2007) 351–371.
[35] Raiskila S., Saranpää P., Fagerstedt K., Laakso T., Löija M.,
Mahlberg R., Paajanen L., Ritschkoff A.C., Growth rate and wood
properties of Norway spruce cutting clones on different sites, Silva
Fenn. 40 (2006) 247–256.
[36] Rathgeber C.B.K., Decoux V., Leban J M., Linking intra-tree-ring
wood density variations and tracheid anatomical characteristics in
Douglas fir Pseudotsuga menziesii (Mirb.) Franco), Ann. For. Sci.
63 (2006) 699–706.
[37] Regent Instruments Inc., WinDendro 2002b, Regent Instruments
Inc., Quebec, 2002.
[38] Reiterer A., Lichtenegger H., Tschegg S., Fratzl P., Experimental
evidence for a mechanical function of the cellulose microfibril angle
in wood cell walls, Philosophical Mag. A 79 (1999) 2173–2184.
[39] Saranpää P., Wood density and growth, in: Barnett J.R., Jeronimidis
G. (Eds.), Wood quality and its biological basis, Blackwell
Publishing & CRC Press. Biological Sciences Series, 2003, pp. 87–
117.
[40] Saranpää P., Repola J., Strenght of Norway spruce from both mixed
stands and monocultures, The Finnish For. Inst., Research Papers
822 (2001) 33–39.
[41] Sarén M.P., Serimaa R., Andersson S., Paakkari T., Saranpää P.,
Pesonen E., Structural variation of tracheids in Norway spruce
(Picea abies [L.] Karst.), J. Struct. Biol. 136 (2001) 101–109.
[42] Sarén M.P., Serimaa R., Andersson S., Saranpää P., Keckes J.,
Fratzl P., Effect of growth rate on mean microfibril angle and cross-
sectional shape of tracheids of Norway spruce, Trees-Struct. Funct.
18 (2004) 354–362.
[43] SAS Institute Inc., SAS/STAT user’s guide, version 9, SAS Institute
Inc., Cary, NC, USA, 2003.
[44] Skrøppa T., Tho T., Diallel crosses in Picea abies
. I. Variation in
seed yield and seed weight, Scand. J. For. Res. 5 (1990) 355–367.
[45] Säll H., Spiral grain in Norway spruce, Acta Wexionesia 22/2002
(2002) 1–171.
[46] Timmel T.E., Compression wood in gymnosperms, Springer-
Verlag, New York, 1986.
[47] Tveite B., Site-index curves for Norway spruce (Picea abies (L.)
Karst), Meddelelser fra Norsk institutt for skogforskning 33 (1977)
1–84.
[48] Van Buijtenen J.P., Fundamental genetic principles, in: Fins L.,
Friedman S.T., Brotschol J.V. (Eds.), Handbook of quantitative
forest genetics, Kluwer academic publishers, Dordrecht, 1992,
pp. 29–68.
[49] Wilson T.R.C., The effect of spiral grain on the strength of wood, J.
For. XIX (1921) 740–747.
[50] Zobel B., van Buijtenen J.P., Wood variation: its causes and control,
Springer-Verlag, Berlin, 1989.