Number operation review 4 potx
Bạn đang xem bản rút gọn của tài liệu. Xem và tải ngay bản đầy đủ của tài liệu tại đây (109.11 KB, 6 trang )
Sets
Sets are collections of certain numbers. All of the numbers within a set are called the members of the set.
Examples
The set of integers is { . . . Ϫ3, Ϫ2 , Ϫ1,0,1,2,3, }.
The set of whole numbers is {0, 1, 2, 3, }.
Intersections
When you find the elements that two (or more) sets have in common, you are finding the intersection of the sets.
The symbol for intersection is ʝ.
Example
The set ofnegative integers is { ,Ϫ4, –3, Ϫ2, Ϫ1}.
The set ofeven numbers is { ,Ϫ4,Ϫ2,0,2,4, }.
The intersection of the set of negative integers and the set of even numbers is the set of elements (numbers)
that the two sets have in common:
{ ,Ϫ8, Ϫ6, Ϫ4, Ϫ2}.
Practice Question
Set X ϭ even numbers between 0 and 10
Set Y ϭ prime numbers between 0 and 10
What is X ʝ Y?
a. {1, 2, 3, 4, 5, 6, 7, 8, 9}
b. {1, 2, 3, 4, 5, 6, 7, 8}
c. {2}
d. {2, 4, 6, 8}
e. {1, 2, 3, 5, 7}
Answer
c. X ʝ Y is “the intersection of sets X and Y.” The intersection of two sets is the set of numbers shared by
both sets. Set X ϭ {2, 4, 6, 8}. Set Y ϭ {1, 2, 3, 5, 7}. Therefore, the intersection is {2}.
Unions
When you combine the elements of two (or more) sets, you are finding the union of the sets. The symbol for union
is ʜ.
Example
The positive even integers are {2,4,6,8, }.
The positive odd integers are {1,3,5,7, }.
If we combine the elements of these two sets, we find the union of these sets:
{1,2,3,4,5,6,7,8, }.
–NUMBERS AND OPERATIONS REVIEW–
59
Practice Question
Set P ϭ {0,
ᎏ
3
7
ᎏ
, 0.93, 4, 6.98,
ᎏ
2
2
7
ᎏ
}
Set Q ϭ {0.01, 0.15, 1.43, 4}
What is P ʜ Q?
a. {4}
b. {
ᎏ
3
7
ᎏ
,
ᎏ
2
2
7
ᎏ
}
c. {0, 4}
d. {0, 0.01, 0.15,
ᎏ
3
7
ᎏ
, 0.93, 1.43, 6.98,
ᎏ
2
2
7
ᎏ
}
e. {0, 0.01, 0.15,
ᎏ
3
7
ᎏ
, 0.93, 1.43, 4, 6.98,
ᎏ
2
2
7
ᎏ
}
Answer
e. P ʜ Q is “the union of sets P and Q.” The union of two sets is all the numbers from the two sets com-
bined. Set P ϭ {0,
ᎏ
3
7
ᎏ
, 0.93, 4, 6.98,
ᎏ
2
2
7
ᎏ
}. Set Q ϭ {0.01, 0.15, 1.43, 4}. Therefore, the union is {0, 0.01,
0.15,
ᎏ
3
7
ᎏ
, 0.93, 1.43, 4, 6.98,
ᎏ
2
2
7
ᎏ
}.
Mean, Median, and Mode
To find the average, or mean, of a set of numbers, add all of the numbers together and divide by the quantity of
numbers in the set.
mean ϭ
Example
Find the mean of 9, 4, 7, 6, and 4.
ᎏ
9+4+7
5
+6+4
ᎏ
ϭ
ᎏ
3
5
0
ᎏ
ϭ 6 The denominator is 5 because there are five numbers in the set.
To find the median of a set of numbers, arrange the numbers in ascending order and find the middle value.
■
If the set contains an odd number of elements, then simply choose the middle value.
Example
Find the median of the number set: 1, 5, 3, 7, 2.
First arrange the set in ascending order: 1, 2, 3, 5, 7.
Then choose the middle value: 3.
The median is 3.
■
If the set contains an even number of elements, then average the two middle values.
Example
Find the median of the number set: 1, 5, 3, 7, 2, 8.
First arrange the set in ascending order: 1, 2, 3, 5, 7, 8.
Then choose the middle values: 3 and 5.
Find the average of the numbers 3 and 5:
ᎏ
3 ϩ
2
5
ᎏ
ϭ
ᎏ
8
2
ᎏ
ϭ 4.
The median is 4.
sum of numbers in set
ᎏᎏᎏ
quantity of numbers in set
–NUMBERS AND OPERATIONS REVIEW–
60
The mode of a set of numbers is the number that occurs most frequently.
Example
For the number set 1, 2, 5, 3, 4, 2, 3, 6, 3, 7, the number 3 is the mode because it occurs three times. The other
numbers occur only once or twice.
Practice Question
If the mode of a set of three numbers is 17, which of the following must be true?
I. The average is greater than 17.
II. The average is odd.
III. The median is 17.
a. none
b. I only
c. III only
d. I and III
e. I, II, and III
Answer
c. If the mode of a set of three numbers is 17, the set is {x, 17, 17}. Using that information, we can evalu-
ate the three statements:
Statement I: The average is greater than 17.
If x is less than 17, then the average of the set will be less than 17. For example, if x ϭ 2, then we can find the
average:
2 ϩ 17 ϩ 17 ϭ 36
36 Ϭ 3 ϭ 12
Therefore, the average would be 12, which is not greater than 17, so number I isn’t necessarily true. Statement
I is FALSE.
Statement II: The average is odd.
Because we don’t know the third number of the set, we don’t know that the average must be even. As we just
learned, if the third number is 2, the average is 12, which is even, so statement II ISN’T NECESSARILY TRUE.
Statement III: The median is 17.
We know that the median is 17 because the median is the middle value of the three numbers in the set. If X >
17, the median is 17 because the numbers would be ordered: X, 17, 17. If X < 17, the median is still 17 because
the numbers would be ordered: 17, 17, X. Statement III is TRUE.
Answer: Only statement III is NECESSARILY TRUE.
–NUMBERS AND OPERATIONS REVIEW–
61
Percent
A percent is a ratio that compares a number to 100. For example, 30% ϭ
ᎏ
1
3
0
0
0
ᎏ
.
■
To convert a decimal to a percentage, move the decimal point two units to the right and add a percentage
symbol.
0.65 ϭ 65% 0.04 ϭ 4% 0.3 ϭ 30%
■
One method of converting a fraction to a percentage is to first change the fraction to a decimal (by dividing
the numerator by the denominator) and to then change the decimal to a percentage.
ᎏ
3
5
ᎏ
ϭ 0.60 ϭ 60%
ᎏ
1
5
ᎏ
ϭ 0.2 ϭ 20%
ᎏ
3
8
ᎏ
ϭ 0.375 ϭ 37.5%
■
Another method of converting a fraction to a percentage is to, if possible, convert the fraction so that it has
a denominator of 100. The percentage is the new numerator followed by a percentage symbol.
ᎏ
3
5
ᎏ
ϭ
ᎏ
1
6
0
0
0
ᎏ
ϭ 60%
ᎏ
2
6
5
ᎏ
ϭ
ᎏ
1
2
0
4
0
ᎏ
ϭ 24%
■
To change a percentage to a decimal, move the decimal point two places to the left and eliminate the per-
centage symbol.
64% ϭ 0.64 87% ϭ 0.87 7% ϭ 0.07
■
To change a percentage to a fraction, divide by 100 and reduce.
44% ϭ
ᎏ
1
4
0
4
0
ᎏ
ϭ
ᎏ
1
2
1
5
ᎏ
70% ϭ
ᎏ
1
7
0
0
0
ᎏ
ϭ
ᎏ
1
7
0
ᎏ
52% ϭ
ᎏ
1
5
0
2
0
ᎏ
ϭ
ᎏ
2
5
6
0
ᎏ
■
Keep in mind that any percentage that is 100 or greater converts to a number greater than 1, such as a whole
number or a mixed number.
500% ϭ 5 275% ϭ 2.75 or 2
ᎏ
3
4
ᎏ
Here are some conversions you should be familiar with:
–NUMBERS AND OPERATIONS REVIEW–
62
FRACTION DECIMAL PERCENTAGE
ᎏ
1
2
ᎏ
0.5 50%
ᎏ
1
4
ᎏ
0.25 25%
ᎏ
1
3
ᎏ
0.333 . . . 33.3
ෆ
%
ᎏ
2
3
ᎏ
0.666 . . . 66.6
ෆ
%
ᎏ
1
1
0
ᎏ
0.1 10%
ᎏ
1
8
ᎏ
0.125 12.5%
ᎏ
1
6
ᎏ
0.1666 . . . 16.6
ෆ
%
ᎏ
1
5
ᎏ
0.2 20%
Practice Question
If
ᎏ
2
7
5
ᎏ
< x < 0.38, which of the following could be a value of x?
a. 20%
b. 26%
c. 34%
d. 39%
e. 41%
Answer
c.
ᎏ
2
7
5
ᎏ
ϭ
ᎏ
1
2
0
8
0
ᎏ
ϭ 28%
0.38 ϭ 38%
Therefore, 28% < x < 38%.
Only answer choice c, 34%, is greater than 28% and less than 38%.
Graphs and Tables
The SAT includes questions that test your ability to analyze graphs and tables. Always read graphs and tables care-
fully before moving on to read the questions. Understanding the graph will help you process the information that
is presented in the question. Pay special attention to headings and units of measure in graphs and tables.
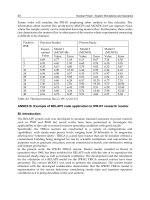
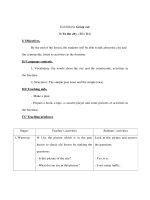
Circle Graphs or Pie Charts
This type of graph is representative of a whole and is usually divided into percentages. Each section of the chart
represents a portion of the whole. All the sections added together equal 100% of the whole.
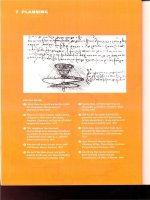
Bar Graphs
Bar graphs compare similar things with different length bars representing different values. On the SAT, these graphs
frequently contain differently shaded bars used to represent different elements. Therefore, it is important to pay
attention to both the size and shading of the bars.
25%
40%
35%
–NUMBERS AND OPERATIONS REVIEW–
63
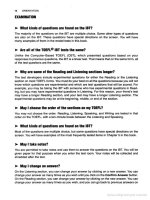
Broken-Line Graphs
Broken-line graphs illustrate a measurable change over time. If a line is slanted up, it represents an increase whereas
a line sloping down represents a decrease. A flat line indicates no change as time elapses.
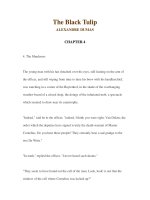
Scatterplots illustrate the relationship between two quantitative variables. Typically, the values of the inde-
pendent variables are the x-coordinates, and the values of the dependent variables are the y-coordinates. When
presented with a scatterplot, look for a trend. Is there a line that the points seem to cluster around? For example:
HS GPA
College GPA
Increase
Decrease
No Change
Increase
Decrease
Change in Time
Unit of Measure
Comparison of Road Work Funds
of New York and California
1990–1995
New York
California
KEY
0
10
20
30
40
50
60
70
80
90
1991 1992 1993 1994 1995
Money Spent on New Road Work
in Millions of Dollars
Year
–NUMBERS AND OPERATIONS REVIEW–
64