Battery Basics Everyone Should Know phần 6 potx
Bạn đang xem bản rút gọn của tài liệu. Xem và tải ngay bản đầy đủ của tài liệu tại đây (365.77 KB, 15 trang )
battery life because the battery is kept at room temperature. Some models carry several size
batteries to accommodate different user patterns.
What then is the best battery for a laptop? The choices are limited. The NiCd has virtually
disappeared from the mobile computer scene and the NiMH is loosing steam, paving the way
for the Li-ion. Eventually, very slim geometry will also demand thin batteries, and this is
possible with the prismatic Li-ion polymer.
Besides providing reliable performance for general portable use, the Li-ion battery also offers
superior service for laptop users who must continually switch from fixed power to battery use,
as is the case for many sales people. Many biomedical and industrial applications follow this
pattern also. Here is the reason why such use can be hard on some batteries:
On a nickel-based charging system, unless smart, the charger applies a full charge each time
the portable device is connected to fixed power. In many cases, the battery is already fully
charged and the cells go almost immediately into overcharge. The battery heats up, only to be
detected by a sluggish thermal charge control, which finally terminates the fast charge.
Permanent capacity loss caused by overcharge and elevated temperature is the result.
Among the nickel-based batteries, NiMH is least capable of tolerating a recharge on top of a
charge. Adding elevated ambient temperatures to the charging irregularities, a NiMH battery
can be made inoperable in as little as six months. In severe cases, the NiMH is known to last
only 2 to 3 months.
For mixed battery and utility power use, the Li-ion system is a better choice. If a fully charged
Li-ion is placed on charge, no charge current is applied. The battery only receives a recharge
once the terminal voltage has dropped to a set threshold. Neither is there a concern if the
device is connected to fixed power for long periods of time. No overcharge can occur and
there is no memory to worry about.
NiMH is the preferred choice for a user who runs the laptop mostly on fixed power and
removes the battery when not needed. This way, the battery is only engaged if the device is
used in portable mode. The NiMH battery can thus be kept fresh while sitting on the shelf.
NiMH ages well if kept cool and only partially charged.
Selecting a Lasting Battery
As part of an ongoing research program to find the optimum battery system for selected
applications, Cadex has performed life cycle tests on NiCd, NiMH and Li-ion batteries. All
tests were carried out on the Cadex 7000 Series battery analyzers in the test labs of Cadex,
Vancouver, Canada. The batteries tested received an initial full-charge, and then underwent a
regime of continued discharge/charge cycles. The internal resistance was measured with
Cadex’s Ohmtest™ method, and the self-discharge was obtained from time-to-time by
reading the capacity loss incurred during a 48-hour rest period. The test program involved
53 commercial telecommunications batteries of different models and chemistries. One battery
of each chemistry displaying typical behavior was chosen for the charts below.
When conducting battery tests in a laboratory, it should be noted that the performance in a
protected environment is commonly superior to those in field use. Elements of stress and
inconsistency that are present in everyday use cannot always be simulated accurately in
the lab.
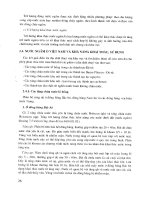
The NiCd Battery — In terms of life cycling, the standard NiCd is the most enduring battery.
In Figure 8-1 we examine the capacity, internal resistance and self-discharge of a 7.2V,
900mA NiCd battery with standard cells. Due to time constraints, the test was terminated after
2300 cycles. During this period, the capacity remains steady, the internal resistance stays flat
at 75mW and the self-discharge is stable. This battery receives a grade ‘A’ for almost perfect
performance.
The readings on an ultra-high capacity NiCd are less favorable but still better than other
chemistries in terms of endurance. Although up to 60 percent higher in energy density
compared to the standard NiCd version, Figure 8-2 shows the ultra-high NiCd gradually losing
capacity during the 2000 cycles delivered. At the same time, the internal resistance rises
slightly. A more serious degradation is the increase of self-discharge after 1000 cycles. This
deficiency manifests itself in shorter runtimes because the battery consumes some energy
itself, even if not in use.
Figure 8-1: Characteristics of a standard cell NiCd battery.
This battery deserves an ‘A’ for almost perfect performance in terms of stable capacity, internal resistance and self-
discharge over many cycles. This illustration shows results for a 7.2V, 900mA NiCd.
Figure 8-2: Characteristics of a NiCd battery with ultra-high capacity cells.
This battery is not as favorable as the standard NiCd but offers higher energy densities and performs better than
other chemistries in terms of endurance. This illustrations shows results for a 6V, 700mA NiCd.
The NiMH Battery — Figure 8-3 examines the NiMH, a battery that offers high energy
density at reasonably low cost. We observe good performance at first but past the 300-cycle
mark, the performance starts to drift downwards rapidly. One can detect a swift increase in
internal resistance and self-discharge after cycle count 700.
Figure 8-3: Characteristics of a NiMH battery.
This battery offers good performance at first but past the 300-cycle mark, the capacity, internal resistance and self-
discharge start to deteriorate rapidly. This illustrations shows results for a 6V, 950mA NiMH.
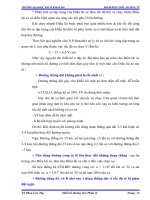
The Li-ion Battery — The Li-ion battery offers advantages that neither the NiCd nor NiMH
can match. In Figure 8-4 we examine the capacity and internal resistance of a typical Li-ion. A
gentle capacity drop is observed over 1000 cycles and the internal resistance increases only
slightly. Because of low readings, self-discharge was omitted for this test.
The better than expected performance of this test battery may be due to the fact that the test
did not include aging. The lab test was completed in about 200 days. A busy user may charge
the battery once every 24 hours. With such a user pattern, 500 cycles would represent close
to two years of normal use and the effects of aging would become apparent.
Manufacturers of commercial Li-ion batteries specify a cycle count of 500. At that stage, the
battery capacity would drop from 100 to 80 percent. If operated at 40°C (104°F) rather than at
room temperature, the same battery would only deliver about 300 cycles.
Figure 8-4: Characteristics of a Li-ion battery.
The above-average performance of this battery may be due to the fact that the test did not include aging. This
illustration shows results for a 3.6V, 500mA Li-ion battery.
Chapter 9: Internal Battery Resistance
With the move from analog to digital devices, new demands are being placed on the battery.
Unlike analog equipment that draws a steady current, the digital mobile phone, for example,
loads the battery with short, high current bursts.
Increasingly, mobile communication devices are
moving from voice only to multimedia which
allows sending and receiving data, still pictures
and even video. Such transmissions add to the
bandwidth, which require several times the b
power compared to voice only.
attery
One of the urgent requirements of a battery for
digital applications is low internal resistance.
Measured in milliohms (mΩ), the internal
resistance is the gatekeeper that, to a large extent, determines the runtime. The lower the
resistance, the less restriction the battery encounters in delivering the needed power bursts. A
high mΩ reading can trigger an early ‘low battery’ indication on a seemingly good battery
because the available energy cannot be delivered in an appropriate manner.
Figure 9-1 examines the major global mobile phone systems and compares peak power and
peak current requirements. The systems are the AMP, GSM, TDMA and CDMA.
AMP GSM TDMA
1
CDMA
Type
Analog Digital Digital Digital
Used in
USA, Canada Globally USA, Canada USA, Canada
Peak Power
0.6W 1-2W 0.6-1W 0.2W
Peak current
2
0.3A DC 1-2.5A 0.8-1.5A 0.7A
In service since
1985 1986 1992 1995
Figure 9-1: Peak power requirements of popular global mobile phone systems.
Moving from voice to multi-media requires several times the battery power.
1. Some TDMA handsets feature dual mode (analog 800mA DC load; digital 1500mA
pulsed load).
2. Current varies with battery voltage; a 3.6V battery requires higher current than a 7.2V
battery.
Why do seemingly good batteries fail on digital equipment?
Service technicians have been puzzled by the seemingly unpredictable battery behavior when
powering digital equipment. With the switch from analog to digital wireless communications
devices, particularly mobile phones, a battery that performs well on an analog device may
show irrational behavior when used on a digital device. Testing these batteries with a battery
analyzer produces normal capacity readings. Why then do some batteries fail prematurely on
digital devices but not on analog?
The overall energy requirement of a digital mobile phone is less than that of the analog
equivalent, however, the battery must be capable of delivering high current pulses that are
often several times that of the battery’s rating. Let’s look at the battery rating as expressed in
C-rates.
A 1C discharge of a battery rated at 500mAh is 500mA. In comparison, a 2C discharge of the
same battery is 1000mA. A GSM phone powered by a 500mA battery that draws 1.5A pulses
loads the battery with a whopping 3C discharge.
A 3C rate discharge is fine for a battery with very low internal resistance. However, aging
batteries, especially Li-ion and NiMH chemistries, pose a challenge because the mΩ readings
of these batteries increase with use.
Improved performance can be achieved by using a larger battery, also known as an extended
pack. Somewhat bulkier and heavier, an extended pack offers a typical rating of about
1000mAh or roughly double that of the slim-line. In terms of C-rate, the 3C discharge is
reduced to 1.5C when using a 1000mAh instead of a 500mAh battery.
As part of ongoing research to find the best battery system for wireless devices, Cadex has
performed life cycle tests on various battery systems. In Figure 9-2, Figure 9-3, and Figure 9-
4, we examine NiCd, NiMH and Li-ion batteries, each of which generates a good capacity
reading when tested with a battery analyzer but produce stunning differences on a pulsed
discharge of 1C, 2C and 3C. These pulses simulate a GSM phone.
Figure 9-2: Talk-time of a NiCd battery under the GSM load schedule.
This battery has 113% capacity and 155mΩ internal resistance.
A closer look reveals vast discrepancies in the mΩ measurements of the test batteries. In fact,
these readings are typical of batteries that have been in use for a while. The NiCd shows
155mΩ, the NiMH 778mΩ and the Li-ion 320mΩ, although the capacities checked in at 113,
107 and 94 percent respectively when tested with the DC load of a battery analyzer. It should
be noted that the internal resistance was low when the batteries were new.
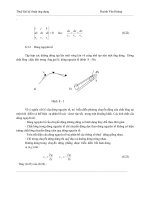
Figure 9-3: Talk-time of a NiMH battery under the GSM load schedule.
This battery has 107% capacity and 778mΩ internal resistance.
Figure 9-4: Talk-time of a Li-ion battery under the GSM load schedule.
This battery has 94% capacity and 320mΩ internal resistance.
From these charts we can see that the talk-time is in direct relationship with the battery’s
internal resistance. The NiCd performs best and produces a talk time of 140 minutes at 1C
and a long 120 minutes at 3C. In comparison, the NiMH is good for 140 minutes at 1C but
fails at 3C. The Li-ion provides 105 minutes at 1C and 50 minutes at 3C discharge.
How is the internal battery resistance measured?
A number of techniques are used to measure internal battery resistance. One common
method is the DC load test, which applies a discharge current to the battery while measuring
the voltage drop. Voltage over current provides the internal resistance (see Figure 9-5).
Figure 9-5: DC load test.
The DC load test measures the battery’s internal resistance by reading the voltage drop. A large drop indicates high
resistance.
The AC method, also known as the conductivity test, measures the electrochemical
characteristics of a battery. This technique applies an alternating current to the battery
terminals. Depending on manufacturer and battery type, the frequency ranges from 10 to
1000Hz. The impedance level affects the phase shift between voltage and current, which
reveals the condition of the battery. The AC method works best on single cells. Figure 9-6
demonstrates a typical phase shift between voltage and current when testing a battery.
Figure 9-6: AC load test.
The AC method measures the phase shift between voltage and current. The battery’s reactance is used to calculate
the impedance.
Some AC resistance meters evaluate only the load factor and disregard the phase shift
information. This technique is similar to the DC method. The AC voltage that is superimposed
on the battery’s DC voltage acts as brief charge and discharge pulses. The amplitude of the
ripple is utilized to calculate the internal battery resistance.
Cadex uses the discreet DC method to measure internal battery resistance. Added to the
Cadex 7000 Series battery analyzers, a number of charge and discharge pulses are applied,
which are scaled to the mAh rating of the battery tested. Based on the voltage deflections, the
battery’s internal resistance is calculated. Known as Ohmtest™, the mΩ reading is obtained
in five seconds. Figure 9-7 shows the technique used.
Figure 9-7: Cadex Ohmtest™.
Cadex’s pulse method measures the voltage deflections by applying charge and discharge pulses. Higher deflections
indicate higher internal resistance.
Figure 9-8 compares the three methods of measuring the internal resistance of a battery and
observe the accuracy. In a good battery, the discrepancies between methods are minimal.
The test results deviate to a larger degree on packs with poor SoH.
Impedance measurement alone does not provide a definite conclusion as to the battery
performance. The mΩ readings may vary widely and are dependent on battery chemistry, cell
size (mAh rating), type of cell, number of cells connected in series, wiring and contact type.
Figure 9-8: Comparison of the AC, DC and Cadex Ohmtest™ methods.
State-of-health readings were obtained using the Cadex 7000 Series battery analyzer by applying a full
charge/discharge/charge cycle. The DC method on the 68% SoH battery exceeded 1000mΩ.
When using the impedance method, a battery with a known performance should be measured
and its readings used as a reference. For best results, a reference reading should be on hand
for each battery type. Figure 9-9kl; provides a guideline for digital mobile phone batteries
based on impedance readings.
The milliohm readings are related to the battery voltage. Higher voltage batteries allow higher
internal resistance because less current is required to deliver the same power. The ratio
between voltage and milliohm is not totally linear. There are certain housekeeping
components that are always present whether the battery has one or several cells. These are
wiring, contacts and protection circuits.
Temperature also affects the internal resistance of a battery. The internal resistance of a
naked Li-ion cell, for example, measures 50mΩ at 25°C (77°F). If the temperature increases,
the internal resistance decreases. At 40°C (104°F), the internal resistance drops to about
43mΩ and at 60°C (140°F) to 40mΩ. While the battery performs better when exposed to heat,
prolonged exposure to elevated temperatures is harmful. Most batteries deliver a momentary
performance boost when heated.
Milli-Ohm Battery Voltage Ranking
75-150mOhm
3.6V Excellent
150-250mOhm
3.6V Good
250-350mOhm
3.6V Marginal
350-500mOhm
3.6V Poor
Above 500mOhm
3.6V Fail
Figure 9-9: Battery state-of-health based on internal resistance.
The milliohm readings relate to the battery voltage; higher voltage allows higher milliohm readings.
Cold temperatures have a drastic effect on all batteries. At 0°C (32°F), the internal resistance
of the same Li-ion cell drops to 70mΩ. The resistance increases to 80mΩ at -10°C (50°F) and
100mΩ at -20°C (-4°F).
The impedance readings work best with Li-ion batteries because the performance
degradation follows a linear pattern with cell oxidation. The performance of NiMH batteries
can also be measured with the impedance method but the readings are less dependable.
There are instances when a poorly performing NiMH battery can also exhibit a low mΩ
reading.
Testing a NiCd on resistance alone is unpredictable. A low resistance reading does not
automatically constitute a good battery. Elevated impedance readings are often caused by
memory, a phenomenon that is reversible. Internal resistance values have been reduced by a
factor of two and three after servicing the affected batteries with the recondition cycle of a
Cadex 7000 Series battery analyzer. Of cause, high internal resistance can have sources
other than memory alone.
What’s the difference between internal resistance and
impedance?
The terms ‘internal resistance’ and ‘impedance’ are often intermixed when addressing the
electrical conductivity of a battery. The differences are as follows: The internal resistance
views the conductor from a purely resistive value, or ohmic resistance. A comparison can be
made with a heating element that produces warmth by the friction of electric current passing
through.
Most electrical loads are not purely resistive, rather, they have an element of reactance. If an
alternating current (AC) is sent through a coil, for example, an inductance (magnetic field) is
created, which opposes current flow. This AC impedance is always higher than the ohmic
resistance of the copper wire. The higher the frequency, the higher the inductive resistance
becomes. In comparison, sending a direct current (DC) through a coil constitutes an electrical
short because there is only a very small ohmic resistance.
Similarly, a capacitor does not allow the flow of DC, but passes AC. In fact, a capacitor is an
insulator for DC. The resistance that is present when sending an AC current flowing through a
capacitor is called capacitance. The higher the frequency, the lower the capacitive resistance.
A battery as a power source combines ohmic, inductive and capacitive resistance. Figure 9-
10 represents these resistive values on a schematic diagram. Each battery type exhibits
slightly different resistive values.
Figure 9-10: Ohmic, inductive and capacitive resistance in batteries.
•
R = ohmic resistance
o
• Q = constant phase loop (type of capacitance)
c
• L = inductor
• Z = Warburg impedance (particle movement within the electrolyte)
w
• R = transfer resistance
t
Chapter 10: Getting the Most from your Batteries
A common difficulty with portable equipment is the gradual decline in battery performance after the first year of service.
Although fully charged, the battery eventually regresses to a point where the available energy is less than half of its original
capacity, resulting in unexpected downtime.
Downtime almost always occurs at critical moments. This is especially true in the public safety
sector where portable equipment runs as part of a fleet operation and the battery is charged
in a pool setting, often with minimal care and attention. Under normal conditions, the battery
will hold enough power to last the day. During heavy activities and longer than expected
duties, a marginal battery cannot provide the extra power needed and the equipment fails.
Rechargeable batteries are known to cause more concern, grief and frustration than any other
part of a portable device. Given its relatively short life span, the battery is the most expensive
and least reliable component of a portable device.
In many ways, a rechargeable battery exhibits human-like characteristics: it needs good
nutrition, it prefers moderate room temperature and, in the case of the nickel-based system,
requires regular exercise to prevent the phenomenon called ‘memory’. Each battery seems to
develop a unique personality of its own.
Memory: myth or fact?
The word ‘memory’ was originally derived from ‘cyclic memory’, meaning that a NiCd battery
can remember how much discharge was required on previous discharges. Improvements in
battery technology have virtually eliminated this phenomenon. Tests performed at a Black &
Decker lab, for example, showed that the effects of cyclic memory on the modern NiCd were
so small that they could only be detected with sensitive instruments. After the same battery
was discharged for different lengths of time, the cyclic memory phenomenon could no longer
be noticed.
The problem with the nickel-based battery is not the cyclic memory but the effects of
crystalline formation. There are other factors involved that cause degeneration of a battery.
For clarity and simplicity, we use the word ‘memory’ to address capacity loss on nickel-based
batteries that are reversible.
The active cadmium material of a NiCd battery is present in finely divided crystals. In a good
cell, these crystals remain small, obtaining maximum surface area. When the memory
phenomenon occurs, the crystals grow and drastically reduce the surface area. The result is a
voltage depression, which leads to a loss of capacity. In advanced stages, the sharp edges of
the crystals may grow through the separator, causing high self-discharge or an electrical short.
Another form of memory that occurs on some NiCd cells is the formation of an inter-metallic
compound of nickel and cadmium, which ties up some of the needed cadmium and creates
extra resistance in the cell. Reconditioning by deep discharge helps to break up this
compound and reverses the capacity loss.
The memory phenomenon can be explained in layman’s terms as expressed by Duracell:
“The voltage drop occurs because only a portion of the active materials in the cells is
discharged and recharged during shallow or partial discharging. The active materials that
have not been cycled change in physical characteristics and increase in resistance.
Subsequent full discharge/charge cycling will restore the active materials to their original
state.”
When NiMH was first introduced there was much publicity about its memory-free status.
Today, it is known that this chemistry also suffers from memory but to a lesser extent than the
NiCd. The positive nickel plate, a metal that is shared by both chemistries, is responsible for
the crystalline formation.
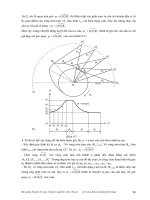
New NiCd cell.
The anode is in fresh condition (capacity of 8.1Ah). Hexagonal cadmium
hydroxide crystals are about 1 micron in cross section, exposing large
surface area to the liquid electrolyte for maximum performance.
Cell with crystalline formation.
Crystals have grown to an enormous 50 to 100 microns in cross section,
concealing large portions of the active material from the electrolyte (capacity
of 6.5Ah). Jagged edges and sharp corners may pierce the separator, which
can lead to increased self-discharge or electrical short.
Restored cell.
After pulsed charge, the crystals are reduced to 3 to 5 microns, an almost
100% restoration (capacity of 8.0A). Exercise or recondition are needed if
the pulse charge alone is not effective.
Figure 10-1: Crystalline formation on NiCd cell.
Illustration courtesy of the US Army Electronics Command in Fort Monmouth, NJ, USA.
In addition to the crystal-forming activity on the positive plate, the NiCd also develops crystals
on the negative cadmium plate. Because both plates are affected by crystalline formation, the
NiCd requires more frequent discharge cycles than the NiMH. This is a non-scientific
explanation of why the NiCd is more prone to memory than the NiMH.
The stages of crystalline formation of a NiCd battery are illustrated in Figure 10-1. The
enlargements show the negative cadmium plate in normal crystal structure of a new cell,
crystalline formation after use (or abuse) and restoration.
Lithium and lead-based batteries are not affected by memory, but these chemistries have
their own peculiarities. Current inhibiting pacifier layers affect both batteries — plate oxidation
on the lithium and sulfation and corrosion on the lead acid systems. These degenerative
effects are non-correctible on the lithium-based system and only partially reversible on the
lead acid.
How to Restore and Prolong Nickel-based Batteries
The effects of crystalline formation are most pronounced if a nickel-based battery is left in the
charger for days, or if repeatedly recharged without a periodic full discharge. Since most
applications do not use up all energy before recharge, a periodic discharge to 1V/cell (known
as exercise) is essential to prevent the buildup of crystalline formation on the cell plates. This
maintenance is most critical for the NiCd battery.
All NiCd batteries in regular use and on standby mode (sitting in a charger for operational
readiness) should be exercised once per month. Between these monthly exercise cycles, no
further service is needed. The battery can be used with any desired user pattern without the
concern of memory.
The NiMH battery is affected by memory also, but to a lesser degree. No scientific research is
available that compares NiMH with NiCd in terms of memory degradation. Neither is
information on hand that suggests the optimal amount of maintenance required to obtain
maximum battery life. Applying a full discharge once every three months appears right.
Because of the NiMH battery’s shorter cycle life, over-exercising is not recommended.
A hand towel must be cleaned periodically. However, if it were washed after each use, its
fabric would wear out very quickly. In the same way, it is neither necessary nor advisable to
discharge a rechargeable battery before each charge — excessive cycling puts extra strain
on the battery.
Exercise and Recondition — Research has shown that if no exercise is applied to a NiCd
for three months or more, the crystals ingrain themselves, making them more difficult to break
up. In such a case, exercise is no longer effective in restoring a battery and reconditioning is
required. Recondition is a slow, deep discharge that removes the remaining battery energy by
draining the cells to a voltage threshold below 1V/cell.
Figure 10-2: Exercising and reconditioning batteries on a Cadex battery analyzer.
This illustration shows the battery voltage during a normal discharge to 1V, followed by the secondary discharge
(recondition). Recondition consists of a discharge to 1V/cell at a 1C load current, followed by a secondary discharge
to 0.4V at a much reduced current. NiCd batteries affected by memory often restore themselves to full service.
Tests performed by the US Army have shown that a NiCd cell needs to be discharged to at
least 0.6V to effectively break up the more resistant crystalline formation. During recondition,
the current must be kept low to prevent cell reversal. Figure 10-2 illustrates the battery
voltage during normal discharge to 1V/cell followed by the secondary discharge (recondition).
Figure 10-3 illustrates the effects of exercise and recondition. Four batteries afflicted with
various degrees of memory are serviced. The batteries are first fully charged, then discharged
to 1V/cell. The resulting capacities are plotted on a scale of 0 to 120 percent in the first
column. Additional discharge/charge cycles are applied and the battery capacities are plotted
in the subsequent columns. The solid black line represents exercise, (discharge to 1V/cell)
and the dotted line recondition (secondary discharge at reduced current to 0.4V/cell). On this
test, the exercise and recondition cycles are applied manually at the discretion of the research
technician.
Figure 10-3: Effects of exercise and recondition.
Battery A improved capacity on exercise alone; batteries B and C required recondition. A new battery with excellent
readings improved further with recondition.
Battery A responded well to exercise alone and no recondition was required. This result is
typical of a battery that has been in service for only a few months or has received periodic
exercise cycles. Batteries B and C, on the other hand, required recondition (dotted line) to
restore their performance. Without the recondition function, these two batteries would need to
be replaced.
After service, the restored batteries were returned to full use. When examined after six
months of field use, no noticeable degradation in the restored performance was visible. The
regained capacity was permanent with no evidence of falling back to the previous state.
Obviously, the batteries would need to be serviced on a regular basis to maintain the
performance.
Applying the recondition cycle on a new battery (top line on chart) resulted in a slight capacity
increase. This capacity gain is not fully understood, other than to assume that the battery
improved by additional formatting. Another explanation is the presence of early memory.
Since new batteries are stored with some charge, the self-discharge that occurs during
storage contributes to a certain amount of crystalline formation. Exercising and reconditioning
reverse this effect. This is why the manufacturers recommend storing rechargeable batteries
at about 40 percent charge.
The importance of exercising and reconditioning NiCd batteries is emphasized further by a
study carried out by GTE Government Systems in Virginia, USA, for the US Navy. To
determine the percentage of batteries needing replacement within the first year of use, one
group of batteries received charge only, another group was exercised and a third group
received recondition. The batteries studied were used for two-way radios on the aircraft
carriers USS Eisenhower with 1500 batteries and USS George Washington with 600 batteries,
and the destroyer USS Ponce with 500 batteries.
With charge only (charge-and-use), the annual percentage of battery failure on the USS
Eisenhower was 45 percent (see Figure 10-4). When applying exercise, the failure rate was
reduced to 15 percent. By far the best results were achieved with recondition. The failure rate
dropped to 5 percent. Identical results were attained from the USS George Washington and
the USS Ponce.