Báo cáo khoa học: "Three-dimensional CT angiography of the canine hepatic vasculature" pdf
Bạn đang xem bản rút gọn của tài liệu. Xem và tải ngay bản đầy đủ của tài liệu tại đây (3.18 MB, 7 trang )
JOURNAL OF
Veterinary
Science
J. Vet. Sci. (2008), 9(4), 407
413
*Corresponding author
Tel: +82-2-880-1278; Fax: +82-2-880-8662
E-mail:
Three-dimensional CT angiography of the canine hepatic vasculature
Yucheol Jeong, Changyun Lim, Sunkyoung Oh, Joohyun Jung, Jinhwa Chang, Junghee Yoon, Mincheol Choi
*
Department of Radiology, College of Veterinary Medicine, Seoul National University, Seoul 151-742, Korea
Eight Beagle dogs were anesthetized and were imaged using
a single channel helical CT scanner. The contrast medium
used in this study was iohexol (300 mg I/ml) and doses were
0.5 ml/kg for a cine scan, 3 ml/kg for an enhanced scan. The
flow rate for contrast material administration was 2 ml/sec for
all scans. This study was divided into three steps, with
unenhanced, cine and enhanced scans. The enhanced scan
was subdivided into the arterial phase and the venous phase.
All of the enhanced scans were reconstructed in 1 mm
intervals and the scans were interpreted by the use of
reformatted images, a cross sectional histogram, maximum
intensity projection and shaded surface display. For the cine
scans, optimal times were a 9-sec delay time post IV injection
in the arterial phase, and an 18-sec delay time post IV
injection in the venous phase. A nine-sec delay time was
acceptable for the imaging of the canine hepatic arteries by
CT angiography. After completion of arterial phase scanning,
venous structures of the liver were well visualized as seen on
the venous phase.
Keywords:
angiography, computed tomography, dual phase,
liver vasculature, three-dimensional image
Introduction
Computed tomography angiography (CTA) is a simple and
noninvasive procedure for the evaluation of the hepatic
vasculature. Although conventional angiography can also
provide assessment of the hepatic vasculature, the modality
is invasive and more technically difficult to perform than
CTA. CTA is replacing conventional angiography in the
depiction of the normal vascular anatomy and the diagnosis
of vascular disorders [10]. However, CTA two-dimensional
(2D) images do not provide complete three-dimensional
images of the hepatic vascular anatomy. As three-dimensional
(3D) reconstruction provides more comprehensive and
accurate anatomic information, 3D CTA is a useful method
to improve the limitations of the use of 2D images.
Three-dimensional CTA represents an increasingly important
clinical tool that is used to diagnose portal hypertension and
hepatic vascular disorders. These disorders include the
presence of a single or multiple extrahepatic portosystemic
shunt, intrahepatic portosystemic shunt, portal vein thrombosis,
intravascular tumor extension, and well-developed vascular
tumors such as a hepatocellular carcinoma, liver or pancreatic
neoplasia. Three-dimensional CTA is also used to evaluate
suspected liver disease, and is used for surgical planning
[1,3,9,11].
In veterinary medicine, CT portography has been performed
in normal dogs and in veterinary subjects with portosystemic
shunts [3] to develop the dual-phase CT angiography
technique for normal dogs [11]. However, methods of 3D
reconstruction and 3D CTA analysis for the canine hepatic
vasculature have not been investigated. The objectives of
this study are 1) to develop the CTA technique for imaging
of the canine hepatic vasculature and 2) to describe the
anatomy of the hepatic vasculature with the use of 3D CTA.
Materials and Methods
Animals
Eight healthy Beagle dogs, ranging from 1 to 4 years old
and weighing 6 to 12 kg were used in the study. A 22 G
indwelling catheter was placed in a cephalic vein and was
connected to a CT power injector (LF CT9000 ADV;
Liebel-Flarsheim, USA) by an extension line (Control
pressure line; Hyup Sung Medical, Korea).
Contrast media
Non-ionic iodine contrast media, iohexol (Omnipaque
300 mg Iodine/ml; Amersham Health, UK) was used for
cine scans and for enhanced scans. Contrast media was
injected by the use of a CT power injector and all injection
rates were 2.0 ml/sec.
Helical CT scaning and parameters
CT angiography was performed using a single slice
helical CT scanner (GE CT/e; GE Healthcare, USA). The
CT programs for image analysis were as follows. 1) The
408 Yucheol Jeong et al.
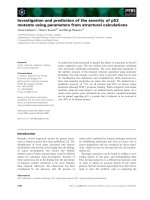
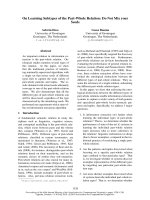
Fig. 1. A time-attenuation graph. On cine scan images, the region of interest (ROI) was set up in the center of the aorta, and then a
time-attenuation graph was constructed from the ROI.
use of cine CT; 2) the use of a retrospective reconstruction
program; 3) the use of a reformatted program (for axial,
sagittal, transverse and oblique plane images); 4) the use of
a cross section histogram for measurement of Hounsfield
units (HU) in the 2D plane; 5) the use of a 3D display of
shaded surface display (SSD) and maximum intensity
projection (MIP).
Experimental animal preparation for CT scanning
General anesthesia was performed to avoid motion artifacts
and breath holding was induced by hyperventilation. The
position of the animals was dorsal recumbency and the heads
of the dogs were placed toward the CT gantry.
Experimental design
Unenhanced scan: Unenhanced scans were performed to
determine the location of the cine scan, the scan field range
of the enhanced scan and to measure pre-contrast HU
values of the aorta (AO), caudal vena cava (CVC), portal
vein (PV) and liver. Conditions included a 5 mm thickness,
3 mm interval, 1.5 pitch, 120 kVp and 40∼60 mA in each
animal. Scans were started from the cranial aspect of the
diaphragm to the caudal aspect of the fourth lumbar
vertebra. After the unenhanced scan was performed, the
cine scan location, scan field range of the enhanced scan
and pre-contrast HU values of each vessel and the liver at
the cine scan location were determined.
Cine scan: In the cine scan, operating conditions of a 3 mm
thickness, 120 kVp, 30∼55 mA, 1.5 sec per rotation scan
speed and 50 serial axial images for 78 sec were performed.
The cine scan was performed at the site of the well visualized
AO, CVC, PV and liver at the thirteenth thoracic vertebra
level. This scan was performed in order to obtain time-
attenuation curves of the injected iohexol (0.5 ml/kg). With
the use of time-attenuation curves, the delay time for helical
CT acquisition was obtained. Time-attenuation curves of the
AO, CVC and PV were achieved by using a hardwired basic
CT program on the CT unit (Fig. 1).
Enhanced scan: The enhanced scan was divided into the
arterial phase and the venous phase. Arterial phase images
were obtained by caudocranial data acquisition and venous
phase images were obtained by craniocaudal acquisition to
minimize time during the dual phase scan. The enhanced
scan was performed by using the following parameters of
a 5 mm thickness, 5 mm interval, 120 kVp, 40∼60 mA and
1.3∼1.5 pitch. Time-attenuation data were used to optimize
the delay of CTA image acquisition following IV injection
of contrast medium to maximize hepatic vessel opacification.
A delay time was applied to arterial phase scanning. The
venous phase was started directly after the arterial phase
scan termination. The contrast medium dose used was 3
ml/kg. All enhanced phase data were reconstructed to 1
mm interval images retrospectively.
Statistical analysis
Statistical analysis was performed by the use of SPSS
software (SPSS 12.0.0; SPSS, Chicago, IL USA). A one-
way ANOVA least significant difference test was applied
for quantitative data analysis. The Kruskal-Wallis test and
Mann-Whitney U test were applied for qualitative data
analysis [1,2].
Results
Pre-contrast HU
With the use of unenhanced scan images, the HU values of
the AO, CVC, PV, and liver were measured in the determined
cine scan location (Table 1). Regions of interest (ROI) were
Three-dimensional CT angiography of the canine hepatic vasculature 409
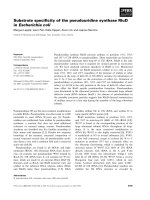
Fig. 2. The delay time was confirmed in the aorta through a
time-attenuation graph. The threshold (dash arrow) was
b
aseline
Hounsfield unit value (open arrow) added on 20 Hounsfield uni
t
(HU). The delay time (arrow) was the first time that exceeded
over this threshold.
Tabl e 2. Initial and peak intensifying time and Hounsfield unit (HU) values
Aorta Caudal vena cava Portal vein Liver
Initial time (sec)
Initial HU
Peak time (sec)
Peak time HU
9.30 ± 0.94
55.24 ± 9.00
12.15 ± 1.65
175.95 ± 33.08
17.80 ± 1.89
54.67 ± 9.37
22.2 ± 3.66
85.36 ± 14.17
21.96 ± 5.02
55.49 ± 8.34
32.61 ± 9.92
73.4 ± 8.17
-
-
52.61 ± 5.07
76.64 ± 6.60
n = 29, Contrast media dose = 0.5 ml/kg, psi = 47.44 ± 14.34. All data represent mean ± SD.
Tabl e 1. Pre-contrast Hounsfield unit values of the aorta (AO), caudal vena cava (CVC), portal vein (PV) and liver
AO CVC PV Liver
Mean ± SD (n = 29) 34.31 ± 6.99 33.75 ± 6.18 32.79 ± 5.47 56.15 ± 8.51
Table 3. Delay time and consumed scan time of the enhanced scan
Arterial delay
(sec)
Venous
delay
Arterial
scan time
Venous
scan time
Scan delay
Real venous
scan delay
Full
scan time
9.07 ± 1.21 17.59 ± 2.36 23.95 ± 1.81 30.16 ± 2.42 4.29 ± 0.13 37.30 ± 1.99 67.56 ± 3.86
n = 29. All data represent mean ± SD.
set at above 80% of the vascular diameter in the center of the
vessels but not outside of the vessel outline. In the liver, the
ROI was placed in the liver parenchyma while avoiding
vessels.
Time-attenuation curves
Time-attenuation data were used to optimize the delay
time of the CTA image acquisition following IV injection
of contrast medium to maximize hepatic vessel opacification.
The time delay required for subsequent scans was defined
as the time post-onset of contrast administration to the rise
in the vessel HU as compared to the baseline HU plus 20
(Fig. 2). This delay time was applied to the enhanced scans.
The delay time of the arterial phase was set at 9 sec (Table
2). As the initial times were so close between the CVC and
PV that were approximately 18 sec and 22 sec, the delay
time of the venous phase was set at 18 sec of the initial time
of the CVC.
Delay time and enhanced scan periods: In the enhanced
scan, the arterial phase scan was started after applying the
delay time, and the venous phase scan was started
immediately after termination of the arterial phase. The
total enhanced scanning time was approximately 67 sec.
The consumed scan-time was recorded at each phase
(Table 3).
3D reconstruction: Vascular 3D mapping was performed
by use of a hardwired basic CT program on the CT unit. 3D
SSD reconstruction was applied to a threshold-based
reconstruction technique. The procedure of the threshold-
based reconstruction technique is that the 3D threshold is
increased in order to select opacified vessels. After
applying the 3D threshold, the 3D vascular structure was
seen and the background with low HU value was
eliminated. With the use of 3D reconstruction, reformatted
and MIP images, the anatomical location of each vessel
410 Yucheol Jeong et al.
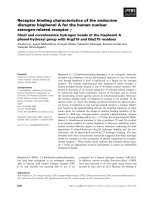
Fig. 3. Each vessel was confirmed anatomical location through shaded surface display (SSD), maximum intensity projection (MIP),
axial and oblique images (A and B). Rt. hepatic a. branch (arrows), Lt. Lateral hepatic vein (arrowheads).
Fig. 4. Hepatic vascular structures in three-dimensional (3D) shaded surface display images (A-H). Figs. A and B are arterial 3D
structures. Figs. C-H are portal and hepatic venous 3D structures (1 = aorta; 2 = celiac a.; 3 = hepatic a.; 4 = cranial mesenteric a.; 5 = lef
t
gastric a.; 6 = right gastric a.; 7 = gastroduodenal a.; 8 = right hepatic a. branch; 9 = left hepatic a. branch; 10 = main portal v.; 11 = crania
l
mesenteric v.; 12 = caudal mesenteric v.; 13 = right kidney; 14 = left kidney; 15 = gastroduodenal v.; 16 = caudate portal v.; 17 = right latera
l
p
ortal v.; 18 = right medial portal v.; 19 = gall bladder; 20 = right medial hepatic v.; 21 = quadrate hepatic v.; 22 = papillary hepatic v.;
23 = quadrate portal v.; 24 = left medial portal v.; 25 = left lateral portal v.; 26 = left lateral hepatic v.; 27 = caudal vena cava; 28 = caudat
e
hepatic v.; 29 = right lateral hepatic v.; 30 = left medial hepatic v.; 31 = papillary portal v.).
was confirmed (Figs. 3 and 4).
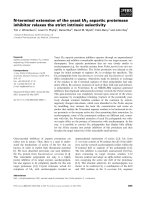
Quantitative measurement: With the use of a cross section
histogram (Fig. 5), the AO, CVC and PV were measured by
phases of the enhanced scans (Tables 4-6).
Discussion
Imaging methods for the hepatic vasculature include
conventional angiography, ultrasonography, and CTA.
Conventional angiography for the hepatic vasculature can
provide good vascular images. However, the use of the
modality is invasive to patients, has a relatively high cost as
compared to other methods [6], requires a difficult technique
of superselective catheterization for the hepatic arteries [8]
and is time consuming. Ultrasound is an expedient method
for imaging of the hepatic vasculature, but disadvantages
Three-dimensional CT angiography of the canine hepatic vasculature 411
Tabl e 4. Hounsfield unit values of the arteries as measured in the arterial phase
AO CA HA GD RG LG RB LB
Group A
(n = 8)
Group B
(n = 8)
Group C
(n = 8)
369.25
a
±
114.53
518.75
b
±
143.52
588.38
b
±
99.30
331.71 ±
25.73
309.75 ±
66.73
323.88 ±
65.97
265.25
a
±
58.41
367.38
b
±
39.82
368.87
b
±
104.27
178.60
a
±
29.81
212.38 ±
47.32
245.13
b
±
48.84
135.33
a
±
10.12
192.25
b
±
41.69
206.63
b
±
42.62
183.38 ±
18.89
171.13
a
±
47.00
218.50
b
±
42.67
118.00
a
±
8.49
148.07 ±
30.16
165.30
b
±
22.21
116.00
a
±
18.38
152.60
a
±
29.95
203.36
b
±
44.75
a,b
There is statistical significance between a and b within columns (p < 0.05). All data represent mean ± SD. Group A = 2 ml/kg; Group B
=
3 ml/kg; Group C = 4 ml/kg. AO = aorta; CA = celiac artery; HA = hepatic artery; GD = gastroduodenal artery; RG = right gastric artery; LG
= left gastric artery; RB = right hepatic artery branch; LB = left hepatic artery branch.
Fig. 5. Average pixel intensity values were measured by defined area (arrows).
include the disparity of accuracy between sonographers [3]
and many factors such as bone, gas and fat that can interfere
with the transmission of the ultrasound beam [2].
CTA provides a fast, noninvasive modality for the
evaluation of the hepatic vasculature. The use of a helical
CT scan with the advanced 3D display technique provides
detailed anatomic images of the hepatic vasculature and
requires little time. It is also less than one-third the cost of
conventional angiography, and is not dependent on the
skill of the operator performing the study or on the body
habitus of the patient [6].
The most important parameter of the hepatic CTA was the
‘time delay’ between the injection of contrast medium and
image acquisition. When the delay time is applied to a
scan, it permits scanning during maximal enhancement. In
this study, the optimal delay time was set at 9 sec in the
arterial phase and at 18 sec in the venous phase. This
protocol offered good vascular enhancement.
412 Yucheol Jeong et al.
Tabl e 5. Hounsfield unit values of the portal veins in the venous phase
MP
*
SV
*
CPV
*
RLPV
*
RMPV
*
QPV
*
LMPV
*
LLPV
*
Group A
(n = 8)
Group B
(n = 8)
Group C
(n = 8)
179.25 ±
16.99
233.25 ±
13.93
299.63 ±
50.11
164.75 ±
17.60
205.25 ±
23.30
252.63 ±
25.99
163.75 ±
18.27
216.75 ±
11.87
264.88 ±
48.00
158.25 ±
17.09
199.38 ±
11.82
251.75 ±
47.62
151.38 ±
15.02
203.50 ±
13.15
256.13 ±
24.22
146.13 ±
12.43
180.75 ±
12.53
232.13 ±
23.78
150.00 ±
14.37
201.50 ±
16.79
249.00 ±
33.40
149.88 ±
12.22
195.38 ±
10.25
246.25 ±
29.49
*
There is statistical significance among groups (p < 0.01). All data represent mean ± SD. MP = main portal vein; SV = splenic vein; CPV =
caudal portal vein; RLPV = right lateral portal vein; RMPV = right medial portal vein; QPV = quadrate portal vein; LMPV = left medial
p
ortal
vein; LLPV = left lateral portal vein.
Tabl e 6. Hounsfield unit values of the hepatic veins in the venous phase
CVC
*
CHV* RLHV* RMHV* QHV* LMHV* LLHV*
Group A
(n = 8)
Group B
(n = 8)
Group C
(n = 8)
161.38 ± 15.32
202.00 ± 17.90
274.75 ± 37.31
164.00 ± 8.99
209.75 ± 24.15
274.75 ± 36.46
167.63 ± 18.26
210.75 ± 10.48
289.25 ± 39.07
155.57 ± 18.36
190.14 ± 21.47
250.87 ± 52.67
156.33 ± 8.96
181.57 ± 20.32
242.86 ± 44.97
156.86 ± 15.27
193.14 ± 23.00
251.86 ± 52.60
164.16 ± 12.46
206.86 ± 21.78
278.00 ± 52.19
*
There is statistical significance among groups (p < 0.05). All data represent mean ± SD. CVC = caudal vena cava; CHV = caudal hepatic
vein; RLHV = right lateral hepatic vein; RMHV = right medial hepatic vein; QHV = quadrate hepatic vein; LMHV = left medial hepatic vein;
LLHV = left lateral hepatic vein.
Although the venous delay time was set at 18 sec by the
use of a cine scan, the actual real venous phase scan started
at 20 sec later for the ideal venous delay time. This was due
to the contrast medium injection delay time, the time
required for arterial phase scanning and the scan delay in
the CT scanner itself between arterial phase scanning and
venous phase scanning. In spite of this retardation, it did
not affect the image quality.
In all phases of the CT scan, vascular HU values increased
as much as the contrast media dose increased. During the
arterial phase, there were patterns of increasing vascular
HU values, but there was no statistical difference in the HU
values despite the dose increase. It was deduced that the
opacified difference related to contrast dose did not appear
prominent as arteries have characteristics of fast opacifying,
deopacifying after contrast media injection and have a
relatively smaller size than veins. In the venous phase,
there were remarkable opacified differences that were seen
related to contrast dosage.
In most CT angiography procedures in humans, an
injection rate of various iodine concentrations is used in a
range of 1.5∼5 ml/sec [3]. For arterial 3D construction, 5
ml/sec is necessary to achieve a greater intravascular
concentration and therefore a higher CT attenuation. Since
aberrant hepatic arteries can be relatively small, they need
to show sufficient enhancement so that they are not
obscured during 3D threshold-based reconstruction [5].
However, in the portal and venous phase, the effect of
bolus injection is gradually diminished and a higher
injection rate causes a narrow “temporal window” (duration
of optimal enhancement) [3]. As these factors and with a
single channel helical CT limitation, although the arterial
bolus effect was decreased, a rate of 2 ml/sec was chosen in
this study as the injection rate.
With the use of the MIP technique, vascular anatomy is
best depicted when there is a large difference between the
attenuation values of vessels opacified by use of contrast
agent and the surrounding tissues. However, MIP lacks
depth orientation, and the technique is not as capable to
display complex anatomy, especially when overlapping
vessels are present [10].
Traditional helical single-slice CT scanners are still limited
in the ability to image large volumes during a single breath-
hold and to provide adequate spatial resolution crucial for
CT angiography [6]. In this study, due to the limitation of
the use of a single channel helical CT scanner, a wide slice
thickness and narrow scan range including the liver and the
full vascular structures was used. This limitation has
prompted the development of faster multidetector helical
CT scanners (MDCT) that can cover an extensive volume
Three-dimensional CT angiography of the canine hepatic vasculature 413
quickly with excellent spatial resolution [6]. The use of
MDCT can overcome the limitations of hepatic CTA that
occur with the use of a single channel CT scanner.
In conclusion, 3D CTA has been shown as a useful method
for the evaluation of the canine hepatic vasculature.
References
1. Awai K, Takada K, Onishi H, Hori S. Aortic and hepatic
enhancement and tumor-to-liver contrast: analysis of the ef-
fect of different concentrations of contrast material at mul-
ti-detector row helical CT. Radiology 2002, 224, 757-763.
2. Carlisle CH, Wu JX, Heath TJ. Anatomy of the portal and
hepatic veins of the dog: a basis for systematic evaluation of
the liver by ultrasonography. Vet Radiol Ultrasound 1995,
36, 227-233.
3. Frank P, Mahaffey M, Egger C, Cornell KK. Helical com-
puted tomographic portography in ten normal dogs and ten
dogs with a portosystemic shunt. Vet Radiol Ultrasound
2003, 44, 392-400.
4. Han JK, Choi BI, Kim AY, Kim SJ. Contrast media in ab-
dominal computed tomography: optimization of delivery
methods. Korean J Radiol 2001, 2, 28-36.
5. Henseler KP, Pozniak MA, Lee FT Jr, Winter TC 3rd.
Three-dimensional CT angiography of spontaneous porto-
systemic shunts. Radiographics 2001, 21, 691-704.
6. Katyal S, Oliver JH 3rd, Buck DG, Federle MP. Detection
of vascular complications after liver transplantation: early
experience in multislice CT angiography with volume
rendering. AJR Am J Roentgenol 2000, 175, 1735-1739.
7. Maher MM, Kalra MK, Sahani DV, Perumpillichira JJ,
Rizzo S, Saini S, Mueller PR. Techniques, clinical applica-
tions and limitations of 3D reconstruction in CT of the
abdomen. Korean J Radiol 2004, 5, 55-67.
8. Schmidt S, Lohse CL, Suter PF. Branching patterns of the
hepatic artery in the dog: arteriographic and anatomic study.
Am J Vet Res 1980, 41, 1090-1097.
9. Smith PA, Klein AS, Heath DG, Chavin K, Fishman EK.
Dual-phase spiral CT angiography with volumetric 3D ren-
dering for preoperative liver transplant evaluation: prelimi-
nary observations. J comput Assist Tomogr 1998, 22, 868-
874.
10. Urban BA, Ratner LE, Fishman EK. Three-dimensional
volume-rendered CT angiography of the renal arteries and
veins: normal anatomy, variants, and clinical applications.
Radiographics 2001, 21, 373-386.
11. Zwingenberger AL, Schwarz T. Dual-phase CT angiog-
raphy of the normal canine portal and hepatic vasculature.
Vet Radiol Ultrasound 2004, 45, 117-124.