Báo cáo lâm nghiệp: "Predicting site productivity and pest hazard in lodgepole pine using biogeoclimatic system and geographic variables in British Columbia" potx
Bạn đang xem bản rút gọn của tài liệu. Xem và tải ngay bản đầy đủ của tài liệu tại đây (268.86 KB, 12 trang )
31
Ann. For. Sci. 62 (2005) 31–42
© INRA, EDP Sciences, 2005
DOI: 10.1051/forest:2004089
Original article
Predicting site productivity and pest hazard in lodgepole pine using
biogeoclimatic system and geographic variables in British Columbia
Harry X. WU
a
*, Cheng C. YING
b
, Hong-Bo JU
c
a
PO Box E4008, Kingston, Canberra, ACT 2604, Australia
b
Research Branch, BC Ministry of Forests, 712 Yates Street, Victoria, British Columbia V8W 3E7, Canada
c
Heilongjiang General Bureau of Forest Industry, Harbin, China
(Received 18 March 2003; accepted 19 April 2004)
Abstract – A series of 60 lodgepole pine provenance tests was planted throughout the interior of British Columbia in 1974 to predict
productivity and pest hazard based on ecological classification and geographical variables. These 60 tests cover eight biogeoclimatic zones and
25 subzones within the biogeoclimatic ecosystem classification (BEC) in British Columbia. Ten provenances are common among
60 provenances tested at each site. Mean height (20-year) was measured at 57 of the 60 sites, incidence of western gall rust assessed at 56 sites,
terminal weevil at 49 sites, and needle cast at 50 sites. There is large site-to-site variation in all traits. Geographic models using latitude,
longitude and elevation of test site location as predictors explained 47%, 35%, 33%, 27% and 8% of site variation for height, survival, incidence
of needle cast, terminal weevil and western gall rust, respectively. BEC zones accounted for about the same amount of the site variation as
geographic models, suggesting both accounted for the effect of site environments relating mainly to temperature and precipitation. Within BEC
zones, site variation in height seems to be related to subzones associated with moisture gradient, but not temperature. Sites in the moist, mild
ICH subzone and the dry, cool MS subzone along the southern Rocky Mt. Trench represent the best forest land for intensive silviculture of
lodgepole pine, being highly productive with low pest hazard except needle cast. These sites are followed in productivity by sites across the
vast interior stretching from the Skeena/Bulkley river basin in the northwest (moist SBS subzone), to the interior wetbelt on Shuswap-Quesnel
Highland (moist, cool ICH subzone), and the Thompson Plateau in the southern interior, where lodgepole pine grew well with relatively low
pest hazard at most sites.
site productivity / pest hazard / western gall rust / needle cast / terminal weevil / ecological system
Résumé – Prévoir la productivité des stations et les risques liés aux insectes nuisibles chez Pinus contorta en utilisant un système
bioclimatique et des variables géographiques en Colombie Britannique. Une série de 60 tests de provenances de Pinus contorta ont été
plantés à travers l’intérieur de la Colombie britannique pour prédire la productivité et les risques liés aux insectes nuisibles sur la base d’une
classification écologique et de variables géographiques. Ces 60 tests couvrent 8 zones bioclimatiques dans le système de Classification
bioclimatique des écosystèmes (BEC) en Colombie Britannique. Dix provenances étaient communes parmi les 60 provenances testées dans
chaque station. La hauteur moyenne (à 20 ans) a été mesurée dans 57 des 60 stations, l’incidence de la rouille de l’écorce fixée dans 56 stations,
le charançon des apex terminaux dans 49 stations et la chute des aiguilles dans 50 stations. Il y a une grande variation dans tous les traits d’une
station à l’autre. Un modèle géographique utilisant la latitude, la longitude et l’altitude de la station considérée comme prédicateurs explique
47 %, 35 %, 33 %, 27 %, et 8 % de la variation selon les stations respectivement pour la hauteur, la survie, l’incidence sur la chute des aiguilles,
le charançon des apex terminaux et l’incidence de la rouille de l’écorce. Les zones BEC comptent pour environ la même valeur que les variations
de station dans les modèles géographiques, suggérant que tous les deux comptent pour les effets de station qui se rapportent principalement à
la température et aux précipitations. Dans les zones BEC, les variations de hauteurs liées à la station semblent être reliées aux sous-zones
associées à des gradients d’humidité mais pas à la température. Les stations situées dans des sous-zones humides, les sous-zones douces (ICH)
et les sous-zones sèches, fraîches (MS) au sud-ouest de Rocky Mt. Trench représentent le meilleur terrain pour une sylviculture intensive de
Pinus contorta avec une haute productivité et des risques faibles liés aux insectes nuisibles excepté pour la chute des aiguilles. Ces sites ont été
suivis pour la productivité des stations à travers le vaste intérieur en élargissant depuis le bassin de rivière Skeena/Bulkey dans le nord-ouest
(sous-zone humide SBS) jusqu’à la zone intérieure humide dans les montagnes Shuswap-Quesnel (sous-zone ICH, humide et fraîche) et le
plateau Thompson dans le sud-ouest intérieur où le Pinus contorta pousse bien avec des risques relativement faibles de dégâts d’insectes
nuisibles dans les stations humides.
productivité des stations / risques liés aux insectes nuisibles / rouille de l’écorce / chute des aiguilles / charançon des apex / système
écologique
* Corresponding author:
32 H.X. Wu et al.
1. INTRODUCTION
Lodgepole pine (Pinus contorta Dougl.) is the most wide-
ranging and one of the most variable pines in North America
[4]. This species is notable for its adaptation to a wide range of
environments, from low elevation, coastal bogs to alpine condi-
tions, and occurs naturally in 12 out of the total 14 biogeocli-
matic zones in British Columbia (BC) [25]. It is a major component
species of natural forests in the following six biogeoclimatic
zones: Montane Spruce (MS), Sub-Boreal Spruce (SBS),
Engelmann Spruce-Subalpine Fir (ESSF), Boreal White and
Black Spruce (BWBS), Interior Cedar-Hemlock (ICH) and
Interior Douglas-Fir (IDF) in BC.
Lodgepole pine has been the primary reforestation species
in BC since the 1960s [13]. To facilitate selection of the best
provenances and the best sites for the reforestation, long-term
field tests involving more than 150 provenance samples were
established at about 70 locations in the Yukon and BC from
1968 to 74 [46]. In BC, test results indicated large provenance
variation in geographic patterns in growth and cold hardiness
[41, 42, 45] and pest incidences [39, 44], and high gain through
provenance selection and genetic manipulation in stem volume
[43] and pest resistance [40]. The results have been used to
develop seed transfer guidelines and are incorporated into tree
improvement.
Efficient forest management has to be ecologically site spe-
cific. Various approaches have been attempted to establish cor-
relations of site climatic, edaphic and biotic factors with site
productivity and pest hazards in lodgepole pine and other spe-
cies [1, 3, 29, 30]. In British Columbia, the biogeoclimatic eco-
system classification (BEC) of forest lands represents the first
step to achieve this goal of site-specific forest management.
[16, 18, 26]. BC’s BEC system is a hierarchical stratification
of forest lands into zone, subzone and variant with increased
uniformity in regional climate (vegetation-inferred); organiza-
tion of forest ecosystems into BEC classifications involves the
interpretative synthesis of landscape patterns, regional climates
and vegetation types assuming their interactive dynamics is the
causal process in the formation of forest and plant communities
[26]. Within this framework of BEC classification, research has
been focused on establishing a predictive relationship between
site productivity and ecological site quality indicators, but
mostly concentrated in the coastal region with Douglas-fir
(Pseudotsuga menziesii [Mirb] Franco. var. glauca) and west-
ern hemlock (Tsuga heterophylla [Raf.] Sarg.) [5, 6, 15]. The
same effort has been expanded to interior spruce (Picea engel-
mannii Parry and P. glauca (Moench) Voss) and lodgepole pine
(Pinus contorta Dougl.) in site productivity [20, 34, 35] and
pest hazards [19].
The obvious disadvantage of correlating site productivity or
pest hazard to ecological factors using natural forests is the lack
of control over stand history, e.g. stand genetic composition and
other factors such as heterogeneous age, space. Evidence sug-
gests genetic factors may be better able to track site productivity
than ecological factors. Monserud and Rehfeldt [23] reported
the genetic factor alone accounted for 40% of site index vari-
ation among 135 natural stands of Douglas-fir (Pseudotsuga
menziesii var. glauca), one-third more efficient than environ-
mental factors. Monserud [22] found that provenance origin
(elevation in particular) explained more site index variation
than the best set of environmental factors. In addition, lack of
control of factors such as competition, microsite variation, and
the interactions between ecological factors and stand genetic
composition can further erode statistical power to reveal cau-
sality. Plantations with similar genetic background and uniform
silviculture treatments like provenance and progeny tests
would minimize the influence of these confounding factors.
Unfortunately, provenance and progeny tests in most cases are
confined to a limited site environment at only a few locations.
BC’s core series of the lodgepole pine provenance testing
established at 60 locations throughout the Interior offers a rare
opportunity to study site variability in productivity and pest
hazards since the experiment plots were designed with control
of genetic composition, stand age, and competition. In this
paper we report site variation in 20-year height and pest inci-
dence of western gall rust (Endocronartium harknessii (J.P.
More) Y. Hirat.), needle cast (Lophodermella concolor (Dern)
Darker) and terminal weevil (Pissodes terminalis Hopping)
attack, and construct their predictive relationships with BEC
classification and site geographic location (latitude, longitude
and elevation), with the main objective to delineate sites where
plantation of lodgepole pine will most likely succeed – high
productivity and low pest hazard.
Ecologically, lodgepole pine is a pioneer (early seral) spe-
cies with low shade tolerance and rapid juvenile growth [24].
Growth at age 20 is sufficient to represent productivity at
mature age. In mature stands, lodgepole pine tends to be
replaced by more shade-tolerant, later seral species such as
white and black spruce (Picea glauca, Picea mariana) and
western hemlock (Tsuga heterophylla) unless burned by wild
fires [2]. Forest fire plays an integral role in the ecology and
regeneration of lodgepole pine natural stands, particularly for
the subspecies latifolia in Rocky Mountains. Its serotinous
cones require high intensity of heat to open and release the seeds
[17].
Western gall rust and needle cast are two common diseases
in many lodgepole pine plantations which can cause severe
reduction in productivity and stem quality. Severe damage of
lodgepole pine trees caused by western gall rust has been
widely reported [7, 8, 27, 48]. Widespread needle cast infection
of both natural and plantation lodgepole pine in recent years has
aroused the concerns of BC foresters [38]. Accumulated results
in British Columbia and the United States indicate the existence
of high genetic resistance to both diseases in some provenances
of lodgepole pine [9, 12, 44, 47]. Lodgepole pine terminal wee-
vil usually attacks vigorous shoot terminal and causes terminal
dieback of the current year’s growth. The attack of terminal
weevil on lodgepole pine not only causes loss of tree growth,
but also reduces timber quality by inducing forked and crooked
stems.
2. MATERIALS AND METHODS
2.1. Test site and provenance sample
The 60 provenance tests that represent the core of BC’s lodgepole
pine provenance program were planted in the same year (spring 1974)
with the same stock type (2 + 1 bareroot) raised at the same nursery
(Red Rock Research Station, Prince George). They were organized
Predicting site productivity and pest hazard 33
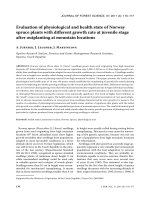
into 12 geographic regions delineated according to latitude and pre-
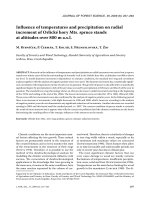
cipitation [14, 45]. Within each region, five sites were selected so that
major local site variables, such as soil and elevation, could be sampled
(Fig. 1 and Tab. I). The 60 sites span approximately 11° of latitude
(49° 05’ to 59°
47’), 15° of longitude (114°
41’ to 129°
08’) and 1450 m
of elevation (380 to 1830 m ), and cover eight biogeoclimatic zones
(Tab. II) where lodgepole pine is the major component species in nat-
ural forests except the Spruce-Willow-Birch zone [25]. Fifty of the 60
sites are located in four BEC zones, ICH, SBS, MS and ESSF (Tab. II).
These four BEC zones are referred to as major zones in this paper, and
their climatic and geographic features are described in Table II [21].
All the test sites are typical lodgepole pine sites with the exception of
Table I. Summary of location of the 60 lodgepole pine provenance test sites, and zonal average of latitude, longitude, elevation, 20-year height
and pest score of western gall rust (GT), terminal weevil (WT) and needle cast (NC).
Region No. of site Latitude Longitude Elevation (m) Height (CM) Survival (%) GT WT NC
1 5 49.58 115.74 1390 689.2 83.3 0.39 0.07 2.30
2 5 49.69 117.90 1468 678.0 85.5 1.86 0.22 2.34
3 5 50.24 119.92 1406 622.6 85.1 0.64 0.54 1.88
4 5 51.31 117.28 1170 657.4 86.4 1.31 0.21 2.25
5 5 51.99 120.71 1154 671.8 81.9 0.84 0.30 2.54
6 5 51.75 122.35 1176 506.4 78.9 0.17 0.41 2.37
7 5 53.25 120.16 884 846.4 81.8 2.54 0.35 1.60
8 5 53.26 122.30 950 685.0 82.4 2.74 0.43 2.14
9 5 53.65 124.71 966 613.4 83.9 0.85 0.30 2.02
10 5 55.02 123.70 818 711.2 89.6 4.71 0.58 1.64
11 5 54.85 127.05 760 697.2 88.6 0.17 0.53 1.60
12 5 59.09 125.71 668 289.3 58.8 1.94 0.21 1.84
Table II. Summary of climatic and geographic description of the eight biogeoclimatic zones where the 60 tests are located
1
.
Zone Code No. sites MAT (°C) MAP (mm) General features
Interior Cedar-Hemlock ICH 14 2.0–8.7 500–1200 Low to mid-elevation windward slope east of Rocky Mts. in southeast
BC and Nass/Skeena river basins east of Coastal Mts. in northwest BC;
the most productive forest zone having the highest diversity in tree
species in Interior
Mountain Spruce MS 8 0.5–4.7 380–900 Mid-elevation southern Interior Plateau, leeside of Coast and Cascade
Mts., and southern Rocky Mts. Climatically, a transitional zone
between IDF and ESSF; cold winter and short, warm summer
Sub-Boreal Spruce SBS 20 1.7–5.0 440–900 Montane zone in central interior from valley bottom to about 1200 m;
cold, dry winter and cool, dry summer; climatically a broad transition
from the warmer-drier IDF in south, drier-warmer SBPS in southwest,
and colder boreal forests in north and high elevation subalpine forests
2
Engelmann Spruce-
Subalpine Fir
ESSF 8 –2.0–2.0 400–2200 The uppermost forested lands below alpine tundra, extending to the
southern three quarters of Interior; cold, moist and snowy climate
with snow accounting for 50–70% of precipitation
Interior Douglas-fir IDF 3 1.6–9.5 300–750 Low to mid-elevation of the valley terrain of the southern Interior Plateau
and southern Rocky Mt. Trench, extending to the lee side of Coastal
Mts.; long growing season with warm, dry summers and cool winters
Sub-Boreal Pine-Spruce SBPS 2 0.3–2.7 335–580 Montane zone on the high elevation plateau in the rainshadow of
Coastal Mts., above IDF, below MS and SBS, with cold, dry winters
and cool, dry summers
2
Boreal White and
Black Spruce
BWBS 4 –2.9–2.0 330–570 An extension of the Great Plains (Alberta Plateau) into the lower ele-
vation of the main valley west of Rocky Mts. in northern BC; short
growing season with long, very cold winters
Spruce-Willow-Birch SWB 1 –0.7–3.0 460–700 The most northerly subalpine zone in BC above BWBS; long. cold
winter and cool and brief summer
1
Information based on Meidinger D. and Pojar J. (Eds.) 1991. Ecosystems of British Columbia. BC Ministry of Forests, Special Report Series 6, 330 p.
2
No data from one high elevation site in ESSF because of access difficulty and two sites in BWBS lost to road construction and other accidents.
MAT = mean annual temperature; MAP = mean annual precipitation.
34 H.X. Wu et al.
the highest elevation site at Terraced Peak (1830 m) where Engelmann
spruce (Picea engelmannii) and subalpine fir (Abies lasiocarpa) dom-
inate the forest landscape and Goat River in ICH where western red-
cedar (Thuja plicata), western hemlock (Tsuga heterophylla) and
white spruce (Picea glauca) are the major components in original
stands. Two sites in region 12 (Mile 250 and Kledo Cr.) (Fig. 1) were
abandoned because of damage caused by road construction and high
early mortality, and one high elevation site in region 2 (Terraced Pk.)
was not assessed because of difficulty of access. At each site, a subset
of 60 provenances from a total of 142 populations collected range-
wide were planted in two blocks in a completely randomized block
design with individual provenances planted in a 3 by 3 tree square plot
with 2.5 m spacing. The 60 provenances comprised, all populations
indigenous to the region, most populations from adjacent regions, and
a few from the extremes of the species’ range. There were 30–40 prov-
enances overlapping between adjacent regions and 10 standard prov-
enances representing the species entire range were tested at all the
60 tests. Provenance variation and provenance by site interaction using
the 10 standard provenances were examined in a previous study [41].
2.2. Data collection
Height of individual trees was measured at all 57 sites in the fall
of 1994, 20 years after planting using a laser gun. Incidence of western
gall rust, needle cast and terminal weevil attack were assessed during
the summer months of 1993 (24 sites), 94 (30 sites) and 95 (3 sites).
These three pests were the common ones at the provenance test sites
and can cause severe damage to plantation lodgepole pine. Western
gall rust was assessed at 56 sites, needle cast at 50 sites and terminal
weevil at 49 sites (Tab. I).
Total number of galls on both branches and main stem were counted
for each tree; the woody, globose perennial galls caused by the rust
are simple to recognize. The terminal weevil attacks and kills the
leader terminals. Fading leaders indicate current weevil activity; and
dead stubs on the stem where forking or crooking occurred are evi-
dence of previous years’ attacks [32]; so the presence of dead stub or
dying leader is recognized as attack and their total number along the
stem were counted. This probably underestimates the actual number
of attacks because snow, wind, branch rubbing, strong recovery of the
lateral, etc. can eliminate the stubs. Both the assessment of the stem
rust and weevil incidence were an estimate of cumulative attack. Nee-
dle cast infection for individual trees was rated according to percentage
needle infection: 1 = less than 5% needles infected; 2 = 5 to 25% nee-
dles infected; 3 = 25 to 50% needles infected; 4 = 50–75% needles
infected; 5 = over 75% needles infected. It was based on the current
year infection; assessment of cumulative needle cast infection is not
Figure 1. Locations of the 60 lodgepole pine provenance tests.
Predicting site productivity and pest hazard 35
practical because it is difficult, if not impossible, to distinguish from
other factors which may cause needle barren, e.g. male cone repro-
duction, frost, etc. Needle samples were sent for laboratory examina-
tion and Lophodermella concolor (Dern) Darker was identified as the
causing pathogen.
2.3. Data analysis
Site means of 20-year height and pest incidence were based on all
provenances as indicators of relative site productivity and pest haz-
ards. Nested analysis of variance was used to test the site effect asso-
ciated with BEC zones and subzones; subzone effects associated with
moisture and temperature gradients were further examined separately.
Pearson linear correlation was used to examine among-trait relation-
ships [31]. In an attempt to establish predictive relationship of site pro-
ductivity, survival rate and pest incidences with geographic variables
and BEC site classifications gradient, data were subjected to the fol-
lowing regression analyses:
(1) Stepwise regression screening of latitude, longitude, elevation,
and their squares and products as predictors. Site variation is consid-
ered continuous. The model was selected according to the criteria that
both the model and predictor variables were significant at 0.05 prob-
ability level and Mallow’s statistic (C
p
) was closest to the number of
predictor variables included in the model [36].
(2) Multiple regression by fitting BEC zones as qualitative varia-
bles (0 or 1) representing the 8 zones with test sites (Tab. II). Site var-
iation between zones is considered discrete.
(3) Multiple regression by fitting both BEC zones and subzones
associated with moisture gradient within each BEC zone (Tab. II) as
qualitative variables 0 or 1. Site variation is considered discrete at two
levels with subzones nested within zones. Only subzones associated
with moisture were examined as initial ANOVA indicated no signif-
icant association of temperature gradients with any of the traits. Both
temperature and precipitation are the determinant factors in BEC clas-
sification, temperature probably being the dominant one at zone level
delineation whereas moisture gradient which subjects to the modifi-
cation effect of local landform influences subzone classification [26].
Models 2 and 3 quantify the average site effect associated with indi-
vidual BEC zones and subzones which would allow the assessment
of the degree of discrete changes along BEC land classifications. Stand
error of model estimate was used as the criterion to judge the degree
of discontinuity. The purpose of the above regression analyses is (1) to
examine predictability of geographic coordinates (as surrogate envi-
ronmental variables) and BEC classification to account for site vari-
ability and (2) where, along the BEC classifications, discrete variation
may exist. One caution is that estimates of zone or subzone effect can
be spurious since sites are not equally distributed or represented in all
BEC units. However, as site choice was consciously made to sample
the temperature and precipitation gradients [14], estimate of zone
effect (at least the major zones) ought to be sound. All calculations
were furnished by SAS software package [28].
3. RESULTS
3.1. Height and survival
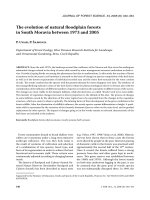
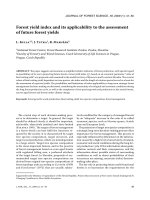
Trees at the most productive site grew four times larger than
at the least productive one in 20 years (10.1 m at Goat River
vs. 2.5 m at M451) (Tab. I and Fig. 2). As expected, sites in the
Figure 2. Effect of latitude, longitude, and elevation on tree height of lodgepole pine.
36 H.X. Wu et al.
ICH zone were the most productive ones (average 7.5 m); 5 of
the 10 most productive sites were in ICH. The least productive
sites were in SBW and BWBS zones in northern BC (Tab. I).
On average, sites in SBS were the second most productive ones
(6.8 m), followed by sites in MS zone (6.4 m), ESSF (6.3 m),
IDF (5.8 m) and SBPS (4.4 m). Thus, relative site productivity
of BEC zones as measured by these test sites seems to correlate
well with zonal climate (Tab. II). Differences in site mean height
among BEC zones were statistically significant (Tab. III). Dif-
ferences among BEC subzones within zones were also signif-
icant, but associated only with moisture gradient (Tab. IV), not
temperature gradient (Tab. V).
Mean site heights (Tab. I) are plotted in Figure 2; the geo-
graphic model accounted for 47% of its variation (Tab. VI)
which depicted a southeast-northwest trend with a curvilinear
elevation cline - site productivity declines as elevation or latitude/
longitude of site increases. BEC zones explained 56% of site var-
iation (Model 2, Tab. VII). Steep differentiation (degree of discrete
variation) occurred along the SWB-BWBS boundary (SWB
occupies the subalpine zone above BWBS, Tab. II), using the
standard error of the model estimate as the criterion (Tab. VII).
Differentiation along the SBPS zone boundary (dry high ele-
vation plateau) was also steep. Otherwise, between-zone differen-
tiation among other BEC zones was essentially continuous.
Table III. Effect of biogeoclimatic zone and subzone on site variation in height, survival and pest scores of western gall rust (GT), terminal
weevil (WT) and needle cast (NC).
Height Survival GT WT NC
Sources of variation df p.dfp.dfp.dfp.dfp.
Zone 7 0.001 7 0.00170.81370.02870.003
Subzone (zone) 16 0.015 16 0.293 16 0.743 15 0.205 15 0.043
Residual 33 33 32 26 27
Total 56 56 55 48 49
Table IV. Effect of biogeoclimatic zone and subzone associated with moisture gradients on site variation in height, survival and pest scores of
western gall rust (GT), terminal weevil (WT) and needle cast (NC).
Height Survival GT WT NC
Sources of variation df p.dfp.dfp.dfp.dfp.
Zone 7 0.001 7 0.001 7 0.597 7 0.046 7 0.014
Moisture (zone) 7 0.003 7 0.385 7 0.858 7 0.041 7 0.123
Residual 42 42 41 34 35
Table V. Effect of biogeoclimatic zone and subzone associated with temperature gradients on site variation in height, survival and pest scores
of western gall rust (GT), terminal weevil (WT) and needle cast (NC).
Height Survival GT WT NC
Sources of variation df p.dfp.dfp.dfp.dfp.
Zone 7 0.001 7 0.001 7 0.778 7 0.057 7 0.003
Temperature (zone) 9 0.278 9 0.118 9 0.341 9 0.689 9 0.238
Residual 40 40 39 32 33
Table VI. Geographic models derived from stepwise regression of site variation in height, survival, and pest score of western gall rust (GT),
terminal weevil (WT), needle cast (NC).
Traits R
2
Regression equation
a
Height 0.470 2751.16456 – 2.0622 × elevation
2
– 0.28827 × latitude × longitude
Survival 0.348 – 1832.1558 + 71.0712 × latitude – 0.6608 × latitude
2
+ 0.0712 × elevation
2
GT 0.076 4.5235 – 0.0023 × longitude × elevation
WT 0.269 – 6.0926 + 0.0751 × longitude – 0.00042 × latitude × longitude
NC 0.334 2.8066 + 0.7124 × elevation – 0.03466 × elevation
2
– 0.00065 × latitude × longitude
a
All equations significant at 0.05 probability level; elevation in unit 100 m.
Predicting site productivity and pest hazard 37
A positive correlation between moisture gradient and height
was found in four of the five BEC zones where more than two
subzones associated with a moisture gradient had test sites. In
the SBS zone, when moisture level increased from dry to moist
to wet, average height increased from 6.1 to 7.0 to 7.2 m; in
MS, mean height from very dry to dry subzones increased from
5.1 to 6.9 m; in IDF, when moisture gradient increased from
dry to moist, mean height increased from 5.0 to 7.4 m; similarly
in ICH, mean height in the wet subzone was 10.1 m compared
to 7.2 m in the moist subzone. These differences were statisti-
cally significant (Tab. VII). Only in ESSF zone, height was not
significantly associated with moisture gradients of subzones
from dry, moist to wet (6.3, 6.2 and 6.2 m respectively).
Survival varied from 47.0% at Blue River to 96.6% at Telkwa
with average survival of 82.9% for the 57 sites (Tab. I), and dif-
ferences among BEC zones are statistically significant (Tab. III).
However, excluding the two sites, Blue R. and M599, in BWBS in
northern BC, site variation in survival was not large (66 to 97%).
Table VII. Regression models by fitting site variation in height, survival, and pest score of western gall rust, terminal weevil and needle cast to
biogeoclimatic zones and subzones.
Height (n = 57)
[2] Y = 249.65 + 59.44 (BWBS) + 376.00 (ESSF) + 495.83 (ICH) + 332.88 (IDF) + 393.83 (MS) + 188.59 (SBPS) + 431.54 (SBS) + 0.00 (SWB)
Adjusted R
2
= 0.562 Standard Error of Estimate (SEE) = 100 cm
[3] Y = 249.65 + 59.44 (BWBS) + 368.81 (ESSF) + 762.34 (ICH) + 494.25 (IDF) + 259.40 (MS) + 188.59 (SBPS) + 470.72 (SBS) + 0.00 (SWB) +
0.00 (BWBSd) + 14.05 (ESSFd) + 8.19 (ESSFm) + 0.00 (ESSFw) – 287.01 (ICHm) + 0.00 (ICHw) – 242.05 (IDFd) + 0.00 (IDFm) + 179.24 (MSd) +
0.00 (MSx) + 0.00 (SBPSx) – 105.99 (SBSd) – 19.52 (SBSm) + 0.00 (SBSw) + 0.00 (SWBm)
Adjusted R
2
= 0.718 Standard Error of Estimate (SEE) = 86 cm
Survival (n = 57)
[2] Y = 80.64 – 32.78 (BWBS) + 6.56 (ESSF) + 2.21 (ICH) – 0.03 (IDF) + 2.61 (MS) – 2.17 (SBPS) + 5.13 (SBS) + 0.00 (SWB)
Adjusted R
2
= 0.463 Standard Error of Estimate (SEE) = 7.7%
[3] Y = 80.64 – 32.78 (BWBS) + 3.18 (ESSF) + 5.28 (ICH) + 6.67 (IDF) + 3.22 (MS) – 2.17 (SBPS) + 4.64 (SBS) + 0.00 (SWB) + 0.00 (BWBSd) +
5.10 (ESSFd) + 8.30 (ESSFm) + 0.00 (ESSFw) – 3.30 (ICHm) + 0.00 (ICHw) – 10.04 (IDFd) + 0.00 (IDFm) – 0.82 (MSd) + 0.00 (MSx) +
0.00 (SBPSx) – 6.60 (SBSd) + 3.30 (SBSm) + 0.00 (SBSw) + 0.00 (SWBm)
Adjusted R
2
= 0.546 Standard Error of Estimate (SEE) = 7.6%
Western gall rust (n = 56)
[2]
a
Y = 3.57 – 3.27 (BWBS) – 3.25 (ESSF) – 1.81 (ICH) – 2.79 (IDF) – 3.05 (MS) – 3.55 (SBPS) – 1.29 (SBS) + 0.00 (SWB)
Adjusted R
2
= 0.111 Standard Error of Estimate (SEE) = 2.65
[3]
a
Y = 3.57 – 3.27 (BWBS) – 2.94 (ESSF) – 3.41 (ICH) – 1.56 (IDF) – 3.34 (MS) – 3.56 (SBPS) + 1.05 (SBS) + 0.00 (SWB) + 0.00 (BWBSd) –
0.54 (ESSFd) – 0.53 (ESSFm) + 0.00 (ESSFw) + 1.72 (ICHm) + 0.00 (ICHw) – 1.85 (IDFd) + 0.00 (IDFm) + 0.39 (MSd) + 0.00 (MSx) +
0.00 (SBPSx) –3.58 (SBSd) – 2.23 (SBSm) + 0.00 (SBSw) + 0.00 (SWBm)
Adjusted R
2
= 0.077 Standard Error of Estimate (SEE) = 2.76
Terminal Weevil (n = 49)
[2] Y = 0.10 + 0.21 (BWBS) + 0.10 (ESSF) + 0.12 (ICH) + 0.25 (IDF) + 0.34 (MS) + 0.37 (SBPS) + 0.37 (SBS) + 0.00 (SWB)
Adjusted R
2
= 0.289 Standard Error of Estimate (SEE) = 0.21
[3] Y = 0.10 + 0.21 (BWBS) + 0.06 (ESSF) + 0.06 (ICH) + 0.23 (IDF) + 0.69 (MS) + 0.37 (SBPS) + 0.56 (SBS) + 0.00 (SWB) + 0.00 (BWBSd) +
0.01 (ESSFd) + 0.25 (ESSFm) + 0.00 (ESSFw) + 0.07 (ICHm) + 0.00 (ICHw) + 0.02 (IDFd) + 0.00 (IDFm) – 0.46 (MSd) + 0.00 (MSx) + 0.00
(SBPSx) – 0.42 (SBSd) – 0.14 (SBSm) + 0.00 (SBSw) + 0.00 (SWBm)
Adjusted R
2
= 0.457 Standard Error of Estimate (SEE) = 0.19
Needle Cast (n = 50)
[2] Y = 1.80 + 0.08 (BWBS) – 0.05 (ESSF) + 0.32 (ICH) + 1.37 (IDF) + 0.59 (MS) + 0.09 (SBPS) + 0.02 (SBS) + 0.00 (SWB)
Adjusted R
2
= 0.377 Standard Error of Estimate (SEE) = 0.49
[3] Y = 1.80 + 0.08 (BWBS) + 0.06 (ESSF) – 0.04 (ICH) + 1.79 (IDF) – 0.14 (MS) + 0.09 (SBPS) – 0.15 (SBS) + 0.00 (SWB) + 0.00 (BWBSd) –
0.38 (ESSFd) + 0.33 (ESSFm) + 0.00 (ESSFw) + 0.39 (ICHm) + 0.00 (ICHw) – 0.64 (IDFd) + 0.00 (IDFm) + 0.98 (MSd) + 0.00 (MSx) +
0.00 (SBPSx) + 0.44 (SBSd) + 0.07 (SBSm) + 0.00 (SBSw) + 0.00 (SWBm)
Adjusted R
2
= 0.477 Standard Error of Estimate (SEE) = 0.47
a
Model not significant at = 0.05.
38 H.X. Wu et al.
The geographic model accounted for 35% of site variation
(Tab. VI). But BEC models (Tab. VII) indicate the two north-
ern sites in BWBS with high mortality were the major contrib-
uting source to the statistical significance; excluding BWBS,
none of the between-zone or subzone differences was larger
than the standard errors (Tab. VII). Indeed, no statistical sig-
nificance was detected in ANOVA or regression models,
excluding these two northern sites.
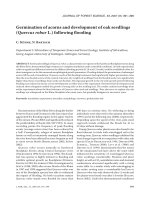
3.2. Western gall rust
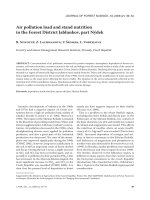
A large variation of gall rust infection was observed among
sites, the most heavily infected site had over 150 times more
galls per tree than the least infected ones (Tab. I, Fig. 3). But
the variation was not associated with BEC forest classifications
(Tabs. III–V and VII) and showed only a very weak geographic
trend (Tab. VI). However, site variation, as shown in Figure 3,
does not seem to be random; apparently, highly infected sites
were concentrated in three geographic areas: Williston L. basin
in the moist, cool SBS subzone, east of upper Quesnel R. in the
wet, cool SBS subzone, and in West Kootenay in the moist,
warm ICH subzone in the southern interior; and the least
infected sites along the western edge of the Interior (east of the
Coastal Mts.) and along the southern Rocky Mt. Trench
(Fig. 3). A positive relationship between gall rust and moisture
gradients of subzones was found in SBS (average number of
galls per tree rose from 1.05 to 2.40 to 4.63 from dry, moist to
wet subzone), MS (from 0.24 in very dry subzone to 0.62 in
dry subzone), IDF (from 0.16 in dry subzone to 2.02 in the wet
subzone), and ESSF (from 0.09 in dry subzone to 0.11 in moist
subzone and to 0.64 in wet subzone). It appears that high mois-
ture site favors the infection of western gall rust.
On average, sites in SBS and ICH had the highest number
of galls per tree, 2.28 and 1.76, respectively; the seven most
heavily infected sites are in these two zones (Tab. I). Sites in
ESSF and SBPS were the least infected, averaging 0.02 and
0.33 galls per tree respectively and those in MS and IDF zones
intermediate, 0.53 and 0.78 galls per tree, respectively. Mile
451 in the SWB had relatively high gall incidence (3.57 galls
per tree) and the Blue River site in BWBS zone had few galls
(0.30 galls per tree), but there is only one site in each of these
two zones.
3.3. Terminal weevil
Terminal weevil attacks varied from 0.03 attacks per tree at
Wuho Cr. to 0.86 attacks per tree at Salmon L. with an average
of 0.34 attacks per tree for the 49 sites. The least attacked sites
were concentrated along the Southern Rocky Mt. Trench in
southeastern BC. Differences among BEC zones were statisti-
cally significant (Tab. III), and also subzones associated with
moisture gradient (Tab. IV) but not with temperature gradient
Figure 3. Effect of latitude, longitude, and elevation on western gall rust infection on lodgepole pine.
Predicting site productivity and pest hazard 39
(Tab. V). The seven most heavily attacked sites were in MS
(0.78–0.80) and SBS zone (0.63–0.86) (Tab. I). On average, the
SBS, SBPS and MS zones had the most weevil attacks (0.44–
0.47); the IDF, BWBS, ICH and ESSF zones had relatively low
weevil attacks (0.20–0.35). The SWB zone had the least weevil
attacks (0.10 attacks per tree). Relationship between terminal
weevil and moisture gradient was not consistent though statis-
tically significant (Tab. IV); weevil attack was positively
related to moisture gradient in MS (from 0.24 to 0.52 to 0.66
from dry to moist to wet subzones, respectively), but negative
in SBS (from 0.79 to 0.32 from very dry to dry subzones).
The geographic model accounted for 27% of the site varia-
tion which showed a northwest to southeast trend (Tab. VI).
BEC zones explained about the same amount of variation
(29%). No clear discrete changes could be detected (Model 2,
Tab. VII).
3.4. Needle cast
Mean score of needle cast incidence was 2.07 ranging from
1.31 (Dog Cr.) to 3.59 (Thuya L.) in a scale of 1 to 5 (Tab. I).
Generally, sites in central and southeastern Interior had higher
needle cast incidence than those in the north and northwest. The
10 most infected sites (score > 2.9) were scattered in three BEC
zones: 3 each in ICH and IDF, and 4 in MS. On average, IDF
zone had the highest needle cast incidence (3.12), MS was the
second (2.39), and ICH the third (2.12). The other five zones
had similar levels of needle cast infection (1.75 for ESSF to
1.89 for SBPS).
Analysis of variance suggests both BEC zone and subzone
effects on site needle cast incidence were statistically signifi-
cant (Tab. III); but neither the effect of moisture or temperature
gradient was significant when analyzed separately (Tabs. IV
and V). Regression analyses seem to indicate a sharp increase
in needle cast in IDF (dry, low-elevation valley sites, Tab. II)
(Model 2, Tab. VII). Among the four major zones, ESSF and
SBS had substantially lower needle cast incidence than ICH and
MS, though not statistically significant (Model 2, Tab. VII).
BEC zones accounted for 38% of the variation (Tab. VII). At
subzone level, needle cast incidence was positively related to
moisture gradient within IDF and MS zones. In IDF needle cast
score increased from 2.95 to 3.59 from dry to moist subzones;
in the MS zone, from 1.66 to 2.63 from very dry to dry subzone;
the relationship in ESSF and SBS was unclear (Model 3,
Tab. VII).
The geographic model (accounting for 33% of the site var-
iation in needle cast) depicts a geographic cline with increasing
incidence from northwest to southeast, and a curvilinear rela-
tionship with elevation, increasing incidence with increasing
site elevation which peaks at about 1 000 m and then decreases
(Tab. VI).
3.5. Between-trait correlations
Sites with higher productivity had higher survival rate (r =
0.46 and significant, Tab. VIII). This is because productive
sites have more favorable environment for survival. No signif-
icant correlation was detected between height and any of the
pest traits or among the pest traits.
4. DISCUSSION
Both BEC zones and geographic models explained about the
same amount (50%) of the site variation in height (Tabs. VI and
VII) suggesting either can predict equally well site productivity
across BC interior; both reflect essentially coarse-grained site
environments prescribed by temperature and precipitation gra-
dients [26]). However, the former can only project zonal aver-
age, while the latter can estimate the productivity of any site
location given geographic coordinates. The geographic model
projects a loss of 0.3 m in 20-year height per 100 m elevation
increase of planting site below 1000 m, above that the loss
would be 0.5 m; and 0.3 m loss per one degree increase of lat-
itude and longitude. The models, however, left unexplained
about half of the site productivity variation. Models which are
able to predict lodgepole pine site productivity with high pre-
cision need to include edaphic factors as shown by Wang et al.
[35]. Positive correlations between height and site moisture
gradient (Model 3, Tab. VII) also suggest the effect on produc-
tivity of site-specific edaphic factors.
Despite the large site differences in all three pest traits
(Tab. I) and the apparent regional trends (Fig. 3 and Tab. I),
neither geographic nor BEC models provided a high level of
predictability (Tabs. VI and VII). However, positive associa-
tion of high pest incidence with site moisture gradients of sub-
zones seems to indicate high site moisture may be conducive
to all three pests, to some degree (Model 3, Tab. VII). Severe
western gall rust tends to occur regionally in interior BC [37,
38] suggesting the influence of factors specific to local site envi-
ronment. Western gall rust is the most common and destructive
Table VIII. Correlations of site means in height, survival and pest scores of western gall rust (GT), terminal weevil (WT) and needle cast (NC).
Traits
Height Survival GT WT NC
Height 1.000 0.458** –0.020 –0.167 0.040
Survival 1.000 –0.075 0.139 –0.240
GT 1.000 –0.047 0.065
WT 1.000 –0.182
NC 1.000
** significant at 0.01 probability level; not significant otherwise.
40 H.X. Wu et al.
stem rust of lodgepole pine, and considerable effort has been
spent to control it [33].
Very little is known about the ecology and impact of Pis-
sodes terminalis despite its degrading effect on stem quality of
lodgepole pine [32]. McLauchlan and Borden’s study [19] rep-
resents the first comprehensive attempt in BC to quantify its
impact and to relate its attack to site environment. Their study
is not directly comparable to ours, e.g. natural stand vs planta-
tion, local host source vs mixture of seed sources, different density
and spacing, etc. However, attack intensity in terms of average
number of attacks per tree was comparable at sites in MS zone
in the same region (0.59 vs. 0.52), but intensity was much lower
in IDF zone in our study (0.35 vs. 0.67); the IDF test sites in
our study are located in wetter and cooler subzones than
McLauchlan and Borden’s study plots [19]. Much remains to
be learned about this potentially damaging insect.
Needle cast infection at these same sites reported by Ying
and Hunt [47] showed stronger elevation and longitudinal
trends than were found in this study. The major discrepancy
was the severe needle cast at the dry sites in IDF zone (Tab. I)
where infection was very light in 1983 and 1984 [47]. An insect
and disease survey [37, 38] also reported heavy Lophodermella
concolor at dry sites in IDF only in recent years. Needle cast
infection fluctuates greatly from region to region depending on
the weather of the year. Wet summer and fall favors the spread
of the disease [11, 37, 38]. Both Ying and Hunt [47] and this study
found frequent severe needle cast at moist valley bottom sites.
A major finding of this study was that it was more difficult
to predict infection of pests using either BEC or geographic vari-
ables than predicting growth. There may be several causes for the
low correlation between pests and BEC system in this experiment.
(1) Number of sampling site may be too small within each
of the eight BEC zones and 25 subzones. Only 60 sites were
sampled within the 25 large subzones. Most subzones only
sampled a single or two sites. To adequately sample each zone
and subzone and variant within each subzone, more sites may
be needed for a more detailed examination.
(2) There are large variations within each BEC and subzones
associated with micro-site factors such as variation on soil,
slope, vegetation composition. There are also variations on his-
tory of stand, stand management due to recent fire, harvesting
of nearby plots, and cattle grazing. These micro-site variations
were not characterized in this study.
(3) The BEC system may be too general and simple at current
stage to account for local variation responsible for pest infes-
tation. BEC system mainly accounted for factors of mean
annual temperature, precipitation, and vegetation. Other factors
relevant to dynamics of pest infection such as within-year var-
iation on moisture and temperature, under-canopy vegetation,
distance to infected sites outside the studied regions and plots,
surrounding vegetation and previous silviculture regime may
influence the level of infestation of these pests. For example,
we inspected the infection level in naturally regenerated stands
near the test sites having severe gall rust in Blackwater Creek
(BLAC) and Weston Creek (WEST); without exception, infec-
tion levels were also high in these surrounding natural stands.
This further suggests the effect of local factors including per-
haps the stand history of infection [10].
Lack of between-site correlations of height with pest sever-
ity, and among pests (Tab. VIII) suggests that site factors which
determine site productivity may be different from that affecting
pest incidence and that there is little association of common site
environments in host-pest systems among the three pests.
Despite this lack of correlation at broad geographic scale, at
individual sites pest effect on height and survival was quite
obvious. For example, severe western gall rust (5.58 galls per
tree) and needle cast (average score 3.32) at Bisson L. were the
main cause of high mortality (29%), and the same was apparent
at Wigwam (mortality 26%) with an average of 6.07 galls per
tree and repeated needle cast. Heavy gall rust at Blackwater
(15.52 galls per tree), and weevil attack at Salmon L. (63% trees
attacked) and McBride L. (68% attacked) significantly reduced
the height growth at these sites.
There is very limited publication on the major causes of the
variation on infestation of the three pests studied here. Most
information was from regular surveys of the pests conducted
in natural populations [38]. Heavy infection for western gall
rust and needle cast was particularly associated with moist
environment [47]. In conclusion from previous and current
studies, temperature between BEC zones and moisture within
each BEC zone seems to have the largest effect on lodgepole
pine growth, while moisture seems to have the largest effect on
western gall rust and needle cast within the ICH and SBS zones.
Perhaps the knowledge most pertinent to managerial decisions
is: which sites are most suitable for establishment of plantation
lodgepole pine in interior BC. Overall, low to mid-elevation
sites in the moist, mild ICH subzones and the dry, cool MS sub-
zone along the Rocky Mt. Trench are the most desirable - high
productivity and relatively low pest hazard. Though repeated
needle cast can pose a threat to lodgepole pine plantations at
these sites, highly resistant seed sources can effectively allevi-
ate the problem [12, 24]. At the most productive sites, e.g. Goat
R., Sue Mile 25 (Fig. 1 and Tab. I), plantations with selected
productive provenances coupled with intensive silviculture can
probably be harvested on a 40- to 45-year rotation, and many
of the fast growing provenances happen to be local [43, 45].
Productive lodgepole pine sites also exist across the vast
stretch of the Interior extending from sites in the cold ICH sub-
zone and the moist SBS subzones saddled at Skeena/Bulkley
river basin extending west to Mackenzie, sites in moist, mild
ICH subzones along the interior wetbelt on Shuswap-Quesnel
Highland, to windward sites in dry, mild MS subzone on
Thompson Plateau. The least productive sites are mostly along
the western edge of the Interior, e.g. the very dry, cold SBPS
in Chilcotin and in BWBS and SWB in the north where natural
regeneration should stay the norm of managing lodgepole pine.
Sixty sites are a large number in a study of this nature, but
still far from adequate to sample the complex environment of
forest lands in the interior of British Columbia. However,
regression models indicate a good predictability of at least the
effect of coarse-grained environment on site productivity. As
methodology on quantification of site edaphic factors, (e.g.
nutrition and finer moisture regime) across BEC zones becomes
available (D.V. Meidinger, personal communication), improved
models derived from these test sites may be able to predict, with
high precision, productivity as well as pest hazard.
Predicting site productivity and pest hazard 41
REFERENCES
[1] Bentz B.J., Amman G.D., Logan J.A., A critical assessment of risk
classification system for the mountain pine beetle, For. Ecol.
Manage. 61 (1993) 349–366.
[2] Brown J.K., Fire cycles and community dynamics in lodgepole pine
forests, in: Baumgartner D.M. (Ed.), Management of lodgepole
pine ecosystem, Cooperative Extension Service, Washington State
University, Pullman, WA, 1973, pp. 429–456.
[3] Corns I.G.W., Pluth D.J., Vegetational indicators as independent
variables in forest growth prediction in west-central Alberta,
Canada. For. Ecol. Manage. 9 (1984) 13–25.
[4] Critchfield W.B., Genetics of lodgepole pine, USDA For. Serv.
Res. Pap., 1980, W-37.
[5] Green R.N., Marshall P.L., Klinka K., Estimating site index of
Douglas-fir (Pseudotsuga menziesii (Mirb.) Franco) from ecologi-
cal variables in southwestern British Columbia, For. Sci. 35 (1989)
50–63.
[6] Green R.N., Thrower J.S., Field guide insert for the estimation of
coastal Douglas-fir site index from BEC site series, BC Min. For.,
1993.
[7] Hiratsuka Y., Powell J.M., Pine stem rusts of Canada, Dept. Env.,
Can. For. Serv., For. Tech. Rep. No. 4, 1976.
[8] Hiratsuka Y., Powell J.M., van Sickle G.A., Impact of pine stem
rusts of hard pines in Alberta and the Northwest Territories, Can.
For. Serv. North. For. Cent. Edmonton, AB. Inf. Rep. NOR-X-299,
1988, p. 9.
[9] Hoff R.J., Minggao S., Genetic variation in susceptibility of lodge-
pole pine to western gall rust in the Inland Northwest, USDA For.
Serv. Res. Note INT-420, 1994.
[10] Holls C.A., Schmidt R.A., Site factors related to fusiform rust inci-
dence in north Florida slash pine plantations, For. Sci. 23 (1977)
69–77.
[11] Hunt R.S., Pine needle cast and blights in the Pacific Region, Can.
For. Serv. Pac. For. Res. Cent., For. Pest Leaf. No. 43, 1981.
[12] Hunt R.S., Ying C.C., Ashbee D., Variation in damage among
Pinus contorta provenances caused by the needle cast fungus
Lophodermella concolor, Can. J. For. Res. 17 (1987) 594–597.
[13] Illingworth K., General proposal for tree improvement with lodge-
pole pine – a problem analysis, BC Min. For., Res. Br. Unpubl.
Rep., 1966, 18 p.
[14] Illingworth K., Considerations for a discussion on objectives, scope
and design of the all-range lodgepole pine provenance trials, BC
Min. For., Res. Br. Unpubl. Rep., 1969, 24 p.
[15] Klinka K., Carter R.E., Relationship between site index and synop-
tic environmental factors in immature coastal Douglas-fir, For. Sci.
36 (1990) 815–830.
[16] Krajina V.J., Biogeoclimatic zones and biogeocoenoses of British
Columbia, Ecol. West. N. Amer. 1 (1965) 1–17.
[17] Lotan J.E., Brown J.K., Neuenschwander L.F., Role of fire in lod-
gepole pine forests, in: Baumgartner D.M. et al. (Eds.), Lodgepole
pine: the species and its management, Cooperative Extension Ser-
vice, Washington State University, Pullman, WA, 1985, pp. 133–
152.
[18] MacKinnon A., Meidinger D.V., Klinka K., Use of the biogeocli-
matic ecosystem classification system in British Columbia, For.
Chron. 68 (1992) 100–120.
[19] McLauchlan L.E., Borden J.H., Spatial attack dynamics and impact
of Pissodes terminalis in three biogeoclimatic zones in southern BC,
Min. For. Victoria, BC, 1994.
[20] McLennan D.S., Summary of site index statistics for lodgepole pine
and interior spruce in ecosystems of the sub-boreal spruce and sub-
boreal pine-spruce biogeoclimatic zones, BC Min. For. Contract
Rep. 12095, 1989.
[21] Meidinger D., Pojar J., Ecosystems of British Columbia, BC Min.
For., Res. Br. Victoria, BC, 1991, 330 p.
[22] Monserud R.A., Variation on a theme of site index, in: Ek A.R.,
Shifley S.R., Burk T.E. (Eds.), Forest growth modeling and predic-
tion, US Dept. Agric. For. Serv. St. Paul, Minn. Gen. Tech. Rep.
NC-120, 1987, pp. 419–427.
[23] Monserud R.A. Rehfeldt G.E., Genetic and environmental compo-
nents of variation of site index in inland Douglas-fir, For. Sci. 36
(1990) 1–9.
[24] Pfister R.D., Daubenmire R., Ecology of lodgepole pine (Pinus
contorta Dougl.), in: Baumgartner D.M. (Ed.), Management of lod-
gepole pine ecosystem, Cooperative Extension Service, Washing-
ton State University, Pullman, WA, 1973, pp. 27–46.
[25] Pojar J., Ecological classification of lodgepole pine in Canada, in:
Baumgartner D.M., et al. (Eds.), Lodgepole pine: the species and its
management, Coop. Ext. Serv., Wash. Stat. Univ., Pullman, 1985,
pp. 77–88.
[26] Pojar J., Klinka K., Meidinger D.V., Biogeoclimatic Ecosystem
Classification in British Columbia, For. Ecol. Manage. 22 (1987)
119–154.
[27] Powell J.P., Hiratsuka Y., Serious damage caused by stalactiform
blister rust and western gall rust to a lodgepole pine plantation in
central Alberta, Can. Plant Dis. Surv. 53 (1973) 67–71.
[28] SAS Institute Inc., SAS
®
STATS Guide, 1&2, Version 6, 2nd ed.,
Cary, NC. USA, 1990.
[29] Sieben B.G., Climatically based hazard rating system for spruce
weevil, Pissodes strobi, in the Prince George Forest Region under
present and climate change conditions, M.Sc. thesis, Fac. of For.
Univ. BC, Vancouver, BC, 1994.
[30] Stanek W., Relative quality of the major forest associations of the
southern BC interior for growth of lodgepole pine, Engelmann
spruce, Douglas-fir and alpine fir, For. Chron. 42 (1966) 306–313.
[31] Steel R.G.D., Torrie J.H., Principles and procedures of statistics, a
biometrical approach, 2nd ed., McGraw-Hill, New York, 1980.
[32] Stevens R.E., Knopf J.A.E., Lodgepole terminal weevil in interior
lodgepole forests, Environ. Entomol. 3 (1974) 998–1002.
[33] Van der Kamp B.J., Lodgepole pine stem diseases and management
of stand density in the British Columbia interior, For. Chron. 70
(1994) 773–779.
[34] Wang Q., Ecological and height growth analysis of some sub-
boreal immature lodgepole pine stands in central British Columbia,
Ph.D. thesis, Fac. For. Univ. BC, Vancouver, BC, 1992, 207 p.
[35] Wang Q., Wang G.G., Coates K.D., Klinka K., Use of site factors
to predict lodgepole pine and interior spruce site index in the sub-
boreal spruce zone, Res. Note No. 114, Min. For. Victoria, BC,
1994.
[36] Weisberg S., Applied Linear Regression, 2nd ed., John Wiley and
Sons, NY, 1985.
[37] Wood C.S., Van Sickle G.A., Shore T.L., Forest insect and disease
conditions in British Columbia and the Yukon Territory, Can. For.
Serv. Pac. For. Res. Cent. Rep. BC-X-259, 1984.
[38] Wood C.S., Van Sickle G.A., Shore T.L., Forest insect and disease
conditions in British Columbia and the Yukon Territory, Can. For.
Serv. Pac. For. Res. Cent. Rep. BC-X-345, 1993.
[39] Wu H.X., Muir J.A., Ying C.C., Effect of geographic variation and
jack pine introgression on disease and insect resistance in lodgepole
pine, Can. J. For. Res. 26 (1996) 711–726.
[40] Wu H.X, Ying C.C., Genetic parameters and selection efficiencies
in resistance to western gall rust, stalactiform blister rust, needle
cast and Sequoia pitch moth in lodgepole pine, For. Sci. 43 (1997)
571–581.
[41] Wu H.X., Ying C.C., Variation in reaction norm of natural
lodgepole pine populations, Theor. Appl. Genet. 103 (2001) 331–
345.
42 H.X. Wu et al.
[42] Xie C Y., Ying C.C., Genetic architecture and adaptive landscape
of interior lodgepole pine (Pinus contorta ssp. latifolia), Can. J.
For. Res. 25 (1995) 2010–2021.
[43] Xie C Y., Ying C.C., Heritability, age-age correlation and early
selection in lodgepole pine (Pinus contorta ssp. latifolia), Silvae
Genet. 45 (1996) 101–107.
[44] Yanchuk A.D., Yeh F.C., Dancik B.P., Variation of stem rust resis-
tance in a lodgepole pine provenance-family plantation, For. Sci. 34
(1988) 1067–1075.
[45] Ying C.C., Illingworth K., Carlson M., Geographic variation in lod-
gepole pine and its implication for tree improvement in British
Columbia, in: Baumgartner D.M. et al. (Eds.), Lodgepole pine: the
species and its management, Coop. Ext. Serv., Wash. Stat. Univ.,
Pullman, 1985, pp. 45–53.
[46] Ying C.C., Illingworth K., Lodgepole pine provenance research in
northwestern Canada with particular reference to the Yukon Terri-
tory, Dept. For. Gen. Plant Physiol. Swed. Univ. Agric. Sci. Umea,
Rep. 6 (1986) 189–219.
[47] Ying C.C., Hunt R.S., Stability of resistance among Pinus contorta
provenances, Can. J. For. Res. 17 (1987) 1596–1601.
[48] Ziller W.G., The tree rusts of western Canada, Can. For. Serv. Pac.
For. Res. Cent. Publ. No. 1329, 1974.
To access this journal online:
www.edpsciences.org