Báo cáo lâm nghiệp: "Can we reconstruct deer browsing history and how? Lessons from Gaultheria shallon Pursh" pdf
Bạn đang xem bản rút gọn của tài liệu. Xem và tải ngay bản đầy đủ của tài liệu tại đây (699.88 KB, 10 trang )
153
Ann. For. Sci. 62 (2005) 153–162
© INRA, EDP Sciences, 2005
DOI: 10.1051/forest:2005007
Original article
Can we reconstruct deer browsing history and how?
Lessons from Gaultheria shallon Pursh
Bruno VILA
a
*, Frédéric GUIBAL
a
, Franck TORRE
a
, Jean-Louis MARTIN
b
a
Institut Méditerranéen d’Écologie et de Paléoécologie (IMEP), CNRS UMR 6116, Faculté des Sciences et Techniques de Saint-Jérôme,
13397 Marseille Cedex 20, France
b
Centre d’Écologie Fonctionnelle et Évolutive, CNRS UMR 5175, 1919 Route de Mende, 34293 Montpellier Cedex 5, France
(Received 5 October 2003; accepted 15 March 2004)
Abstract – We identified and analysed browsing signatures left by Sitka black-tailed deer (Odocoileus hemionus sitkensis) on Salal (Gaultheria
shallon) to reconstruct deer browsing history. Radial growth analyses showed negative abrupt growth changes on islands with deer probably
linked to defoliation. Deer browsing pressure was best assessed by the incidence of morphological changes caused by browsing in section form,
lobes, pith form, pith position or the presence of decaying wood and by changes in stem age structures. Salal stems were twice older (30 years)
on islands with deer than on islands without deer (16 years). On islands with deer deficit of stems in the youngest age classes suggested that
deer impact has been strong on these shrubs for at least 20 years in the northern sites and for about 10 years in the southern ones.
deer browsing history / negative abrupt growth change / morphological characteristics / age structures / Gaultheria shallon Pursh
Résumé – Est-il possible de reconstituer l’histoire de l’abroutissement et comment ? Ce que nous apprend Gaultheria shallon Pursh.
Nous avons identifié et analysé les signatures relatives à l’abroutissement du cerf à queue noire (Odocoileus hemionus sitkensis) sur le salal
(Gaultheria shallon) et utilisé celles-ci pour reconstituer son histoire. L’analyse de la croissance radiale a révélé des décroissances brutales
probablement liées à des défoliations. La pression et l’histoire d’abroutissement sont le mieux appréhendées par l’occurrence des caractères
anatomiques tels que la forme de la section, la présence de lobes, la forme et la position de la moelle, la présence de bois altérés ou le déficit en
jeunes tiges. L’analyse des âges révèle que les tiges de salal sont deux fois plus âgées en présence de cerfs (30 versus 16 ans). Sur les îles avec
cerf, on observe un déficit de jeunes tiges qui suggère un impact fort du cerf depuis 10 ans dans les sites du sud et de 20 ans au moins dans les
sites du nord.
histoire de l’abroutissement par le cerf / décroissance brutale / caractères morphologiques / structures d’âge / Gaultheria shallon Pursh
1. INTRODUCTION
Ungulate herbivores can have a profound effect on forest
structure and plant communities [1, 2, 9, 57]. They affect plant
morphology [13, 30], plant growth [8, 51, 52, 55] and plant
chemistry [5, 55]. Disturbance of forest ecosystems by herbiv-
ory can be analysed by a posteriori approaches based on woody
plant morphology [30] and on the analysis of ring-width series
[45, 46]. Indeed, records of annual growth and wood density,
age structure and morphological characteristics [13, 25, 27, 43,
56] are valuable signatures of past disturbances that have
affected woody plants. Growth time series have been success-
fully used to infer spatial and temporal variations affecting sev-
eral herbivore populations [31–33, 36].
Documenting and understanding deer impact on forest eco-
systems is increasingly needed by forestry and conservation
agencies as a result of increasing deer populations in many
regions. This necessitates appropriate and practical tools to be
developed in order to document and quantify the signatures
deer leave on the vegetation.
The Haida Gwaii archipelago (Queen Charlotte Islands,
British Columbia) provides a unique opportunity for such a
methodological study. Except for the extinct Dawson caribou
(Rangifer tarandus dawsoni Seton) there was no other deer
native to the islands. Sitka black-tailed deer was introduced on
Graham Island at the turn of the 20th century [7] and soon col-
onised most of the archipelago thereby affecting plant regen-
eration [10, 11, 15, 38, 39], causing wood depreciation, high
seedling mortality and delay in recruitment [49, 50].
Salal (Gaultheria shallon Pursh) and Red huckleberry (Vac-
cinium parvifolium Smith in Rees) are the two commonest long-
lived woody shrubs in coastal forests of northwestern North
America [6, 12, 17, 18] and are well suited for such a study.
* Corresponding author:
154 B. Vila et al.
Our objective in this paper is to identify and analyse brows-
ing signatures left by Sitka black-tailed deer (Odocoileus hemi-
onus sitkensis Merriam) on Salal and to investigate how they
can be used to reconstruct deer browsing history. Although
salal is commonly eaten by deer [17], it is one of the rare lig-
neous species that is able to remain for several decades even
on heavily browsed sites and can, therefore, record variation in
deer impact through prolonged periods. Taking advantage of
the occurrence, side by side, of islands with and without intro-
duced deer, we compare (1) radial growth of salal, (2) the mor-
phological characteristics of its stems and (3) stem age and
height structures between deer-free and deer-affected islands.
We then use one of these signatures, stem age structure, to
reconstruct deer browsing history on the islands studied.
2. MATERIALS AND METHODS
2.1. Material and sites
2.1.1. Haida Gwaii and deer
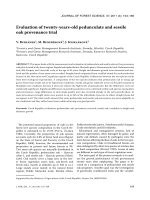
Haida Gwaii (53° N, 132° W), has about 300 islands, is 300 km
long and lies ca. 80 km off mainland Canada [51] (Fig. 1). Except for
the Dawson caribou, extinct since the beginning of the 20th century
[7], mammalian herbivores were absent from these islands until black-
tailed deer were introduced. The study took place on the eastern side
of the archipelago which, for most parts, belongs to the Coastal Western
Hemlock Zone, wet hypermaritime sub-zone and to the very wet
hypermaritime sub-zone in the southern end of the archipelago. For-
ests consist of a mixture of western hemlock (Tsuga heterophylla
(Raf.) Sarg.), western red cedar (Thuja plicata D. Don ex Lamb.) and
Sitka spruce (Picea sitchensis (Bong.) Carrière). The understory was
originally densely covered in shrubs such as salal and red huckleberry
(Vaccinium parvifolium Smith in Rees) [3]. Today deer are abundant
over most of the area and current density estimates range from 13 to
30 deer per km
2
[15, 28, 29]. In most places the understory has been
reduced to a few old isolated and senescent shrubs as a result of heavy
deer browsing [38, 39] (pers. obs.). According to Reimoser et al.
(1999) [41] the absence of ground vegetation, the existence of a browse
line and of palatable species confined to sites inaccessible to deer
observed in these places, all indicate a very heavy browsing pressure.
2.1.2. Salal
Salal is an erect, evergreen and loosely branched shrub with an
extensive root system allowing effective vegetative spread [13, 17,
19]. It is a dominant understory species in lowland coniferous coastal
forests and it is very abundant in open shoreline habitats because light
increases its vigor and growth. It is recognized to be a valuable wildlife
food in British Columbia. Salal supplies about 10% of the total diet
of black-tailed deer and it is of special importance in winter [18]. Birds
commonly eat salal berries, which can represent 45% of the diet of
juveniles in August [18]. In short, salal plays an essential role in veg-
etation succession, habitat structure, soil protection and ecology of
several native animal species [17, 40].
On the few deer-free islands, 40% of the shrub cover consists of
salal [28], often in the form of continuous almost impenetrable thick-
ets. The cover of vegetation on these islands averages 65.0% in the
ground layer (0–50 cm), 56.2% in the 50–150 cm layer, and 43.8%
between 1.5 and 4 m [49, 50]. On the deer-affected islands adjacent
to the deer-free islands, vegetation cover averages 26.2%, 10.7% and
20.3% in these three vegetation layers. Salal occurs only as isolated
individuals (cover less than 1%) that are taller than the browse line sit-
uated between 1.1 and 1.5 m high [28, 49, 50]. These individuals are
remnants of once impenetrable thickets [38, 39]. On the islands with
deer situated at the very south of the archipelago, shrub remnants are
abundant and salal thickets more widespread (pers. obs.).
2.2. Sampling and sample preparation
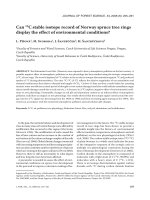
The work took place on 4 deer-free islands (Low Island, South-Low
Island, Lost Island and Tar Island) and 4 deer-affected islands (Reef
Island, Ramsay Island, Burnaby Island and the south of Moresby Island)
(Fig. 1). On each island we selected sites that had sufficient represen-
tation (> 200 m
2
) of salal, growing under an open canopy, and situated
near the forest edge along the coastline. Because salal has an extensive
root system that allows vegetative spread [18], we sampled individual
salal stems that were at least 2 m away from any other stem sampled
[19]. On deer-free islands, all characterized by a small area (< 10 ha),
we sampled stems every 2 meters along transects that were parallel to
the coastline and which run across most of the area favourable to salal
on these islands. On deer-affected islands, we sampled salal stems in
plots situated 10 to 30 m away from remnant salal thickets. Areas sam-
pled, exposure, slope, soil depth and the number of individuals col-
lected are reported in Table I.
2.2.1. Radial growth
Because cambial activity starts at the tip of the stem, easily iden-
tifiable growth rings are restricted to the upper part of a stem, whereas
very narrow rings characterise the lower part of a stem. This causes
Figure 1. Sites sampled on the Haida Gwaii archipelago (British
Columbia, Canada).
Can we reconstruct deer browsing history and how? 155
difficulties in cross-dating ring-width chronologies. To properly
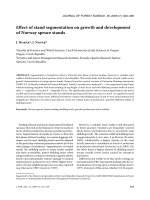
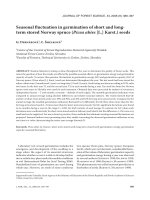
investigate the dynamics of shrub growth, we used the method pro-
posed by Kolishchuk (1990) [23], sectioning each stem at different
intervals from the top to the base. When choosing the distance between
sections, it was essential to provide sufficient overlap between ring-
width series of neighbouring sections and to cover the zone of the nor-
mal annual increment formation (Fig. 2). This method has also the
advantage to allow identifying missing rings linked to particular con-
ditions prevailing in shrub growth [23]. We therefore collected, for
each stem, 5 cm sections at each inter-node. Adjacent sections were,
on average, separated by about 20 cm. When stems were branched,
sections were collected for all axes. We numbered each section accord-
ing to its position on the stem with codes identifying sections from dif-
ferent branches of the same stem. Because this method is time con-
suming, we had to restrict sampling to a limited number of shrubs (5
to 10) collected on two of the four deer-free islands, Low and South-
Low islands, and on one of the deer-affected island, Reef Island.
2.2.2. Stem age and height
We studied stem age structure and stem height in samples from
three of the four deer-free islands (Lost, Low and Tar Islands) and from
all four of the deer-affected islands (Reef Island, Ramsay Island, Burnaby
Island and south of Moresby Island). The latter were roughly distrib-
uted along a north-south gradient parallel to the route of deer coloni-
zation. These sites were separated from each other by about 20–25 km.
Reef Island was closest to the point of deer introduction whereas
Moresby Island was the most distant from the point of deer introduc-
tion. For each salal stem taller than 20 cm and with a diameter > 0.5 cm,
we measured total height and the height of the first leaves (at 5 cm
accuracy). Basal cross-sections were collected and labeled.
2.2.3. Sample preparation
The sections were meticulously sanded using successively finer
grits of sand paper (80 – 180 – 320 – 400), a procedure described by
Table I. Characteristics of the sites sampled. RW § MC = Ring-Width and Morphological Characters and AS § HS = Age Structure and Height
Structure.
Analyses Island / Site number Deer Area (m)
sampled
Slope
(°)
Aspect
(°)
Soil depth
(cm)
Number of
individual
RW § MC South-Low (1) absent 5 × 15 0 – 20 8
RW § MC Low (2) absent 5 × 20 15 40 15 10
RW § MC Reef (3) present 30 × 10 10 180 30–45 5
RW § MC Reef (4) present 30 × 20 14 160 35 10
AS § HS Lost (5) absent 5 × 20 3 280 60 25
AS § HS Lost (6) absent 5 × 20 3–18 300–340 50–75 26
AS § HS Low (7) absent 10 × 40 18 40 15–20 50
AS § HS Tar (8) absent 5 × 10 8 290 30 25
AS § HS Reef (9) present 20 × 40 0–12 180 30–40 30
AS § HS Reef (10) present 20 × 150 19 130 25 17
AS § HS Ramsay (11) present 20 × 60 9 160 35 39
AS § HS Burnaby (12) present 10 × 60 10 170 40 15
AS § HS South-Moresby (13) present 10 × 60 14 275 75 51
AS § HS South Moresby (14) present 10 × 60 13–15 110 45 43
Figure 2. Example of a stem sectioned at different intervals from the base to the top. A1 to A3: ring-width chronologies from each section and
mean individual chronology built by averaging all chronologies from the same stem.
156 B. Vila et al.
Stokes and Smiley (1968) [48]. After removing the sanding marks left
by the preceding grit, each section was polished to further improve the
legibility. Section preparation was examined through a microscope
(×40) and preparation done once again in case of reading difficulty.
2.3. Analyses
2.3.1. Radial growth and morphological characters
2.3.1.1. Ring chronologies
The dating of ring series is based on the identification of rings with
characteristic features, generally rings that are unusually narrow.
Years characterized by such isolated narrow rings are termed pointer
years [21]. They are used by dendrochronologists for (1) directly
cross-dating wood samples by comparing, under the microscope, ring
patterns of successive sections [37] or (2) to produce skeleton plots
describing ring sequences which are compared to synchronise ring
series [45]. To achieve cross-dating, ring width curves are also com-
pared under a light table using either raw data or standardized series.
Standardization allows emphasizing narrow rings and allows remov-
ing non inter-annual variations [37]. In the present study standardisa-
tion is achieved by replacing x
t
by (x
t+1
– x
t
) / (x
t+1
+ x
t
). We used
these methods (1) to cross-date all sections within a stem and (2) to
cross-date the stems.
For each section, ring-widths were measured with a precision of
0.01 mm along a radial line of cells using an Eklund measuring device
from the bark to the centre and from upper sections to lower sections.
Two radii (separated at least by 90°) were measured on each section
to calculate a mean value for each ring. For each stem we obtained:
(1) partial chronologies which length depended on the position of the
section on the stem, the closer to the apex, the shorter the partial chro-
nology; (2) a basal chronology corresponding to the longest ring width
series obtained from the basal section.
2.3.1.2. Stem and population mean chronologies
Once sections from a stem were cross-dated, all section chronolo-
gies from that stem were averaged to build the mean chronology for
that stem. Finally individual stem chronologies were compared by the
same cross-dating method in order to build a mean population chro-
nology for plants from deer-free islands and plants from deer-affected
islands. Visual agreement between individual stem chronologies was
backed up by correlation coefficient calculated on standardized series
and validated by a Student t-test.
2.3.1.3. Morphological characters and signatures
Browsers can consume various parts of woody plants such as
leaves, twigs, bark or wood. By doing so, they induce cambium
destruction and expose wood to pathogens. This can, in turn, induce
the alteration of morphological characteristics of the stem. These alter-
ations can be classified into direct damage (section and pith deforma-
tion, lobes, pith position) and indirect damage (decaying wood).
On each of the sections collected we analysed morphological char-
acteristics. We recorded (1) the shape of the stem section: circular or
deformed, (2) the presence of lobes (if cambium is removed locally
along the stem future rings will only develop where the cambium is
intact, forming a lobe), (3) the presence of decaying wood which cor-
responds to decomposition by fungi and other micro-organisms that
may induce changes in wood texture and colour, (4) pith form (circular
or deformed), (5) pith position (centred or not), (6) wedging rings
(sensu stricto; rings that are wedging out due to localised failure of
cambial activity) [21]. It also allows quantifying character occurrences
by the % of sections of a stem in which the character is present. This
quantity is then used to compare average character frequencies/stem
between deer-free and deer-affected islands using Student t-test in sit-
uations with equal variances or with Welch’s approximate t-test when
variances were unequal [47]. Finally, we estimated the sensitivity of
each morphological character to deer browsing by comparing t-value
between deer-affected and deer-free islands. The same approach can
be used to estimate within island type variation in the occurrence of
these characteristics.
2.3.2. Age structure and stem height
2.3.2.1. Age determination
We selected the area of the cross-section that was most legible. We
pointed rings for each cross-section and counted them along two radii
from the pith to the bark of each cross-section in order to be sure we
missed no ring. Following Bunnel (1990) [6], who failed to find miss-
ing or double rings, we considered ring count as the best estimate of
age.
2.3.2.2. Analyses
We log10 transformed age data to stabilize the variance [47]. In
order to document the height up to which deer damage this species,
we compared mean heights of first leaves between deer-free and deer-
affected sites with a t-test. We also plotted the distribution of the height
of the first leaves. We compared mean age and mean stem height with
a nested analysis of variance correcting the degree of freedom by Sat-
terthwaite’s correction for unequal sample size [47]. In addition to
comparing stem age between deer-affected and deer-free categories,
we also compared stem age between northern (Reef Island), interme-
diate (Ramsay and Burnaby Islands) and southern (southern Moresby
Island) deer-affected islands using the “least significant difference”
(l.s.d.) post-hoc test. We compared total stem height between deer-
affected and deer-free categories, between islands within each of these
two categories and between sites within each island. We used catego-
ries, islands and sites as factors, the category being the factor the higher
in the hierarchy and the site being the lower. We considered categories
and islands as fixed factors and sites as a random factor. Intervals with
95% of confidence were obtained at each level of hierarchy.
We plotted age structures (percentage per 10-year classes) and used
a chi-squared test of independence with Bonferroni correction for mul-
tiple comparisons [47] to test the similitude or the difference of age
structures between sites within islands, islands within a geographical
area and between geographical areas. We used age structures to assess
a date at which the understory modification by deer browsing had
become prominent on the islands with deer that we studied.
3. RESULTS
3.1. Ring-width chronologies and morphological
characters
3.1.1. Ring-width chronologies
3.1.1.1. Cross dating on deer-free islands
On deer-free islands, sections within each stem were easy
to cross-date with the help of pointer years on skeleton plots.
These results were confirmed by comparing the curves repre-
sentative of ring series. Mean chronologies were built for each
stem collected on deer-free islands. The agreement between
Can we reconstruct deer browsing history and how? 157
different stem chronologies was poor (inter-stem cross-dating):
only 6 out of the18 stems cross-dated (P < 0.001) (Fig. 3). The
skeleton plot confirmed that it was impossible to build a mean
chronology for the samples from deer-free islands.
3.1.1.2. Cross-dating on a deer-affected island
On the deer-affected island, most sections within each stem
could not be cross-dated whatever the method used. This
prevented building individual mean stem chronologies, except
for 2 stems for which a negative abrupt growth change was
observed in all sections (Fig. 4). This change coincided with
scars identifiable by visual examination. Before a scar, ring
width varied from year to year. The ring on which the scar
occurred was characterised by an abrupt negative growth
change. Then, from year (t + 1) onwards ring were very narrow
with little variation.
3.1.2. Morphological characteristics
A total of 325 sections were analysed. There was no signif-
icant variation between samples within the same category
(deer-free or deer-affected islands) except for the form of the
pith (Tab. II). This character differed significantly (P < 0.05)
between different samples from the deer-affected island.
Although all morphological characters were observed on both
Table II. Comparison of the occurrence of morphological characteristics of salal stems within (1) deer-free island (comparison between sites 1
and 2, df = 16), deer-affected island (comparison between sites 3 and 4, df = 13) and between deer-free and deer-affected islands (df = 31).
t = t-values and the P = P-values.
Category Free Affected Free Affected
Site number 1 2 tP 34 tP 1 + 2 3 + 4 tP
Pith centred 48.9 51.7 0.60 0.28 85.7 72.3 0.18 0.43 75.7 50.8 2.68 0.01
position not centred 51.1 48.3 14.3 27.8 24.4 49.2
Pith circular 79.9 85.9 0.75 0.23 43.3 71.5 2.56 0.05 83.2 64.9 2.83 0.01
form not circular 20.1 14.1 56.7 28.5 16.8 35.1
Section circular 85.3 82.7 0.22 0.41 29.5 36.8 0.51 0.31 83.8 34.3 5.77 0.001
form not circular 14.8 17.3 70.5 63.3 16.2 65.7
Decaying presence 9.7 5.0 0.73 0.24 38.6 25.1 1.67 0.06 7.1 29.6 4.42 0.001
wood absence 90.3 95.0 61.4 74.9 92.9 70.4
Lobes presence 7.8 12.1 0.68 0.25 60.9 42.0 1.62 0.07 10.2 48.3 5.79 0.001
absence 92.2 87.9 39.1 58.0 89.8 51.7
Wedging presnece 1.6 3.8 0.85 0.20 8.5 7.9 0.13 0.45 2.8 8.1 2.17 0.04
rings absence 98.5 96.2 91.5 92.1 97.2 91.9
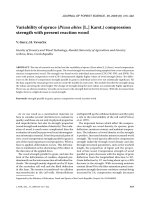
Figure 3. Good agreement obtained with the method of plotted curves
(standardized ring series) between mean chronologies of salal indi-
viduals 1.4, 2.1, 2.4, 2.6, 2.7 and 2.8 (inter-stem cross-dating) on
deer-free islands (samples 1 and 2).
Figure 4. Good agreement showing negative abrupt growth changes
of all sections within a stem collected from the base to the top on the
two browsed individual (salal 3 and 4) collected on the deer-affected
island. The section 3.5.1 is the basal section of the individual 5 of the
sample 3, the section 3.5.111 is the apical section. The section 3.4.1
is the basal section of the individual 4 of the sample 3, the section 3.4.5
is the apical section.
158 B. Vila et al.
deer-free and deer-affected islands, their frequency varied sig-
nificantly between the two island categories (P < 0.01) except
for wedging rings (Fig. 5 and Tab. II). The major contrast
between deer-free and deer-affected islands was observed for
the frequency of lobes and of non circular sections and, to a
lesser extent for decaying wood, pith position and pith form
(Tab. II). On deer-free islands, salal stems were (1) circular,
(2) their pith was centred, not deformed, (3) rings were concentric
and (4) bark was continuous around the circumference. Com-
pared to deer-free islands salal stems from deer-affected islands
were characterised by (1) altered stem geometry near a scar,
(2) distorted pith towards the scar, with sometimes pith laid
against the bark and not centred, (3) the presence of callous tis-
sue enclosing the wounded tissue, a process which is slow and
not always effective, (4) the presence of a brown and white col-
oration with changes in wood texture and compartmentalisa-
tion through structural and chemical boundaries in order to
resist the diffusion of pathogens.
Figure 5. Percentage of each morphological character observed between individuals of deer-free and deer-affected islands. Stars indicate signi-
ficance related to P-values. ∗∗∗ P < 0.001, ∗∗ P < 0.01, ∗ P < 0.05.
Can we reconstruct deer browsing history and how? 159
3.2. Stem age structure
3.2.1. Variation in stem age, height and foliage
distribution
Stems were significantly older on the deer-affected islands
(mean ± S.E. = 29.89 ± 2.10) than on the deer-free islands
(16.02 ± 1.38; nested ANOVA, P < 0.05). Within the deer-
affected islands, post-hoc tests show (1) that there were no sig-
nificant differences in mean age of salal stems between Reef,
Ramsay and Burnaby Islands (P > 0.05) all with deer and
(2) that mean age at the south of Moresby Island (with deer)
did not differ significantly from mean age observed on Burnaby
Island (P > 0.05) but was significantly lower than mean age
observed on Reef and Ramsay Islands (P < 0.001) (also with
deer). The post-hoc tests reveal also that mean stem age was
significantly different between the sites from south of Moresby
Island and the sites from the deer-free islands (P < 0.001).
Stem height varied significantly from site to site (P < 0.001)
but the variation was not correlated to the presence or absence
of deer (P = 0.25) or to islands (P = 0.76).
Mean height of the first salal leaves along a stem was higher
(P < 0.001) and less variable on the deer-affected islands (mean
± SE = 1.26 ± 0.05 m) than on the deer-free islands (0.90 ±
0.09 m). In presence of deer, there were no stems with leaves
under the browse line.
3.2.2. Age structures
There was no variation in age structure between sites within
a given island (P > 0.05). We therefore grouped sites from a
given island to compare age structures between islands (Fig. 6).
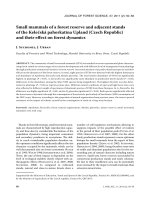
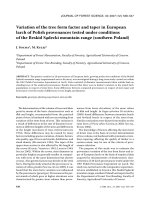
Figure 6. Age structures (% of stems per 10-year-classes) on the different islands. Deer-affected islands are ordered from north to south.
160 B. Vila et al.
Stem age structures on deer-free islands differed significantly
from the age structure on deer-affected islands (P < 0.001 for
comparison with pooled data for Reef, Ramsay and Burnaby
and P < 0.001 for comparison with south-Moresby).
On deer-free islands, 96% of the stems were less than
30 years old and 100% were less than 40 years old. Each of the
first 3 age classes contained at least 20% of the stems. Age
structure was similar on all deer free islands (P < 0.05).
On deer-affected islands, age structure varied with locality.
The percentage of stems older than 30 years decreased from
north to south. On Reef Island over 63% of the stems were older
than 30 years, on Ramsay Island over 61%. On Burnaby Island
this percentage dropped to 33.3% and on the south of Moresby
Island to 29.8%. Reef and Ramsay Islands are also character-
ized by a deficit of stems in the age-class 11–20. There were
no stems younger than 10 years on Reef, Ramsay as well as
Burnaby Islands. On the southern tip of Moresby, a deficit of
stems was only observed in the age-class 1–10. Although the
age structure on Burnaby was statistically similar to the age
structure on Reef and Ramsay (P > 0.05), only the age structures
observed on Reef and on Ramsay did differ statistically from the
age structure observed on the southern tip of Moresby (P < 0.01).
4. DISCUSSION
4.1. Understanding salal growth pattern and deer
signatures on salal
On deer-free islands, the overall absence of correlation
between stem mean chronologies suggests that individual fac-
tors exert a stronger influence upon salal diameter growth than
do factors affecting the whole stand. According to Schwein-
gruber (1988) [45], many living angiosperms seem to follow
endogenous growth rhythms independent from variation induced
by climate. However the poor agreement between stem chro-
nologies in salal may also reflect inter-individual competition.
4.1.1. Deer effect on growth rate
On deer-affected islands, we analyse the abrupt negative
growth change associated with browsing scars as the conse-
quence of severe leaf and shoot removal by deer. Such reduc-
tion in growth of defoliated plant parts has been observed by
Honkanen and Haukioja (1994) [20] and Krause and Raffa
(1996) [24]. This pattern can also be seen as a mirror image of
the pattern we observed in young trees when they escape deer
browsing [51, 53]. We suggest that the repetitive, irregular and
partial defoliation by deer also explains the asynchronism
observed in stem sections from deer-affected islands, in con-
trasts to the synchronism observed for sections collected on
deer-free islands. Thus identifying, counting and dating abrupt
growth changes in salal populations should allow to reconstruct
the local history of deer browsing in a way similar to what has
been done using adult tree rings [26] to reconstruct the history
of insect outbreaks [31, 32, 42] or scars to reconstruct past car-
ibou activity [33], porcupine expansion [36], beaver occupa-
tion [4] or changes in deer population [34, 35].
4.1.2. Deer impact on ring shape, section form,
pith and wood decay
On deer-affected island, the steep increase of the frequency
of morphological characters in salal stems has to be attributed
to deer browsing. Partial removal of cambium by deer also
results in incomplete rings that produce lobes when they super-
pose, deforming the stem section. Pith position and pith form
also are altered but less so than section form. Pith formation is
actually over when browsing occurs whereas section form is
produced by the cambium that is susceptible to be removed or
partially destroyed by deer. As a result section form is one of
the best characters to diagnose deer impact. Wood decay can
be attributed to deer browsing and the pathways they create for
pathogens. In the patches of decaying wood, for example,
bleaching and weight reduction are caused by fungi [44]. On
deer-affected island the occurrence of such patches of decaying
wood, contrasts with deer-free islands and reflects the specifi-
city of deer caused injuries. Wedging rings to the contrary are
least characteristic. They occur between sequences of normal
rings and result from failures in cambial activity unrelated to
the presence of deer. The distribution of these morphological
features in situations of known deer densities could actually
produce valuable calibrations to indirectly assess deer densities
where direct estimates are not available.
4.2. Reconstructing deer colonization history using
stem age structure
In dense salal stands, such as those on deer-free islands, we
observed a balanced stem age structure that resulted from the
constant production of new sprouts [17, 19] which progres-
sively replaced older stems that die off. On islands with deer,
deer prevent such a replacement [39] and only stems that had
foliage above the browse line when deer browsing started were
able to remain alive, this until they eventually die from old age.
The lack of stem recruitment from rhizomes on deer-affected
islands had already been diagnosed by Pojar et al. [39]. On
heavily browsed sites, this process can lead to the total elimi-
nation of the shrubby understory [10, 49, 50].
The variation we observed in stem age structures suggests
deer impact has been prevalent for at least 20 years before this
study in the sites sampled on Reef, Ramsay and Burnaby
islands, suggesting comparable histories of deer impact across
most of the southern half of the archipelago. On the southern
tip of Moresby Island prevalent deer impact seems to have
taken place only for the 10 years before this study. These north
south differences could be interpreted as a result of distance to
the point of introduction. However, we know that deer were
present in the south of the archipelago already in 1946 [14].
This increased time lag between initial colonization and heavy
impact in the south of the archipelago could result from differ-
ences in habitat and climate. The south of Moresby Island is
situated in the very wet hypermaritime sub-zone, with higher
precipitation and differences in vegetation composition [3],
factors known to influence deer population dynamic [16, 22].
The overall pattern is remarkably consistent with the pattern
observed for the other dominant long lived shrub, the red huck-
leberry, on the same islands [54]. However the time span of
prevalent deer impact suggested on Reef, Ramsay and Burnaby
Can we reconstruct deer browsing history and how? 161
islands by red huckleberry stem age structure is about 20 years
longer than the one suggested by the results from salal. In addi-
tion the study of fraying scars on some of these islands provided
dates of deer presence that were about a decade earlier than those
obtained from red huckleberry [54]. These different estimates
on the duration of deer presence illustrate the importance to
understand the processes that are behind the different types of
signatures and their complementary nature. Red huckleberry
shrubs, for instance, tend to occur in relatively open understories
with moderate impediment to deer movement, whereas salal often
comes in dense thickets that make up physical barriers to deer
movement. In addition, huckleberry stems can survive the lack
of replacement by new stems for about 100–120 years against
50–60 years for salal stems. Finally, most surviving salal shrubs
occur near remnant thickets, their age structure will reflect
more the history of deer impact on these particular thickets than
the time since deer have become abundant on an island. While
stem age structures provide indications about when deer impact
on the understory became prevalent, fraying scars can provide
date estimates for the actual date of colonisation of an island.
Investigations on plant-herbivore interactions can be con-
siderably enhanced by the historical context provided by the
study of ligneous species, especially when this information
cannot be obtained from other repositories. The signatures deer
have left in the wood are probably the most widespread and reli-
able source of information but we need to develop the tools to
read them. Such tools should allow developing a better knowl-
edge of browsing history from the regional scale to the scale
of local plant populations and individual plants within these
populations. Browsing signatures could also be used to monitor
the changes occurring in ecosystems in which browsing pres-
sure has been reduced and, more generally, yield essential
insights on how forest ecosystems work.
Acknowledgements: This research was part of a long-term project by
the Research Group on Introduced Species (RGIS, ).
Funding was provided by Canada – British Columbia South Moresby
Forest Replacement Account (SMFRA), by Forest Renewal British
Columbia (FRBC, Award: PA97335-BRE) and by joint funding from
Centre National de la Recherche Scientifique and Ministry of Foreign
Affairs of France (PICS 489). The Canadian Wildlife Service, the Brit-
ish Columbia Ministry of Forests (Queen Charlotte District), and the
Laskeek Bay Conservation Society provided logistic support. We are
thankful to Gwenaël Vourc’h, Collin French, Georges Yau and Corry
Millard for their help in the field. We also thank two anonymous
reviewers for constructive criticism of this manuscript.
REFERENCES
[1] Allen R.B., Bastow W.J., Mason C.R., Vegetation change fol-
lowing of grazing animals in depleted grassland, Central Otago,
New Zealand, J. Veg. Sci. 6 (1995) 615–626.
[2] Anderson R.C., Loucks O.L., White-tail deer (Odocoileus virginia-
nus) influence on structure and composition of Tsuga canadiensis
forests, J. App. Ecol. 16 (1979) 855–861.
[3] Banner A., Pojar J., Schawb J.W., Trowbridge R., Vegetation and soils
of the Queen Charlotte Islands: recent impacts of development, in:
Scudder G.G.E., Gessler N. (Eds.), The Outer Shores, Proceedings
of the Queen Charlotte Islands First International Symposium, Uni-
versity of British Columbia, August 1984, 1989, pp. 261–279.
[4] Bordage G., Filion L., Analyse dendroécologique d’un milieu rive-
rain fréquenté par le castor (Castor canadensis) au Mont du Lac-
des-Cygnes (Charlevoix, Québec), Naturaliste Canadian (Rev.
Ecol. Syst.) 115 (1988) 117–124.
[5] Bryant J.P., Chapin F.S., Klein D.R., Carbon/nutrient balance of
boreal plants in relation to vertebrate herbivory, Oikos 40 (1983)
357–368.
[6] Bunnel F.L., Reproduction of salal (Gaultheria shallon Pursh) under
forest canopy, Can. J. For. Res. 20 (1990) 91–100.
[7] Carl G.C., Guiguet C.J., Alien animals in British Columbia. Brit.
Col. Prov. Mus. Handb. 14. Victoria, BC, For. Ecol. Manage. 83
(1972) 1–11.
[8] Chouinard A., Filion L., Detrimental effects of white-tailed deer
browsing on Balsam fir growth and recruitment in a second-growth
stand on Anticosti Island, Québec, Ecoscience 8 (2001) 199–210.
[9] Crawley M.J., Plant–herbivore dynamics, in: Crawley M.J. (Ed.),
Plant Ecology, Blackwell Science, 1983.
[10] Daufresne T., Modification de la dynamique et de la diversité de la
végétation par un grand herbivore : influence de l’introduction du
cerf-à-queue noire dans la forêt primaire des îles Haida Gwaii
(Colombie Britannique, Canada), Diplôme d’Études Approfondies,
Université de Montpellier II, 1996, 38 p.
[11] Daufresne T., Martin J.L., Changes in the vegetation as a result of
browsing by a large herbivore: the impact of introduced Black-
tailed deer in the primary forest of Haida Gwaii, British Columbia,
in: Gaston A.J. (Ed.), Laskeek Research 7, Laskeek Conservation
Society, Queen Charlotte City, BC, 1997, pp. 2–26.
[12] Dorworth C.E., Sieber T.N., Woods T.A.D., Early growth perfor-
mance of salal (Gaultheria shallon) from various North American
west-coast locations, Ann. For. Sci. 58 (2001) 597–606.
[13] Drexhage M., Colin F., Effects of browsing on shoots and roots of
naturally regenerated sessile oak seedlings, Ann. For. Sci. 60
(2003) 173–178.
[14] Duff W., Kew M., Anthony Island: A home of the Haida, in: British
Columbia Museum report for 1957, Royal BC Museum, Location
Victoria, BC, 1958, pp. 37–64.
[15] Engelstoft C., Effects of Sitka Black-tailed Deer (Odocoileus
hemionus sitkensis) on understory in old-growth forest on Haida
Gwaii (Queen Charlotte Islands), MS, British Columbia University
of Victoria, Canada, 2001, 100 p.
[16] Forchhammer M.C., Stenseth N.C., Post E., Langvatn R., Popula-
tion dynamics of Norvegian deer: density-dependence and climatic
variation, Proceeding of the Royal Society of London, Serie B, Bio-
logical Science 265 (1998) 341–350.
[17] Fraser L., Turkington R., Chanway C.P., The biology of Canadian
weeds, 102, Gaultheria shallon Pursh, Can. J. Plant. Sci. 73 (1993)
1233–1247.
[18] Haeussler S., Coates D., Mather J., Autecology of common plants
in BC: a literature of review, Forest Resource Development Agree-
ment Report 158, 1990.
[19] Huffman D.W., Tappeiner J.C. II., Zasada J.C., Regeneration of
salal (Gaultheria shallon) in the Central Coast Range forests of
Oregon, Can. J. Bot. 72 (1994) 39–51.
[20] Honkanen T., Haukioja E., Why does a branch suffer more after
branch-wide than after tree-wide defoliation? Oikos 71 (1994) 441–
450.
[21] Kaennel M., Schweingruber F.H., Multilingual glossary of dendro-
chronology, Swiss Federal Institute for Forest, Snow and Landscap
Research, Berne, Stuttgart, Paul Haupt, Birmensdorf, 1995.
[22] Kirchhoff M.D., Effects of forest fragmentation on deer in south-
east Alaska. Federal Aid in Wildlife Restoration Research Final
report, Alaska Department of Fish and Game, Division of Wildlife
Conservation, Grant W-23, 4, 5. W-24-1, 2, Study 2, 10, Alaska,
USA, 1994, 51 p.
162 B. Vila et al.
[23] Kolishchuk V.G., Dendroclimatological study of prostrate woody
plants, in: Cook E.R., Kairiukstis L.A. (Eds.), Methods of dendro-
chronology. Applications in the environmental sciences, Kluwer
Academic Press, Dordrecht, 1990, pp. 51–55.
[24] Krause S.C., Raffa K.F., Differential growth and recovery rates fol-
lowing defoliation in related deciduous and evergreen trees, Trees
10 (1996) 308–316.
[25] Krause C., Morin H., Impact of spruce budworm defoliation on the
number of latewood tracheids in balsam fir and black spruce, Can.
J. For Res. 25 (1995) 2029–2034.
[26] Krause C., Morin H., Changes in radial increment in stems and
roots of balsam fir (Abies balsamea (L.) Mill.) after defoliation by
spruce budworm, For. Chron. 71 (1995) 747–754.
[27] Laurent-Hervouet N., Mesures des pertes de croissance radiales sur
quelques espèces de Pinus dues à deux défoliateurs forestiers. Cas
de la processionnaire du pin en région méditerranéenne, Ann. Sci.
For. 43 (1986) 239–262.
[28] Martin J.L., Daufresne T., Introduced species and their impact on
the forest ecosystem of Haida Gwaii, in: Wiggins G. (Ed.), Procee-
dings of the cedar symposium, Canada, BC, South Moresby Forest
Replacement Account, Victoria, Canada, 1999, pp. 69–89.
[29] Martin J.L., Baltzinger C., Interaction among deer browse, hunting
and tree regeneration, Can. J. For. Res. 32 (2002) 1254–1264.
[30] Mopper S., Maschinski J., Cobb N., Whitham T.G., A new look at
habitat structure: consequences of herbivore – modified plant archi-
tecture, in: Bell S.S., McCoy E.D., Mushinsky H.R. (Eds.), Habitat
structure, 1991, pp. 260–280.
[31] Morin H., Laprise D., Histoire récente des épidémies de la tordeuse
des bourgeons de l’épinette au nord du lac Saint-Jean (Québec): une
analyse dendrochronologique, Can. J. For. Res. 20 (1990) 1–8.
[32] Morin H., Laprise D., Bergeron Y., Chronology of spruce budworm
outbreaks near Lake Duparquet, Abitibi region, Québec, Can. J.
For. Res. 23 (1993) 1497–1506.
[33] Morneau C., Payette S., A dendroecological method to evaluate
past caribou (Rangifer tarandus L.) activity, Ecoscience 5 (1998)
64–70.
[34] Motta R., Dendroecology in ungulate forest damages: 1. Fraying
scars, Dendrochronologia 13 (1995) 33–41.
[35] Motta R., Dendroecology in ungulate forest damage: 2. Bark stri-
ping scars, Dendrochronologia 15 (1997) 11–22.
[36] Payette S., Recent porcupine expansion at tree line: a dendroecolo-
gical analysis, Can. J. Zool. 65 (1987) 551–557.
[37] Pilcher J.R., Sample preparation, cross-dating, and measurement,
in: Cook E.R., Kairiukstis L.A. (Eds.), Methods of dendrochrono-
logy. Applications in the environmental sciences, Kluwer Acade-
mic Press, Dordrecht, 1990, pp. 40–50.
[38] Pojar J., Banner A., Old-growth forests and introduced black-tailed
deer on the Queen Charlotte Islands, British Columbia, Meehan
W.R., in: Merell T.R., Hanley T.A. Jr. (Eds.), Fish an Wildlife
Relationships in Old-Growth Forests: Proceedings of a symposium
held in Juneau, Alaska, 12–15 April 1982, Am. Inst. Fish. Res.
Biol., 1989.
[39] Pojar J., Lewis T., Roemer H., Wildford D.J., Relationships
between introduced black-tailed deer and the plant life of the Queen
Charlotte Islands, British Columbia, Unpubl. Rep. Brit. Col. Min.
For. Smithers, BC, 1980.
[40] Pojar J., MacKinnon A., Plants of coastal British Columbia. Minis-
try of Forests and Lone Pine Publishing, Vancouver, BC, Canada,
1994.
[41] Reimoser F., Armstrong H., Suchant R., Measuring forest damage
of ungulates: what should be considered? For. Ecol. Manage. 120
(1999) 47–58.
[42] Rolland C., Baltensweiler W., Petitcolas V., The potential for using
Larix decidua ring widths in reconstructions of larch budmoth (Zei-
raphera diniana) outbreak history: dendrochronological estimates
compared with insect surveys, Trees 15 (2001) 414–424.
[43] Roughton R., Shrub age structure on a mule deer winter range in
Colorado, Ecology 53 (1972) 615–625.
[44] Schweingruber F.H., Anatomie microscopique du bois, Kommis-
sionsverlag. F. Flück-Wirth, Internationale Buchhandlung für
Botanik und Naturwissenschaften, CH-9053 Teufen AR., 1978.
[45] Schweingruber F.H., Tree-rings, Basics and applications of dendro-
chronology, D. Reidel Publ. Co., Dordrecht, Holland, 1988.
[46] Schweingruber F.H., Tree Rings and Environment. Dendroecology,
Birmensdorf, Swiss Federal Institute for Forest, Snow and Land-
scap Research, Berne, Stuttgart, Paul Haupt, 1996.
[47] Sokal R.R., Rohlf F.J., Biometry. The principales and practicle of
statistics in biology research, 3rd ed., Freeman and Co., 1995.
[48] Stokes M.A., Smiley T.L., An introduction to tree-ring dating, Chi-
cago, Univ. of Chicago Press, 1968.
[49] Stockton S.A., The effect of introduced Sitka black-tailed deer,
Odocoileus hemionus sitkensis Merriam, on the forest understorey
plant communities of Haida Gwaii, British Columbia: pattern,
process, and recovery, Ph.D. thesis, University of Ottawa, Ottawa,
Canada, 2003, 214 p.
[50] Stockton S., The effects of deer on plant diversity, in : Gaston A.J.,
Golumbia T.E., Martin J.L., Sharpe S.T. (Eds.), Lessons from the
islands: introduced species and what they tell us about how
ecosystems work. Proceedings from the Research Group on
Introduced Species 2002 Conference, Queen Charlotte City, British
Columbia, Canadian Wildlife Service Occasional (in press).
[51] Vila B., Keller T., Guibal F., Influence of browsing cessation on
Picea sitchensis radial growth, Ann. For. Sci. 58 (2001) 853–859.
[52] Vila B., Guibal F., Martin J.L., Torre F., Growth change of young
Picea sitchensis in response to deer browsing, For. Ecol. Manage.
180 (2003) 413–424.
[53] Vila B., Torre F., Martin J.L., Guibal F., Response of young Tsuga
heterophylla to deer browsing: developing tools to assess deer
impact on forest dynamics, Trees-Struct. Funct. 17 (2003) 547–
553.
[54] Vila B., Torre F., Guibal F., Martin J.L., Can we reconstruct deer
browsing history, and how far back? Lessons from Vaccinium
parvifolium Smith in Rees, For. Ecol. Manage. 201 (2004) 171–185.
[55] Vourc’h G., Vila B., Gillon D., Escarré J., Guibal F., Fritz H., Clausen
T.P., Martin J.L., Disentangling the causes of damage variation by
deer browsing on young Thuja plicata, Oikos 98 (2002) 271–283.
[56] Weber U., Ecological pattern of larch budmoth (Zeiphera diniana)
outbreaks in the Central Swiss Alps, Dendrochronologia 13 (1995)
11–31.
[57] Woodward A., Schreiner E.G., Houston D.B., Moorhead B.B.,
Ungulate-forest relationships in Olympic National Park: retrospec-
tive exclosure studies, Northwest Science 68 (1994) 97–110.