Industrial Control Student Guide Version 1.1 phần 1 pps
Bạn đang xem bản rút gọn của tài liệu. Xem và tải ngay bản đầy đủ của tài liệu tại đây (491.31 KB, 25 trang )
Industrial Control
Student Guide
Version 1.1
Note regarding the accuracy of this text:
Many efforts were taken to ensure the accuracy of this text and the
experiments, but the potential for errors still exists. If you find
errors or any subject requiring additional clarification, please report
this to so we can continue to
improve the quality of our documentation.
Warranty
Parallax warrants its products against defects in materials and workmanship for a period of 90 days. If you discover a defect, Parallax
will, at its option, repair, replace, or refund the purchase price. Simply call for a Return Merchandise Authorization (RMA) number,
write the number on the outside of the box and send it back to Parallax. Please include your name, telephone number, shipping
address, and a description of the problem. We will return your product, or its replacement, using the same shipping method used to
ship the product to Parallax.
14-Day Money Back Guarantee
If, within 14 days of having received your product, you find that it does not suit your needs, you may return it for a full refund. Parallax
will refund the purchase price of the product, excluding shipping / handling costs. This does not apply if the product has been altered
or damaged.
Copyrights and Trademarks
This documentation is copyright 1999 by Parallax, Inc. BASIC Stamp is a registered trademark of Parallax, Inc. If you decide to use the
name BASIC Stamp on your web page or in printed material, you must state: "BASIC Stamp is a registered trademark of Parallax, Inc."
Other brand and product names are trademarks or registered trademarks of their respective holders.
Disclaimer of Liability
Parallax, Inc. is not responsible for special, incidental, or consequential damages resulting from any breach of warranty, or under any
legal theory, including lost profits, downtime, goodwill, damage to or replacement of equipment or property, and any costs or
recovering, reprogramming, or reproducing any data stored in or used with Parallax products. Parallax is also not responsible for any
personal damage, including that to life and health, resulting from use of any of our products. You take full responsibility for your BASIC
Stamp application, no matter how life threatening it may be.
Internet Access
We maintain Internet systems for your use. These may be used to obtain software, communicate with members of Parallax, and
communicate with other customers. Access information is shown below:
E-mail:
Web:
and
Internet BASIC Stamp Discussion List
We maintain two e-mail discussion lists for people interested in BASIC Stamps (subscribe at under the
technical support button). The BASIC Stamp list server includes engineers, hobbyists, and enthusiasts. The list works like this: lots of
people subscribe to the list, and then all questions and answers to the list are distributed to all subscribers. It’s a fun, fast, and free
way to discuss BASIC Stamp issues and get answers to technical questions. This list generates about 40 messages per day.
The Stamps in Class list is for students and educators who wish to share educational ideas. To subscribe to this list, go to
and look for the E-groups list. This list generates about five messages per day.
Contents
Table of Contents
Preface ............................................................................................................................................ iii
Preface ................................................................................................................................................................................... iii
Audience and Teacher’s Guides..........................................................................................................................................iv
Copyright and Reproduction ...............................................................................................................................................v
Experiment #1: Flowcharting and Stamp Plot Lite ............................................................................... 7
Adjusting the Temperature for a Shower Example........................................................................................................ 8
Conveyor Counting Example .............................................................................................................................................10
Exercise #1: Flowchart Design ..........................................................................................................................................14
Exercise #2: LED Blinking Circuit ......................................................................................................................................14
Exercise #3: Analog Data....................................................................................................................................................17
Exercise #4: Using Stamp Plot Lite ..................................................................................................................................20
Questions and Challenge ...................................................................................................................................................25
Experiment #2: Digital Input Signal Conditioning ............................................................................... 27
Exercise #1: Switch Basics.................................................................................................................................................32
Exercise #2: Switch Boune and Debouncing Routines .................................................................................................37
Exercise #3: Edge Triggering .............................................................................................................................................40
Exercise #4: An Electronic Switch....................................................................................................................................47
Exercise #5: Tachometer Input.........................................................................................................................................52
Questions and Challenge ...................................................................................................................................................64
Experiment #3: Digital Output Signal Conditioning ............................................................................ 71
Exercise #1: Sequential Control .......................................................................................................................................74
Exercise #2: Current Boosting the BASIC Stamp..........................................................................................................85
Questions and Challenge ...................................................................................................................................................91
Experiment #4: Continuous Process Control ..................................................................................... 97
Exercise #1: Closed Loop On-Off Control......................................................................................................................98
Exercise #2: Open-Loop vs. Closed-Loop Control .....................................................................................................113
Questions and Challenge .................................................................................................................................................125
Experiment #5: Closed-Loop Control ...............................................................................................127
Exercise #1: Establishing Closed-Loop Control ..........................................................................................................130
Exercise #2: Differential-Gap Control ..........................................................................................................................136
Questions and Challenge .................................................................................................................................................142
Experiment #6: Proportional Integral Derivative Control ..................................................................145
Exercise #1: Bias Drive .....................................................................................................................................................155
Exercise #2: Proportional Integral Control..................................................................................................................172
Exercise #3: Derivative Control......................................................................................................................................179
Questions and Challenge .................................................................................................................................................187
Page i
Contents
Experiment #7: Real-time Control and Data Logging ........................................................................ 189
Exercise #1: Real Time Control.......................................................................................................................................192
Questions and Challenge..................................................................................................................................................199
Exercise #2: Interval Timing.............................................................................................................................................199
Questions and Challenges................................................................................................................................................203
Exercise #3: Data Logging ................................................................................................................................................204
Questions and Challenges................................................................................................................................................219
Appendix A: Stamp Plot Lite ........................................................................................................... 221
Appendix B: Encoder Printouts ....................................................................................................... 233
Appendix C: Potter Brumfield SSR Datasheet.................................................................................. 235
Appendix D: National Semiconductor LM34 Datasheet..................................................................... 239
Appendix E: National Semiconductor LM358 Datasheet.................................................................... 245
Appendix F: Dallas Semiconductor 1302 Datasheet.......................................................................... 251
Appendix G: Parts Listing and Sources ............................................................................................ 257
Appendix H: Commercial Incubator Challenge ................................................................................. 261
Page ii
Preface
Preface
Industrial process control is a fascinating and challenging area of electronics technology and nothing
has revolutionized this area like the microcontroller. The microcontroller has added a level of intelligence to
the evaluation of data and a level of sophistication in the response to process disturbances. Microcontrollers
are embedded as the “brains” in both manufacturing equipment and consumer electronic devices.
Process control involves applying technology to an operation that alters raw materials into a desired
product. Virtually everything that you use or consume has undergone some type of automatic process control
in its production. In a manufacturing environment, automatic process control also provides higher
productivity and better product consistency while reducing production costs.
This text is intended to introduce you to the concepts and characteristics of microcontroller-based
process control with the following experiment-based themes:
a) Writing a procedural program from a flowchart for sequential process-control.
b) Using pushbuttons, counting cycles and understanding simple I/O processes that form a
system “under control”.
c) Continuous process-control beginning with on-off control to more complex differential gap
with multiple levels of control action.
d) Proportional-integral-derivative control of a small desktop heating system.
e) Time-based control of the above and introduction to data logging.
The hardware needed in the experiments to simulate the process has been kept to a bare minimum.
While the microcontroller is the “brains” of the process, it is not the “muscle.” Actual applications require the
microcontroller to read and control a wide variety of input and output (I/O) devices. Simple breadboard
mounted pushbutton switches are used to simulate the action of mechanical and electro-mechanical switches
found in industry. Visible light emitting diodes, small fans, and low-wattage resistors simulate motor starters
and HVAC equipment. Information included in the experiments will help you understand the electrical
interfacing of “real world” I/O devices to the BASIC Stamp.
The physical nature of the elements in a system determines the most appropriate mode of control
action. The dynamics of a process include a study of the relationship of input disturbances and output action
on the measured variables. It is difficult to understand the dynamics of a process without being able to “see”
this relationship. For the authors, this defined a need to develop a graphical interface for the BASIC Stamp;
hence the creation and release of StampPlot Lite. This software allows digital and analog values to be plotted
on graphs, and time-stamped data and messages to be stored. StampPlot Lite is used throughout the
experiments, and is especially helpful as you investigate the various modes of process control. Typical screen
shots from program runs are included.
Page iii
Preface
This text is the first major revision and we have strived to make it better than the first. Some
changes and additions include:
a)
b)
c)
d)
Addition of a 7th section on Time-Based control.
A total rewrite of the PID section to better demonstrate and explain the theory.
The additions of FET and PWM sample-and-hold circuitry and theory.
The reworking of numerous example programs including more flowcharts and program
explanations.
We thank our editors Ms. Cheri Barrall and Dale Kretzer, and of course Ken Gracey and Russ Miller of
the Parallax staff for their review and improvement of this text. Further, we thank Dr. Clark Radcliffe of
Michigan State University for his in-depth review. A variety of additional Parallax educational customers too
numerous to list also provided valuable feedback for this second revision.
The authors are instructors at Southern Illinois University in Carbondale in the Electronic Systems
Technologies program and also partners of a consulting and software company, SelmaWare Solutions. Visit
the website to see examples of StampPlot Pro specifically tailored to users of this text.
We invite your comments and feedback. Please contact at us through our website, and copy all error
changes to Parallax at so the text may be revised.
Will Devenport and Martin Hebel
Southern Illinois University, Carbondale
Electronic Systems Technologies
/>
-- and --
SelmaWare Solutions
Audience and Teacher’s Guide
This text is aimed at an audience ages 17 and older. Effective during the first publication of this text
in June, 2000, there is no Teacher's Guide edition planned. If a Teacher's Guide were to be published, it would
likely be available the first part of year 2002. Solving these experiments presents no difficult technical
hurdles, and can be done with a bit of patience.
Page iv
Preface
Copyright and Reproduction
Stamps in Class lessons are copyright Parallax 2001. Parallax grants every person conditional
rights to download, duplicate, and distribute this text without our permission. The condition is that this text,
or any portion thereof, should not be duplicated for commercial use resulting in expenses to the user beyond
the marginal cost of printing. That is, nobody should profit from duplication of this text. Preferably,
duplication should have no expense to the student. Any educational institution wishing to produce duplicates
for its students may do so without our permission. This text is also available in printed format from Parallax.
Because we print the text in volume, the consumer price is often less than typical xerographic duplication
charges. This text may be translated into any language with the prior permission of Parallax, Inc.
Page v
Preface
Page vi
Experiment #1: Flowcharting and StampPlot Lite
A flowchart is a detailed graphic representation illustrating the
nature and sequencing of an operation on a step-by-step basis.
A flowchart may be made of an everyday task such as driving to
the store. How many steps are involved in this simple task? How
many decisions are made in getting to the store? A formalized
operation such as baking cookies can be flowcharted, whether
on a small-scale process in your kitchen or on a very large scale in a commercial bakery. And, of course, a
flowchart also may be made of the steps and decisions necessary for a computer or microcontroller to carry
out a task.
Experiment #1:
Flowcharting and
StampPlot Lite
A relatively simple process is usually easy to understand and flows logically from start to finish. In the case of
baking cookies, the steps involved are fairly easy. A recipe typically requires mixing the required ingredients,
forming the cookies and properly baking them. There are several decisions to make: Are the ingredients mixed
enough? Is the oven pre-heated? Have the cookies baked for the recommended time?
As processes become more complex, however, it is equally more difficult to chart the order of events needed
to reach a successful conclusion. A BASIC Stamp program may have several dozen steps and possibly a
number of “if-then” branches. It can be difficult to grasp the flow of the program simply by reading the code.
A flowchart is made up of a series of unique graphic symbols representing actions, functions, and equipment
used to bring about a desired result. Table 1.1 summarizes the symbols and their uses.
Table 1.1: Flowchart Symbols
Start/Stop box indicates the beginning and end of a program or
process.
Process box indicates a step that needs to be accomplished.
Input/Output box indicates the process requires an input or
provides an output.
Decision box indicates the process has a choice of taking
different directions based on a condition. Typically, it is in the
form of a
yes-no question.
Industrial Control Version 1.1 • Page 7
Experiment #1: Flowcharting and StampPlot Lite
Flowline is used to show direction of flow between symbols.
Connector box is used to show a connection between points of
a single flowchart, or different flowcharts.
Sub-routine or sub-process box indicates the use of a defined
routine or process.
Example #1: Adjusting the Temperature of a Shower
Let's take an example flowchart of an everyday task: adjusting the temperature for a shower. The process of
adjusting the water temperature has several steps involved. The water valves are initially opened, we wait a
while for the temperature to stabilize, test it, and make some decisions for adjustments accordingly. If the
water temperature is too cold, the hot valve is opened more and we go back to test it again. If the water is
too hot, the cold valve is opened more. Once we make this adjustment, we go back to the point where we wait
for a few seconds before testing again. Of course this doesn't take into account whether the valves are fully
opened. Steps may be inserted during the temperature adjustment procedure to correct for this condition.
Figure 1.2 shows a flowchart of this process.
This example demonstrates a process that may be used in adjusting the temperature, but could it also be the
steps in a microcontroller program? Sure! The valves may be adjusted by servos, and the water temperature
determined with a sensor. In most cases, a simple process we go through can be quite complex for a
microcontroller. Take the example of turning a corner in a car. Can you list all the various inputs we process in
making the turn?
Page 8 • Industrial Control Version 1.1
Experiment #1: Flowcharting and StampPlot Lite
Figure 1.1: Shower Temperature Example
Yes
No
Yes
No
Industrial Control Version 1.1 • Page 9
Experiment #1: Flowcharting and StampPlot Lite
Example #2: Conveyor Counting Example
Let's look at a real scenario and develop a flowchart for it. In a manufacturing plant, items are boxed and sent
down a conveyor belt to one of two loading bays with trucks waiting. Each truck can hold 100 boxes. As the
boxes arrive, workers place them on the first truck. After that truck is full, the boxes must be diverted to the
second truck so the loaded truck can be moved out and an empty one moved into position. Also, in the event
of an emergency or problem, there must be a means of stopping the conveyor.
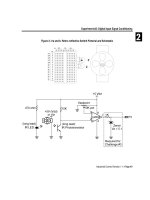
The physical aspects of the scenario are illustrated in Figure 1.2. The motor for the belt is labeled MOTOR1.
The sensor to detect the boxes as they pass is labeled DETECTOR1. The lever to direct boxes to one truck
conveyor or the other is labeled DIVERTER1. The emergency stop button is labeled STOP1.
Figure 1.2: Conveyor Counting Example
Page 10 • Industrial Control Version 1.1
Experiment #1: Flowcharting and StampPlot Lite
Let's list in order a brief description of what must occur:
•
•
•
•
Start the conveyor motor.
Count the boxes as they pass.
When 100 boxes have passed, switch the diverter to the opposite position.
Whenever the emergency stop is pressed, stop the conveyor.
Now that we know the basic steps involved, let's develop a flowchart for the process. Let's begin by looking at
the simple process flow in Figure 1.3 on the following page.
Notice the placement of the Input/Output box for checking the emergency stop button, STOP1. It ensures the
button is tested during every cycle. What if we had placed it following the 100-count decision box? How long
would it have taken from when the button was pushed until the conveyor stopped?
Does the flowchart describe everything our program needs to do? Definitely not, but it is a good start at
determining the overall flow of the process. Look at the "Count Boxes with DETECTOR1" Process box. How
exactly is this carried out? We may need to develop a flowchart to describe just this routine. If a process
needs further detailing, we might replace the Process box with a Sub-Process box as shown in Figure 1.4.
Figure 1.4: Sub-Process Box
How involved is it to simply count a box passing by a detector? If DETECTOR1 is activated by “going low,” do we
count? When the detector stays low, how do we keep from recounting it again the next time our program
passes that point? What if the box bounces on the conveyor as it enters our beam? How do we keep from
performing multiple counts of the box? These answers may not be as simple as they seem. Even when
performing a task as simple as counting a passing box, many variables must be taken into account.
Industrial Control Version 1.1 • Page 11
Experiment #1: Flowcharting and StampPlot Lite
Figure 1.3: Conveyor Counting Flowchart
Page 12 • Industrial Control Version 1.1
Experiment #1: Flowcharting and StampPlot Lite
Another consideration is the output of our detector. Can we directly measure the output using one of the
BASIC Stamp inputs, or is there some circuitry needed to condition the signal first?
Let's consider an output in our conveyor counting example. How do we energize the motor? It is doubtful the
5-volt, milliamp-rated output of the BASIC Stamp will be able to drive a motor of sufficient horsepower to
move a conveyor! How do we condition an output of the BASIC Stamp to control a higher voltage and current
load?
These issues will be considered as you work through the chapters in this text. What may seem simple for us to
do as humans may require some sophisticated algorithms for a microcontroller to mimic. We will use readily
available electronic components, a BASIC Stamp module, and the Board of Education to simulate some
complex industrial control processes.
Industrial Control Version 1.1 • Page 13
Experiment #1: Flowcharting and StampPlot Lite
Exercises
Exercise #1: Flowchart Design
Develop a flowchart that will energize a heater below 100 degrees and de-energize it above 120 degrees.
Exercise #2: LED Blinking Circuit
We’ll use a simple circuit to demonstrate a flowchart process and the program to perform the task. You’ll
need to build the circuit shown in Figure 1.5. The following parts will be required for this experiment:
(1) LED, green
(2) 220-ohm resistors
(1) 10K-ohm resistor
(1) Pushbutton
(1) 10K-ohm multi-turn potentiometer
(1) 1 uF capacitor
(Miscellaneous) jumper wires
Figure 1.5: Exercise #2 Blinking Circuit Schematic
Page 14 • Industrial Control Version 1.1
Experiment #1: Flowcharting and StampPlot Lite
The circuit you are building consists of a single
input button and a single output LED. Here is
the process we want to perform: when the
button (PB1) is pressed, blink the green LED
(LED1) five times over 10 seconds. The
flowchart for our process is shown in Figure
1.6.
Figure 1.6: Exercise #2 Blinking Circuit Flowchart
Notice a few things about the flowchart. Our
main loop is fairly simple. In the Initialize
process box, we will define any variables
needed and set initial outputs (LED off) and will
loop unless PB1 is pressed, which calls our
subroutine, blink_led1. Our subroutine
doesn't begin with "Start,” but the name of the
process, so that we can identify it. The
flowchart describes a process that we will
repeat five times, alternately energizing and
de-energizing our LED for one second each
time.
Now that we have a flowchart to describe the
process, how do we program it in PBASIC?
Programmatically, we can sense PB1 using the
IN statement. We have two ways we can call
our subroutine. If the condition is true (1), then
we can branch to our subroutine directly using
an IF-THEN statement. This would be treated
as a PBASIC GOTO. Once this completes, we
would need to GOTO back to our main loop. Or,
if the condition is false (0), we can branch back
to our main loop from the IF-THEN, and use a
GOSUB command to branch to our subroutine
when true. We can then use a RETURN when
our subroutine is complete.
Industrial Control Version 1.1 • Page 15
Experiment #1: Flowcharting and StampPlot Lite
In our blink_led1 subroutine, we need a loop to repeat five times. Choices for accomplishing this task may
be to set up a variable we increment and check during each repetition, or use the FOR-NEXT statement to
accomplish it for us.
The flowchart describes the general steps involved in accomplishing a process. The code required is flexible as
long as it faithfully completes the process as described. The same flowchart may be used in multiple languages
or systems and even for humans!
Program 1.1 is one way to write the code for our blinking LED process. Enter the text in the BASIC Stamp
editor, download it to the BASIC Stamp, and press the pushbutton of the circuit you built. If it works properly,
the LED will blink five times after the pushbutton is pressed.
'Program 1.1; Blinking LED Example
Cnt
VAR
BYTE
PB1
VAR
IN1
LED1
CON
4
'Variable for counting
'Variable for PB1 input
'Variable for LED1 output
INPUT 1
OUTPUT 4
'Set PB1 as input
'Set LED1 as output
LOW LED1
'Turn off LED
Start:
IF PB1 = 0 then Start
GOSUB Blink_LED1
GOTO Start
'Not Pressed? Go back to loop
'If it was pressed then perform subroutine
'After return, go back to start
Blink_LED1:
For Cnt = 1 to 5
HIGH LED1
PAUSE 1000
LOW LED1
PAUSE 1000
NEXT
'Subroutine to blink LED 5 repetitions
'Setup loop for 5 counts
'Turn ON LED
'Wait 1 second
'Turn off LED
'wait 1 second
'Repeat loop until done
RETURN
'return back to after gosub call
Programming Challenge
Flowchart and program a process where the LED will blink four times a second while the pushbutton is NOT
pressed!
Page 16 • Industrial Control Version 1.1
Experiment #1: Flowcharting and StampPlot Lite
Exercise #3: Analog Data
In many instances a process involves analyzing and responding to analog data. Digital data is simply on or off
(1 or 0). This is comparable to the simple light switches in our homes. The light is on or it is off. Analog data on
the other hand is a range of values. Some examples include the level of lighting if we use a dimmer switch
instead of an on/off switch, or the temperature of the water coming out of our shower nozzle.
There are several methods to bring analog data into a microcontroller, such as using an analog-to-digital
(A/D) converter that changes analog values into digital values that may be processed by the microcontroller.
Another method used by the BASIC Stamp is a resistor/capacitor network to measure the discharge or charge
time of the capacitor. By varying the amount of the resistance, we can affect and measure the time it takes
the capacitor to discharge. In this experiment, resistance is set by manually adjusting a variable resistor. But
the device may be more sophisticated, such as a photo-resistive cell that changes resistance depending on the
amount of light shining on it, or a temperature sensor. More discussion on analog data is found in later
sections, but for now let's perform a simple process-control experiment using an analog value.
Add the RC network shown in Figure 1.7 to your circuit from the previous experiment. It uses these parts:
(1) 1 uF capacitor
(1) 10K potentiometer
Figure 1.7: Schematic for Analog Data circuit added to Exercise #3
Industrial Control Version 1.1 • Page 17
Experiment #1: Flowcharting and StampPlot Lite
PBASIC Command Quick Reference: RCTime
RCTIME pin, state, resultvariable
•
•
•
.
Pin is the I/O pin connected to the RC network.
State is the input voltage of that pin.
Resultvariable is normally a word-length variable containing the results of the command.
The PBASIC command we will use to read the analog value of the potentiometer is RCTIME. A typical block of
code to read the potentiometer is as follow:
Pot
VAR WORD
HIGH 7
PAUSE 10
RCTIME 7, 1, Pot
In order for the BS2 to read the potentiometer, the routine needs to take the following steps:
•
•
•
•
•
+5V (HIGH) is applied to both sides of the capacitor to discharge it.
The BASIC Stamp pauses long enough to ensure the capacitor is fully discharged.
When RCTIME is executed, Pin 7 becomes an input. Pin 7 will initially read a high (1) because an
uncharged capacitor acts as short.
As the capacitor charges through the resistor, the voltage at Pin 7 will fall.
When the voltage at Pin 7 reaches 1.4 V (falling), the input state is read as low (0), stopping the
process and storing a value in Pot proportional to the time required for the capacitor to charge.
The greater the resistance, the longer the time required for a capacitor to discharge; therefore, the higher
the value of Pot. In this manner, we can acquire an analog value from a simple input device.
Let's write a process-control program to make use of this input. Our process will be one where temperature
is monitored and a heater energizes below 100 degrees and de-energized above 120 degrees. The
potentiometer will represent a temperature sensor and the LED will represent the heater being energized.
We will use the debug window to display our temperature and the status of the heater. The maximum
potentiometer value, with this combination of resistor and capacitor, may reach 5000, so we will divide it by
30 to scale it to a more reasonable range. Figure 1.8 is the flowchart of the process.
Page 18 • Industrial Control Version 1.1
Experiment #1: Flowcharting and StampPlot Lite
Figure 1.8: Exercise 3 - Simple Heater Flowchart
Industrial Control Version 1.1 • Page 19
Experiment #1: Flowcharting and StampPlot Lite
Enter and run Program 1.2. Monitor the value in debug window while adjusting the potentiometer and note
what occurs as the value rises above 120 and below 100.
'Program 1.2, Simple Heater
LED1
VAR
OUT4
RC
CON
7
Temp
VAR
WORD
'LED1 is on P4
'RC network is on Pin 7
'Pot is a variable to hold results
OUTPUT 4
LED1 = 1
'Setup LED as output
'Energize initially
Main:
GOSUB ReadTemp
GOSUB CheckTemp
PAUSE 250
GOTO Main
ReadTemp
HIGH RC
PAUSE 10
RCTIME RC, 1, Temp
Temp = Temp/30
'Read pot value as temperature
'check temp to setpoint
'Read Potentiometer
'Scale the results down,
'store as temperature
DEBUG "Temp = ",dec Temp, CR
RETURN
CheckTemp:
'If Temp > 100, or heat already on,
'check if should be off
IF (Temp > 100) OR (LED1 = 1) THEN CheckOff
LED1 = 1
'If not, then energize and display
DEBUG "The heater energized",CR
CheckOff:
'If Temp < 120 or heat is off already, all done
IF (Temp < 120) OR (LED1 = 0) THEN CheckDone
LED1 = 0
'if not, then energize and display
DEBUG "The heater de-energized", CR
CheckDone:
RETURN
Programming Challenge
Modify the process flowchart and program so the LED indicates an air conditioner cycling between 70 and 75
degrees.
Exercise #4: Using StampPlot Lite
Page 20 • Industrial Control Version 1.1
Experiment #1: Flowcharting and StampPlot Lite
While the debug window for the BASIC Stamp is very useful for obtaining data and information from the
BASIC Stamp, it can be difficult to visualize the data without careful scrutiny. Is the temperature increasing or
decreasing? How quickly is it changing? At what point did the output change? What temperature is it cycling
around?
Enter StampPlot Lite! StampPlot Lite (SPL) was specifically developed for this text. SPL accepts data from the
BS2 in the same fashion the debug window does, only SPL interprets the data and performs on of 4 actions
based on the structure of the data:
•
•
•
•
A value is plotted on an analog scale in real time.
A binary value starting with % is plotted as digital traces in real time.
Strings beginning with ! are interpreted as instructions to control and configure SPL.
Any other string is listed as a message at the bottom of SPL and optionally time-stamped.
A main rule of SPL is that each line must end in a carriage return (13 or CR).
Please review Appendix A for a more in-depth discussion of StampPlot Lite.
If you have not yet installed StampPlot Lite, install it on your computer by downloading it from
. Double-click the setup button and install it in your designated directory.
Let's take another look at Program 1.2, our simple heater, but this time using StampPlot Lite to help visualize
the process. Program 1.2 has been rewritten as Program 1.3 to utilize StampPlot Lite (bold lines are
added/modified from program 1.2).
'Program 1.3; Simple Heater using StampPlot Lite
'Configure StampPlot Lite
PAUSE 500
DEBUG "!SPAN 50,150",CR
'Set span for 50-150
DEBUG "!TMAX 60",CR
'Set for 60 seconds
DEBUG "!PNTS 500",CR
'500 data points per plot
DEBUG "!TITL Simple Heater Control",CR
'Title the form
DEBUG "!SHFT ON",CR
'Allow plot to shift at max
DEBUG "!TSMP ON",CR
DEBUG "!PLOT ON",CR
'Enable plotting
DEBUG "!RSET",CR
'Reset Plot
LED1
RC
Temp
VAR
CON
VAR
OUTPUT 4
LED1 = 1
OUT4
7
WORD
'LED1 is on P4
'RC network is on Pin 7
'Pot is a variable to hold results
'Setup LED as output
'Energize initially
Industrial Control Version 1.1 • Page 21
Experiment #1: Flowcharting and StampPlot Lite
Main:
GOSUB ReadTemp
GOSUB CheckTemp
PAUSE 250
GOTO Main
ReadTemp
HIGH RC
PAUSE 10
RCTIME RC, 1, Temp
Temp = Temp/30
DEBUG DEC Temp, CR
DEBUG IBIN LED1,CR
RETURN
CheckTemp:
'Read pot value as temperature
'check temp. to setpoint
'Read Potentiometer
'Scale the results down,
'store as temperature
'Send temperature value
'Send LED Status
'If Temp > 100, or heat already on,
'check if should be off
IF (Temp > 100) OR (LED1 = 1) THEN CheckOff
LED1 = 1
'If not, then energize and display
DEBUG "The heater energized",CR
DEBUG "!USRS The heater is energized!",CR 'Update SPL status bar
CheckOff:
'If Temp < 120 or heat is off, all done
IF (Temp < 120) OR (LED1 = 0) THEN CheckDone
LED1 = 0
'if not, then energize and display
DEBUG "The heater de-energized", CR
DEBUG "!USRS The heater is de-energized!",CR 'Update SPL Status Bar
CheckDone:
RETURN
Download this program to your BASIC Stamp, and follow these instructions to use StampPlot Lite.
•
•
•
•
•
•
Start StampPlot Lite by using your Windows Start
Programs/StampPlot/StampPlot Lite.
Enter and run Program 1.3 on your BASIC Stamp.
Close the BASIC Stamp editor’s blue debug window.
Select the correct COM port in StampPlot Lite and click 'Connect.'
button
and
going
to
Reset the BASIC Stamp by pushing the button on the Board of Education. Now you’re ready to use
this unique software utility.
Page 22 • Industrial Control Version 1.1
Experiment #1: Flowcharting and StampPlot Lite
At this point you should see data being plotted. Adjust the 10K-ohm potentiometer with your fingers or a
small screwdriver. The analog line displays the value of the potentiometer. The digital trace at the top displays
the status of the LED indicator. Figure 1.9 is a sample capture of the plot from our circuit.
Figure 1.9: StampPlot Lite Graph of Exercise #4
Note the correlation between the analog value and the switching of the digital output. Use the various
controls on StampPlot Lite to become familiar with the functions and features. Analyze Program 1.3 and note
the various configuration settings and data sent to the application. Refer to Appendix A for additional
information on StampPlot Lite if you are having problems understanding the basics of the software utility.
Programming Challenge
Modify your air conditioner challenge from Exercise #2 to use StampPlot Lite. Configure your program to
transmit data approximately every 0.5 seconds. Calculate the number of data points needed to fill the screen
within a maximum of 60 seconds, and test.
Just for fun!
Enter and run the following program. The potentiometer simulates a single-handle shower (mixer) valve with
adjustment delay. Adjust the shower temperature for a constant 110 degrees. See how fast you can stabilize
the temperature at the set point! Press the reset button on the Board of Education and try again. We'll leave
it up to you to figure out the program.
Industrial Control Version 1.1 • Page 23