Báo cáo lâm nghiệp:"High-grading effects on Scots pine volume and basal area in pure stands in northern Spain" pot
Bạn đang xem bản rút gọn của tài liệu. Xem và tải ngay bản đầy đủ của tài liệu tại đây (462.54 KB, 8 trang )
11
Ann. For. Sci. 60 (2003) 11–18
© INRA, EDP Sciences, 2003
DOI: 10.1051/forest: 2002069
Original article
High-grading effects on Scots pine volume and basal area
in pure stands in northern Spain
Felipe Bravo
a
* and Gregorio Montero
b
a
Dept. de Producción Vegetal y Silvopascicultura, University of Valladolid, Campus at Palencia,
Avda. de Madrid, 44, 34004 Palencia, Spain
b
CIFOR-INIA, PO Box 8011, 28080 Madrid, Spain
(Received 24 January 2002; accepted 25 March 2002)
Abstract – A yield model for formerly high-graded Scots pine stands in a transitional climatic area in northern Spain has been developed. High
grading practices were used broadly during the last decades. In the past years, the silvicultural system has switched to a conventional even-aged
system. A modeling approach is used to understand the effects of high-grading on basal area and dominant height. The equations are calibrated
to be used in non high-graded stands and in previously high-graded stands when the silvicultural practices are switched. Dominant height and
linear models were used to calibrate the original multiplicative model. With these models the effect of high-grading practices upon forest yield
was studied. Standing volume decreased due to high-grading over 26% as the rotation age increased in a medium productivity class. The total
volume reduction at rotation age was 18%.
Pinus sylvestris / high-grading / yield / Scots pine / Spain
Résumé – Effets du système de coupe à la dimension sur le volume et la surface terrière de peuplements de Pin sylvestre au nord de
l’Espagne. On a mis au point un modèle de croissance des peuplements de Pin sylvestre soumis auparavant à ce système dans une région
climatique de transition située au nord de l’Espagne. Ce type de sylviculture, consistant à récolter systématiquement les arbres de gros diamètre,
a été courant au cours des dernières décennies. Depuis quelques années on abandonne cette méthode pour adopter le traitement en futaie
régulière. On a fait appel à l’approche modélisation pour estimer les effets du système de coupe à la dimension sur la surface terrière et la hauteur
dominante. Les équations ont été étalonnées de manière à pouvoir être utilisées aussi bien pour les peuplements n’ayant pas été soumis à ce
système de coupe que pour ceux qui, l’ayant subi dans le passé, ont bénéficié d’un nouveau traitement. Le modèle multiplicatif d’origine a été
calibré selon des modèles linéaires en utilisant la hauteur dominante. On a pu estimer, grâce à ces modèles, l’effet des coupes à la dimension
sur la production. On enregistre alors une réduction du volume sur pied de 26 % dans le cas d’une résolution longue et pour une classe de
production moyenne. La réduction du volume total produit en fin de révolution s’élève à 18 %.
Pinus sylvestris / coupe à la dimension / rendement / Pin sylvestre / Espagne
1. INTRODUCTION
High-grading is a traditional harvesting practice that over-
exploits forests by removing only the dominant trees. In north-
ern Spain, high-grading is usually defined as cutting all
commercial trees equal to or larger than 40 cm in diameter,
and leaving all non-commercial trees. Although high-grading
produces high short-term returns, its negative effects on soil
rent, depletion of biological diversity and very poor stand
structure [10] have led to its discontinued use as a forest man-
agement practice. Dominant height, size-density relationships,
diameter distribution and other stand characteristics are
affected by high-grading. High-grading reduces stand domi-
nant height and quadratic mean diameter because the biggest
trees are harvested. High-grading promotes small gaps that are
occupied by young trees and results in a prevalence of codom-
inant and suppressed trees, so the resulting diameter distribu-
tion ranges from normal to reverse-J including bimodal
shapes. Upon release the understory often exhibits a lag in
height and diameter growth [12]. By using high-grading, a
high structural diversity can be achieved, but must be consid-
ered that a reduction of over a 10 percent in diameter growth
rate must be expected in Mediterranean pine stands [1]. Using
data sets from high-graded stands to fit growth and yield
models, the growth estimation underestimates the actual val-
ues of non-high-graded stands. A possible solution is to cali-
brate the model using independent non high-graded data sets.
On the other hand, there are taper differences between domi-
nant and codominant trees. In general, dominant trees have
more diameter growth and taper at a given height, resulting in
more volume than codominant trees of the same height [9].
* Correspondence and reprints
Tel.: +34 979 10 84 24; fax: +34 979 10 83 01; e-mail:
12 F. Bravo and G. Montero
In Scots pine stands, high-grading practices have been dis-
continued some years ago but the effects of high-grading on
forest stand structure are still important. Scots pine (Pinus
sylvestris L.) is one of the most wide spread species around the
world, dominating forest landscapes from boreal areas to
Mediterranean mountains in Europe. Local and regional
research is needed in order to define sustainable forest man-
agement in these forests. Silvicultural studies of Scots pine
stands in the transitional area in the Southern limit of its distri-
bution are scarce in the relevant literature. The objective of
this study is to explore the influence of high-grading practices
upon forest yield. To accomplish this objective, a yield model
was fitted and calibrated and the behavior of the model with
and without high-grading was studied. Results from this
empirical study can serve to better understand the effects of
high grading.
2. MATERIALS AND METHODS
2.1. Study area
The High Ebro basin (northern Spain) was selected as the study
area because high-grading has had a strong influence on forest stands
in this area. The High Ebro basin is a transitional area for Scots pine
in northern Spain situated between 700 and 900 m a.s.l. The climate
ranges from the Mediterranean to the Atlantic type, with an annual
rainfall of about 800 mm (approximately 15 percent in summer) and
an average temperature of 11.2 ºC. In general, the area does not suffer
from pronounced drought or severe frost but these stresses can occa-
sionally occur. Typical interannual variation of temperature and
rainfall of the Mediterranean climate is moderated by the Atlantic
influence. Soils are mostly calcarous cambisols involving luvisols in
humid sites. While in boreal Scots pine stands nutrient levels are the
key to determine site index, in this transitional area soil texture is the
driving factor in site productivity estimation [2]. Pinus sylvestris L.
occupies the overstory and the remaining vegetative community is
dominated by a mixture of Quercus faginea Lamk, Fagus sylvatica L.,
Quercus ilex L., Calluna vulgaris (L.) Hull, Erica sp, Ulex sp and
Pteridium aquilinum (L.) Kuch. Beech (Fagus sylvatica) is the most
common invading species on the most humid high-graded Scots pine
stands in the study area. Understory species limit Scots pine natural
regeneration [4] by competition for water, especially during dry
years. This indicates the importance of water stress in these stands.
2.2. Data
Data to develop the model came from the Second Spanish Forest
Inventory [5]. The plots of the Second Spanish Forest Inventory
(2SFI) are systematically distributed using a grid of one square kil-
ometer. Each plot consists of four concentric subplots with radius 5,
10, 15 and 25 m. For these subplots, the minimum diameter recorded
is 7.5, 12.5, 22.5 and 42.5 cm, respectively. In order to expand the
data to the hectare the following expansion factors have been used,
127.32, 31.83, 14.16 and 5.09 for each minimum diameter,
respectively.
At plot establishment, the following data were recorded for every
sample tree: species, diameter at 1.3 m (DBH) to the nearest millim-
eter, total height to the nearest quarter meter, and the distance and
azimuth from the plot center in meters and degrees, respectively. Diam-
eters were measured with a caliper in two perpendicular directions.
After defining the study area, 75 plots were chosen from the 2SFI
database which met the following criteria: (1) at least 70% of the
basal area in Scots pine, (2) dominant height above 6 m, and (3) basal
area above 15 squared meters per ha. During the past decades, high-
grading practice had been used extensively throughout the study aera
so the plots represent mostly high-graded stands. In stands that were
high-graded a few decades ago, it is difficult to find clues of high-
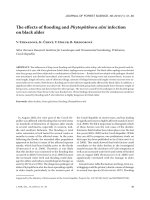
grading, but its effects are still important. In figure 1, we can observe
some diameter distribution from high-graded stands in our study area.
The plots cover a wide range of dominant height and basal area (dom-
inant height ranging from 6.3 to 23.7 m and basal area ranging from
15.3 to 60.2 m
2
per hectare). Site index was determined using the
method developed by Bravo and Montero [2]. Site index classes
(dominant height in meters at 100 years old) of 2SFI plots in the study
area were 14, 17, 20 and 23 m.
Data from permanent plots and thinning experiments under tradi-
tional even-aged silviculture were used to study the behavior and cal-
ibrate the fitted model. Three permanent plots (600, 1000 and
2500 m
2
) were used to study the behavior of the model. These perma-
nent plots were installed in 1964 to study growth and yield under
even-aged management practices, and they were remeasured every
five years until 1979. DBH was recorded for each tree and total height
was measured on the 10 trees with largest DBH’s and on a random
sample of 30 additional trees. In fifteen sample trees from these per-
manent plots, the age, total and merchantable height, and the diameter
outside bark at 50 cm intervals up the stem were recorded. Addition-
ally, data from two thinning experiments were used to calibrate the
model. The thinning experiments were installed in the Iberica Range
in 1968 and remeasured every five years until 1998. In both cases, the
experimental design was a complete randomized block design. Using
classical Assmann’s classification, in one of the thinning experiments
four treatments were tested: (1) no treatment (grade A), (2) weak thin-
ning (grade C), (3) moderate thinning from below (grade D), and (4)
heavy thinning from below (grade E). Only three treatments (A, C
and D) were tested in the other thinning experiment. The experiment
started when the stand was 41 years old in the first experiment site
and when the stand was 50 years old on the second one. Site index
ranged from 20 to 23 in the first forest experiment and between 17
and 20 in the second according to Rojo and Montero [18] and Bravo
and Montero [2] site index curves. A complete description of these
thinning experiments can be found in Río [16] and in Río et al. [17].
Eighty-two observations have been used from the thinning experi-
ments. These two data sets (permanent plots and thinning experi-
ment) were not used to fit the model but to explore its behavior and
calibrate it, respectively.
2.3. Methods
2.3.1. Model structure
The data available for modeling determine both the type of model
that can be developed and the precision of the predictions from the
model. The 2SFI data have the following characteristics: (1) pres-
ently, we have just one measurement, (2) the plot design used four
nested subplots based upon DBH and, therefore, the density and the
diameter distribution per hectare must be computed from the expan-
sion factors for each subplot, and (3) increment cores were not
extracted from each tree. As a result of these limitations, a whole
stand yield model approach was chosen.
Multiplicative models are based on Mitscherlich’s law or the law
of limiting factors. These types of models have been used previously
to elaborate whole stand models for Picea abies [3] and Pinus sylves-
tris [14], to estimate diameter distribution parameter dynamics under
different planting densities [9] and to fit crown relations in conifer
species [10]. The general form of the multiplicative model is:
(1)Y b
0
X
1
b1
X
2
b2
´ X
n
bn
´´=
High-grading effects on Scots pine stands 13
where Y is the dependent variable, X
i
is the ith independent variable
and b
0
, b
1
, b
n
are parameters to be estimated.
The dependent variables used in this study were mean quadratic
diameter (dg), basal area (G) and total volume (V) of Scots pine. The
independent variables were chosen after a correlation study that
rejected the variables that were not significant at P = 0.001. The final
independent variables used were number of Scots pine stems per ha
(N), dominant height (H
0
) and the stand density index (SDI). Age was
rejected because it is difficult to determine stand age in a mixed struc-
tured high graded forest. In addition, site index (SI) was not used
because of its lack of statistical significance in this study. SDI was
calculated using the exponent found by Río et al. [17] for Scots pine
stands in Spain (–1.75) instead of the classic Reineke exponent
(–1.605). The general forms of the equations in the model are:
(2)
(3)
(4)
where a
i
, b
i
and c
i
are parameters.
2.3.2. Parameter estimation
The coefficients for each equation in the model were estimated
using non-linear regression and Marquardt’s procedure. As suggested
by Ratkowsky [15], parameters from linearization of equations (2),
(3) and (4) through the log-log transformation were used as seed
values to fit the non-linear parameters.
2.3.3. Model efficiency
The efficiency of the model was studied using the following effi-
ciency factor proposed by Soares et al. [19] and Vanclay et al. [23]:
(5)
An EF value equal to 1 indicates a perfect fit; an EF value equal to
zero indicates a fit that is not better than a simple average; and an EF
value under zero indicates a fit that is worse than the average.
The signs of the parameters were examined to detect if they were
in accordance with present knowledge of forest yield. To examine the
predicted values from the model, the relative residual between
observed and estimated values was calculated using the formula:
.(6)
Because of the mathematical relationship between G and dg, the
compatibility between equations (2) and (3) was studied by comput-
ing an error term in percentage (et). For example, et for basal area is
calculated using:
(7)
where y
i
is the observed value for basal area and y
c
is computed,
using predicted mean quadratic diameter (dg) and the number of
stems per hectare (N), as:
(8)
In addition predictions from the model were compared with data
from permanent plots to further study the model’s behavior.
2.3.4. Model calibration
An important problem in the application of a growth and yield
model is its calibration to different forestry practices or to other geo-
graphical zones [6]. Different methods have been proposed to cali-
brate a forest growth and yield model [8, 13]. Calibrating a stand to
normal yield tables based on the ratio between actual basal area and
basal area from the table is routinely used in practice. This method
assumes that the model is correct in shape and the calibration is just
a scalar modification. This hypothesis may not be true, especially
when there are strong differences between the silvicultural treatments
in the original stands used to elaborate the model and in the stands
where the model is going to be used.
We assume that the actual value of the dependent variable can be
expressed by equation (9). In addition, we assume that the calibration
factor (CF) is distributed normally. The resulting calibration model
used is:
(9)
where, y is the observed value of the dependent variable, f(x
1
, ,x
n
)
is the predicted value by the equation, e is the error of the equation
with a mean of zero, and CF is the calibration factor.
The calibration factor can be a linear or a non-linear function of
different variables. These variables can be independent variables in
the equation or not. We used a simple linear function for characteriz-
ing the calibration factor. The independent variables included in the
yield model were checked as variables for the calibration equations.
Before developing the calibration equations the behavior of the yield
model was first checked using the thinning data set. If the behavior
was judged to be good (using the efficiency factor as an index of
behavior), the calibration equations would not be developed.
3. RESULTS
3.1. Parameters estimation and goodness-of-fit
The parameters for each model are given in table I. All the
parameters were significant at a 0.05 significance level. In
each model, the parameters have the expected sign except for
the parameter b
1
on number of trees per ha in equation (3).
However, as in the SDI calculation where we used the total
number of trees per ha (regardless of species), the “true” value
for the exponent of number of trees per ha in this equation
should be positive. No multi-collinearity problems between
explanatory variables were detected.
The EF for the validation data set was 0.9546 for the basal
area model (Eq. (3)), 0.8301 for the quadratic diameter model
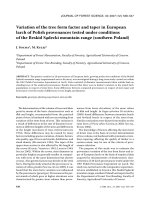
(Eq. (2)) and 0.4964 for the volume model (Eq. (4)). These
values show that the model form and the independent varia-
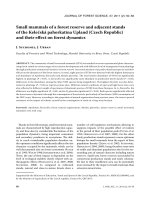
bles chosen were adequate. Using the validation data set, the
volume model (Eq. (4)) underestimated the actual volume
when density and dominant height had a high value and over-
estimated volume otherwise (figure 1).
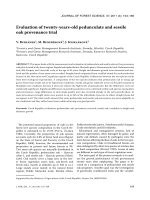
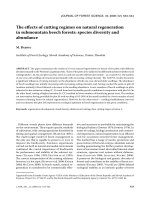
The relative residuals were usually under 15%, with the
highest value (38.06%) coming from the basal area equation
(figure 2). The largest relative residuals were found in stands
with poor site quality (SI = 14).
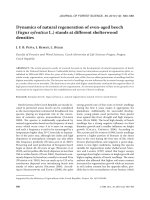
The check of compatibility between dg and G estimators
showed that the highest percent errors occured when the mean
dg a
0
N
a
1
´ H
0
a
2
´=
G b
0
N
b
1
´ SDI
b
2
´=
V c
0
SDI
c
1
´ H
0
c
2
´=
EF 1
y
i
y
ˆ
i
–()
2
å
y
i
y–()
2
å
–=
.
e
y
ˆ
y
i
–
y
i
100´=
et
y
c
y
i
–
y
i
-
100´=
y
c
p dg
2
´ N´
4
.
=
yfx
1
, ,x
n
()eCF++=
14 F. Bravo and G. Montero
quadratic diameter was estimated by the model (Eq. (2)) and
basal area was calculated using equation (8) (figure 3a). So,
the basal area model is preferred over the quadratic diameter
model (figure 3b). Comparing predictions from the basal area
and volume equations with the actual data from the growth and
yield plots, we found that the basal area equation was a better
representation of the stand’s dynamics than the volume equa-
tion. The volume equation overestimated the actual volume
when the dominant height is high and underestimates it other-
wise (figure 4). This finding is consistent with the compari-
sons to the validation data set (figure 1) and with the computed
EF values.
3.2. Model calibration
Because the basal area equation had a high EF value, calcu-
lated over the permanent plots data set, and good behavior,
only the volume equation was calibrated. Screening the inde-
pendent variables of the volume model (figure 4) found no
relationship between SDI and the calibration factor (Eq. (9)).
However, there was a linear relationship between dominant
height and the calibration factor. The yield model underesti-
mated the actual volume when the dominant height was
smaller than 13.71 m and overestimated it otherwise. This
result agrees with the general high-grading trend, i.e. cut the
biggest trees in the tallest stands and avoid cutting in the
youngest and in the poorest stands. The following simple lin-
ear model (Eq. (10)) was fitted to the calibrating data and the
results are shown in table II:
(10)
The adjusted determination coefficient was 0.9169, the
residuals were normally distributed (P < W: 0.5332) with a
mean slightly above zero (0.5077). Using this linear equation,
the predicted calibration factor is zero when the dominant
height is 13.71 m.
The final volume equation (11) has an EF, calculated over
the permanent plots data set, equal to 0.9856, indicating that
its predictions in even-aged stands are more accurate than
using the uncalibrated equation.
. (11)
Comparing yield models with and without calibration fac-
tors, we can study the high-grading impact upon forest yield.
Equation (4) has been used to simulate high-graded stands,
while equation (11) was used to represent standard even-aged
silviculture. A medium productivity site (site index 20 m at
100 years) has been simulated, the flag points were 15, 18 and
21 m in dominant height (55, 75 and 129 years old). At each
of these periods the stand was partially cut, thinned or high-
graded, to reduce the SDI from 1000 to 700, assuming that, on
average, one meter increment in dominant height represents an
increment of 100 points in SDI [16]. The standing volume
reduction due to high-grading at 129 years is over 26% while
the total volume reduction is 18%. At 75 years of age the
reduction is over 18% of standing volume and almost 15% of
total volume (table III).
4. DISCUSSION
In this study, data from a single measurement of permanent
plots were analyzed to develop a yield model for high-graded
stands. Therefore, continuing studies are needed using
repeated measurements from these plots to fully understand
the influence of high-grading on forest stand dynamics. Some
modifications of the model would be necessary to study the
impact of hardwoods on Scots pine yield. Nonetheless, the
yield model developed in this study allows, in combination
with the appropriate site index curves, to adequately forecast
the yield of previously high-graded Scots pine stands in
northern Spain.
Table I. Parameters estimated for mean quadratic diameter (dg),
basal area (G) and volume (V) models for high-graded Scots pine
stands in northern Spain.
Model Parameter Estimated Standard
deviation
Mean squared
error
Dg a
0
43.791 10.898 6.655
a
1
–0.270 0.026
a
2
0.426 0.056
G b
0
0.033 0.006 4.467
b
1
–0.107 0.023
b
2
1.116 0.037
V c
0
0.168 0.052 432.674
c
1
0.913 0.053
c
2
0.413 0.065
Figure 1. Residuals of the volume model by variable X
1
using the
validation data set. (X
1
=SDI
0.913
´ H
0
0.413
).
CF d
0
d
1
H
0
´+=
V 0.168 SDI
0.913
´ H
0
0.413
215.069 15.685 H
0
´+–´=
High-grading effects on Scots pine stands 15
Dominant height shows a key influence upon high-graded
stands evolution. The residual overstory density has a strong
influence upon residual tree height growth [11]. From the data
of Spanish National Inventory studied we can not know the
residual overstory density and, in addition, our permanent
plots data set unfortunately do not provide any information
about residual overstory density. However, height is the cali-
brated variable in our model showing its importance on tree’s
response to high grading practices. Both age and site index can
be expressed by dominant height to some extent. The ability to
predict growth variation in even-aged stands is low when both
age and site quality are eliminated, however even-aged stand
structure is uncommon in high-graded stands.
The calibration factor function improved the volume model
estimations in even-aged stands. The linear relationships
between the calibration factor and dominant height shows the
impact of a high-grading practice that removes the overstory.
The gaps created by high-grading are occupied by some young
trees, so the basal area model does not need calibration. The
reduction in volume we found agree with other studies in Med-
iterranean pines in stands showing a high structural diversity [1].
As high grading promotes structural diversity both in diameter
(figure 5) and height, a yield reduction must be expected.
Other modeling strategies such as individual tree model
(ITM), would be better models for our purpose than whole
yield stand model. The Forest Vegetation Simulator [22]
developed by the US Forest Service or the Oregon Growth and
Yield Model (ORGANON) supported by the forestry program
at Oregon State University [7] in North America and PROG-
NAUS (the Austrian variant of PROGNOSIS) which was
implemented by Sterba and collaborators [20, 21] in Europe
are good example of ITMs that are useful for evaluating silvi-
cultural treatments such as high-grading. However, no data are
available in our targeted stands to develop this kind of model
Figure 2. Error rates of mean quadratic diameter, basal area and volume models by dominant height (a) and SDI (b) in high-graded Scots pine
stands in northern Spain.
Table II. Analysis of variance for the simple linear model of calibration factor for high-graded Scots pine stands in northern Spain.
Source Degree of freedom Squared sum Mean squared Prob > F
Model 1 61026.351 61026.351 0.0001
Error 80 5457.157 68.214
Total 81 66483.489
Parameter Estimated Standard deviation t for Ho: b = 0 Prob >½t½
d
0
–215.069 7.254 –29.647 0.0001
d
1
15.685 0.524 29.910 0.0001
Table III. Total and standing volume in a medium productivity (site index 20 m at 100 years), high-graded and non high-graded Scots pine
stands in northern Spain.
Standing volume (cubic meters) Total volume (cubic meters)
H
0
(m)
Age
(year)
High-graded Non
high-graded
Reduction
(percent)
High-graded Non
high-graded
Reduction
(percent)
15 55 281.86 302.07 6.69 281.86 302.07 6.69
18 75 303.90 371.17 18.12 382.24 449.51 14.96
21 129 323.88 438.20 26.09 492.81 601.00 18.00
16 F. Bravo and G. Montero
so our modeling approach is the only one possible in such a
situation (one yield measurement and no increment records).
On the other hand, this situation (lack of a strong data set to
develop ITMs) is very common around the world and foresters
need some kind of orientation to develop their silvicultural
strategies in practice. A whole yield model plus an adequate
calibration function can serve as a guide for practicing foresters
while new models are developed.
Although, as far as we know, there is no literature dealing
with economic implications of high-grading, it is clear that the
possible financial gain in the first years of a rotation by apply-
ing high-grading is surpassed by the problems created in the
long run, such as structurally non-equilibrated stands or tech-
nologically low-quality standing trees. However, when forest
management is oriented to develop structurally complex
stands (i.e., in Green Tree Retention practices), costs in terms
of timber production and management complexity must be
balanced with the gain in other features such as biological
diversity or aesthetic considerations. In the climatic transi-
tional area in northern Spain, old high-grading practices allow
beech to invade originally pure Scots pine stands improving its
aesthetic value. A new growth and yield modeling strategy
using individual distance-independent models would be bene-
ficial for modeling these types of stands. The implications of
high grading on reduction of timber production have been
stated. This result should be used as foundation to avoid high
grading in forestry elsewhere and especially in areas where
timber production is a well-stated goal. If the goal is promote
structural diversity, other silvicultural strategies must be
explored.
Figure 3. Error rates estimated dg by the model and calculating G (a) and estimating G and calculating dg (b) by dominant height in high-
graded Scots pine stands in northern Spain.
Figure 4. Plot of the calibration factor by SDI and H
0
for the volume model for high-grading Scots pine stands in northern Spain. CF is the
calibration factor.
High-grading effects on Scots pine stands 17
Acknowledgements: The authors wish to thank A. Picardo for his
encouragement, S. González, N. Nanos, D. Hann and two anonymous
referees for their comments that improved the manuscript, R. Jackson
who checked the English version and A. Bravo who helped in the
field work.
REFERENCES
[1] Bravo F., Guerra B., Forest structure and diameter growth in
Maritime pine in a Mediterranean area, in: von Gadow K., Nagel J.,
Saborowski J. (Eds.), Continuous Cover Forestry IUFRO meeting,
2001, pp. 101–110.
Figure 5. Diameter distributions of some examples of Scots pine high graded stands in High Ebro Basin (northern Spain). Shadow: Scots pine
stems per hectare, white: other species (mostly beech) stems per hectare.
18 F. Bravo and G. Montero
[2] Bravo F., Montero G., Site index estimation in Scots pine (Pinus
sylvestris L.) stands in the High Ebro Basin (northern Spain) using
soil attributes, Forestry 74 (2001) 395–406.
[3] Eriksson H., Yield of Norway Spruce in Sweden. Dept. of Forest
Yield Rap. No 41, 1976.
[4] González-Martínez S.C., Bravo F., Density and population
structure of the natural regeneration of Scots pine (Pinus sylvestris
L.) in the High Ebro Basin (Northern Spain), Ann. For. Sci. 58
(2001) 277–288.
[5] ICONA, Segundo Inventario Forestal Nacional. Explicaciones y
métodos. Madrid, 1990.
[6] Krumland B.E., A tree-based forest yield projection system for the
North Coast region of California. Ph.D. Thesis, unpublished,
U. California, Berkeley, 1982.
[7] Hann D.W., Hester A.S., Olsen C.L., ORGANON user's manual:
Edition 6.0. Department of Forest Resources, Oregon State
University, Corvallis, OR, 1997, 133 p.
[8] Lappi J., Calibration of height and volume equations with random
parameters, For. Sci. 37 (1991) 781–801.
[9] Larson B., Development and growth of even-aged stands of
Douglas-fir and grand fir, Can. J. For. Res. 13 (1986) 367–372.
[10] Lu H C., Buongiorno J., Long- and short-term effects of
alternative cutting regimes on economic returns and ecological
diversity in mixed-species forests, For. Ecol. Manage. 58 (1993)
173–192.
[11] Murphy T.E., Adams D.L., Ferguson O.E., Reponse of advance
lodgepole pine regeneration to overstory removal in eastern Idaho,
For. Ecol. Manage. 120 (1999) 235–244.
[12] Oliver C.D., Larson B.C., Forest Stand Dynamics, John Wiley and
Sons, New York, 1996.
[13] Payandeh B., Papadopol P., Partial calibration of ‘ONTWIGS’: A
forest growth and yield projection system adapted for Ontario,
North. J. Appl. Forest. 11 (1994) 41–46.
[14] Persson O.A., A growth simulator for Scots pine (Pinus sylvestris
L.) in Sweden. Dept. of Forest Yield-SLU Rap. No 31, 1992.
[15] Ratkowsky D.A., Nonlinear regression modeling. A unified
approach, Marcel Dekker, Inc., New York, 1983.
[16] Río M. del, Régimen de claras y modelo de producción para Pinus
sylvestris L. en los sistemas Central e Ibérico. Ph.D. Thesis,
ETSIM-UPM, 1998.
[17] Río M. del, Montero G., Bravo F., Analysis of diameter-density
relationships and self-thinning in non-thinned even-aged Scots pine
stands, For. Ecol. Manage. 142 (2001) 79–87.
[18] Rojo A., Montero G., El pino silvestre en la Sierra de Guadarrama
MAPA, Madrid, 1996.
[19] Soares P., Tome M., Skovsgaard J.P., Vanclay J.K., Evaluating a
growth model for forest management using continuous forest
inventory data, For. Ecol. Manage. 71 (1995) 215–265.
[20] Sterba H., Monserud R.A., Validation of the single tree stand
growth simulator PROGNAUS with permanent plot data,
Proceedings of the Meeting of IUFRO S4.11-00 at IUFRO XX
World Congress, 6–12 August 1995, Tampere, Finland, 1996,
pp. 36–49.
[21] Sterba H., Monserud R.A., Applicability of the forest stand growth
simulator PROGNAUS for the Austrian part of the Bohemian
Massif, Ecol. Model. 98 (1997) 23–34.
[22] USDA, FVS, the forest vegetation simulator, 2000.
[23] Vanclay J.K., Skovsgaard J.P., Garcia O., Evaluating forest growth
models, Proc. of Meeting of IUFRO S4.11.00, IUFRO XX World
Congress, Tampere, Finland, 1996, pp. 11–22.
To access this journal online:
www.edpsciences.org