Báo cáo lâm nghiệp:" Structure, spatial distribution and competition in mixed jack pine (Pinus banksiana) stands on clay soils of eastern Canada" pps
Bạn đang xem bản rút gọn của tài liệu. Xem và tải ngay bản đầy đủ của tài liệu tại đây (335.49 KB, 9 trang )
609
Ann. For. Sci. 60 (2003) 609–617
© INRA, EDP Sciences, 2004
DOI: 10.1051/forest:2003053
Original article
Structure, spatial distribution and competition in mixed jack pine
(Pinus banksiana) stands on clay soils of eastern Canada
Martin BÉLAND
a,b
*, Jean-Martin LUSSIER
c
, Yves BERGERON
a
, Marie-Hélène LONGPRÉ
a
, Michel BÉLAND
d
a
Groupe de recherche en écologie forestière inter-universitaire et Chaire industrielle CRSNG-UQAT-UQAM en aménagement forestier durable,
Université du Québec en Abitibi-Témiscamingue, Rouyn-Noranda (Québec), Canada
b
Present address: Université de Moncton, Edmundston Campus, Faculty of Forestry, Edmundston, NB, Canada
c
Canadian Forestry Service, Laurentian Forestry Centre, Québec, Canada
d
Réseau québécois de calcul de haute performance, Montréal, Québec, Canada
(Received 24 June 2002; accepted 31 March 2003)
Abstract – The dynamics of pure jack pine (Pinus banksiana) stands and of those also comprising a component of white birch (Betula
papyrifera) and trembling aspen (Populus tremuloides) was assessed in natural post-fire stands on clay soils of eastern Canada boreal mixed
woods in order to shed some light on mechanisms controlling composition. Age structures indicated that the presence of birch or aspen merely
shortened the establishment of jack pine. Basal area structures of jack pine showed lower skewness coefficients in mixtures with birch than in
pure jack pine stands or when mixed with aspen indicating that birch is probably a weaker competitor. Its effect on mean pine diameter probably
reflects the lower pine stem density when mixed with birch. Inter-specific competition however had no effect on pine diameter at the tree level.
Competition between birch, aspen and pine is avoided by species spatial exclusion measured by Ripley’s statistic and reflects the reproductive
strategies of the species and history of the site.
Ripley’s K / asymmetric competition / interspecific competition / composition / stand structure
Résumé – Structure, distribution spatiale et compétition dans les peuplements mélangés et purs de pin gris (Pinus banksiana) sur argile
dans l’est canadien. Nous avons étudié la dynamique des peuplements de pin gris purs (Pinus banksiana) et mélangés au bouleau à papier
(Betula papyrifera) et au peuplier faux-tremble (Populus tremuloides), établis naturellement après un incendie sur sol argileux en forêt boréale
mixte de l’est canadien dans le but de mieux comprendre ce qui contrôle leur composition. Les structures d’âge indiquent peu de différence
dans le délai d’établissement du pin gris selon la composition. Les surfaces terrières des pins gris montrent de plus faibles coefficients
d’asymétrie en mélange avec le bouleau qu’avec le peuplier, ce qui laisse à penser que le bouleau est un plus faible compétiteur. L’effet du
bouleau sur le diamètre moyen du pin reflète la plus faible densité du pin en peuplements mélangés à du bouleau. La compétition interspécifique
n’a cependant pas affecté le diamètre du pin à l’échelle de l’arbre. La compétition interspécifique est évitée par l’exclusion spatiale des espèces
mise en évidence par la statistique de Ripley, ce qui reflète leur stratégies reproductives et l’historique du site.
statistique K de Ripley / compétition asymétrique / compétition interspécifique / composition / structure des peuplements
1. INTRODUCTION
The dynamics of jack pine stands on sandy or coarse-tex-
tured soils have been described in detail [10, 12, 16, 24, 25, 35,
45]. Jack pine (Pinus banksiana Lamb.), white birch (Betula
papyrifera Marsh.) and trembling aspen (Populus tremuloides
Michx.) stands occur extensively and in various mixtures in
the post-fire landscapes of the clay belt of Ontario and Quebec
[28]. However, information about these stands is more limited
[1, 3].
Longpré et al. [28] have compared the growth of jack pine
in pure jack pine stands and stands mixed with aspen or birch.
They found no difference in the effect of intraspecific compe-
tition from jack pine and interspecific competition from aspen.
Their results also led them to believe that birch was not as
good a competitor as jack pine because of its slower height
growth rate [6].
The aim of this paper, is to investigate in more detail the
dynamics of post-fire pure and mixed jack pine stands on clay
soils in order to clarify the mechanisms controlling their com-
position. Specifically, we use a set of complementary tools to
(i) compare the age structures in order to see if the establish-
ment period of jack pine after fire differs in various species
mixtures; (ii) compare the size structures of each species to
*
Corresponding author:
610 M. Béland et al.
explore the types of competition (symetric competition for soil
resources or assymetric competition for light) occurring
between trees of the same species and of different species [30,
43]; (iii) relate jack pine diameter to intra- and inter-specific
competition at the tree level and (iv) compare the spatial dis-
tribution of trees of each species in order to evaluate the pro-
portion of the stand experiencing interspecific or intraspecific
competition.
We hypothesize that jack pine establishment period in jack
pine mixed with aspen or birch is not different from that of
pure stands. Because of the high productivity of clay soils in
the study area [3], we suppose that competition for light is the
major limiting growth factor in jack pine stands. Additionally,
because of the difference in relative growth rates of the three
species [6, 32], we suppose there is a gradient of increasing
intensity of competition exerted upon jack pine trees by birch,
jack pine to aspen. This gradient should be noticeable by
increased skewness of size distribution of jack pine. Accord-
ingly, accompanying species are expected to have higher
skewness of size distribution when they are supressed and
lower skewness of size distribution when they are dominant
over jack pine. The gradient just described should also be
noticeable by an effect of species-specific competition index
on the DBH of jack pine.
The spatial distribution of trees in mixed and pure jack pine
stands are expected to reflect the species dominant reproduc-
tive strategies. White birch stem patterns is expected to be
clumpy due to its stump sprout origin and that of aspen is
expected to be more random since it can root sprout as individ-
ual stems at a long distance from the other trees of its parent
clone [27]. Consequently, aspen stems will be competing with
a greater number of jack pine than birch stems. Some authors
have hypothesized that competition between tree species have
a large impact on spatial patterns of trees (association or repul-
sion) [37]. But spatial patterns of mixed species stands could
also be related to site history. The study of spatial patterns of
trees can be useful in explaining the intensity of competition
measured with competition indices.
2. METHODS
2.1. Study area
The study area is located in the southern portion of Hébécourt
township, Québec (48° 30’ N, 79° 30’ W), where the forest originated
from a large fire in 1923 [11]. The stands are even aged. The area is
located at the southern tip of the Clay Belt of northwestern Quebec
and is included in the ecological region of the Amos Lowlands, which
is characterized by glaciolacustrine clay deposits originating from the
presence of the proglacial Lakes Barlow and Ojibway [42]. It is also
at the southern limit of the Boreal Forest [36], within the balsam fir
(Abies balsamea (L.) Mill.) – paper birch domain [39]. The regional
climate is cold and continental with a mean annual temperature of
0.4 °C and annual precipitation of 800–900 mm, falling mostly dur-
ing the growing season [15]. Although the average frost-free period
is 147 days per year, the risk of frost persists throughout the year [44].
The sites where jack pine is found vary between two extremes:
thin organic soil on rock and moderately to well-drained lacustrine
clay deposits with a high base content [5].
2.2. Data
To minimize the effect of abiotic factors, the study sites were all
selected on a similar site type: moderately well-drained glacio-lacus-
trine clay. The ecological mapping of the area [4] was used for site
selection. Three stand types were selected: (i) pure jack pine stands,
(ii) mixture of jack pine and trembling aspen, and (iii) mixture of jack
pine and paper birch. Five 400-m
2
square plots were selected per
stand type, and the 15 plots were well distributed over the 5-km
2
study area. In the mixed stands, the proportion of stems (greater than
10 cm DBH) of each species was approximately 50%.
In each plot, a soil profile was described to verify that they all
were on moderately drained clays. All trees (an average of 44 trees
per plot, range 26–52) were mapped and had their DBH measured.
Between 16 and 19 jack pine trees per plot were cored with an incre-
ment borer for age determination.
2.3. Analysis
2.3.1. Age structure
The quartiles of age (1st quartile, median and 3rd quartile) of the
jack pine population of each stand were used in order to compare the
age structure of the three stand types. We chose this parameter
because we were not so much interested in the form of the age struc-
ture as in the possible delay in stand establishment, i.e. time for estab-
lishment of 25%, 50% and 75% of the stems. Moreover, we think that
mean age would have been misleading because distributions were
skewed towards younger ages. A one-way analysis of variance
(ANOVA) was performed to compare mean values between stand
types. Levene’s test of homogeneity of variance confirmed validity of
the ANOVA.
2.3.2. Size structure
The theories of Weiner [43] about competition have the potential
to be applied to mixed stands. These theories explore the frequency
distribution in size of individuals in a population rather than the
mean. An initially normal distributed population will first become
positively skewed as a result of variance in initial exponential growth
even without competitive interaction between individuals [30]. When
competition is introduced, size structures become positively skewed
as a result of differences in relative growth rate of small and large
trees [31]. When competition is assymetric, as in competition for
light, large individuals suppress growth of smaller ones more than
would be expected from their relative sizes [14, 33, 46]. A population
with a more asymmetric size structure is assumed to experience more
asymmetric competition for light whereas a population with a more
symmetric size structure would compete for other resources. Prob-
lems usually encountered in the application of this approach to tree
populations are various: trees grow slowly and experience mortality,
sites are seldom comparable, age is not the same and real size data are
not always reliable. In addition, such applications usually deal with
intraspecific competition [8, 18, 25, 26, 30, 31].
The data gathered by Longpré et al. [28] is well suited for this
type of application. Among the size variables available, we chose
tree basal area because it was available for every species and because
it was assumed to be more closely related to tree volume than
DBH. Inequality in the basal area distribution was evaluated by
the skewness coefficient. One-way analysis of variance (ANOVA)
was performed to compare skewness between stand types. Multiple
comparisons were performed using the Tukey procedure at the
0.05 significance level.
Structure of mixed jack pine stands on clay 611
2.3.3. Competition index
For all jack pine trees in each of the 15 stands, except those whose
competitors were located outside the plot, a competition index was
computed that differentiates the contribution of each competing spe-
cies. The chosen index is modified from Hegyi’s competition index
[21]:
where is DBH of jth competitor, is DBH of subject
tree i, is the linear distance between ith subject tree and the jth
competitor. Competitor trees included in the calculation of the index
were limited to those closer than a certain radius from the target tree
[21]. We tested radii from 3 to 9 m. We chose this index because it
was simple to use and, according to Holmes and Reed [22], performs
as well as more complex indices. This index was modified to differ-
entiate the relative influence of competitor species:
.
Multiple linear regressions were performed with jack pine DBH as
dependent variable and the various components of competition as
measured by the competition indices and the total index as independ-
ent variables. Selection of the variables was performed with the step-
wise procedure. The procedure was repeated for each radius. A nor-
mality test performed on regression residuals confirmed the validity
of the regressions.
2.3.4. Spatial distribution
Analysis of the spatial distribution of trees in each stand was per-
formed using Ripley’s K(d) function [34]. This method tests random-
ness of the distribution at multiple scales, based on the Poisson distri-
bution, by examining the proportion of total possible pairs of points
whose pair members are within a specified distance (d) of each other.
We applied a square root transformation
L(d) =
that linearize K(d), stabilizes its variance and has an expected value
of zero under the Poisson assumption [7]. The test of departure from
a random distribution is evaluated by determining a 95% Monte Carlo
envelope. The approximate interpretation of the results leads to con-
sider that, for a clustering pattern, L(d) is greater than this envelope,
for a random pattern, it is within the envelope, and for a regular pat-
tern, L(d) is below the envelope [13]. The univariate L(d) statistic
was computed for each species separately. The bivariate L
12
(d) sta-
tistic was computed to assess the spatial relationship between com-
peting species [29]. For this L
12
(d) statistic, 2 null hypothesis are
commonly used: random labelling and population independence.
Since 2 different species are concerned, the latter was tested by com-
paring L
12
(d) against a 95% Monte Carlo envelope defining inde-
pendence of the two species [19]. L
12
(d) values above the enveloppe
indicate spatial attraction and values below indicate spatial repulsion
between the two species [29]. Univariate L(d), bivariate L
12
(d) and
Monte Carlo envelopes were computed using Potemkin software
developed by John Brzustowski from University of Alberta. Potem-
kin uses Ripley’s [34] method of edge correction in which the sum
calculated for each tree is weighed by the fraction of the circumfer-
ence of a circle defining the neighbourhood assessed that lies within
the sampled region.
3. RESULTS
3.1. Age structures
Overall, the age of sampled jack pine trees varied between
69 and 45 years with peaks between 65 and 60 years. These
ages correspond to a period of establishment extending from
the 1923 fire up to 22 years after fire but 75% of trees were
established within 10 years after fire. The first quartile of
establishment time since fire is significantly higher in pure
stands than in stands mixed with either aspen or birch; the first
25% of pine trees in pure stands establishes approximately
1.5 years later than in mixed stands (Tab. I). Median and 3rd
quartile are not significantly different between stand types
indicating that later establishment is not delayed by compan-
ion species.
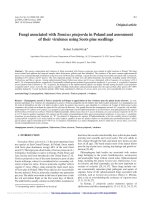
3.2. Size structures
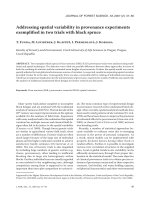
Skewness of basal area distribution was positive no matter
the stand type and was much higher for jack pine in pure
stands and in mixture with aspen than in mixture with birch.
Moreover, skewness for aspen was very small compared with
that for birch (Fig. 1). There is a trend toward higher values of
skewness for jack pine in mixture with aspen than in pure
stands, but the difference is very small and not significant
(Tab. II). However, aspen shows very low values of skewness
compared to its pine competitor.
Hegyi
i
DBH
j
DBH
i
⁄
R
ij
2
-
j 1=
n
∑
=
DBH
j
DBH
i
R
ij
Hegyi
i
Hegyi
iPinus,
[]Hegyi
i other species,
[]+=
Kd()
π
d–
Table I . Effect of stand type on 1st quartile, median and 3rd quartile of time after the stand initiating fire of jack pine trees.
Variable Source Sum of squares df Mean square F P
1st quartile Stand type 6.749 2 3.374 7.540 0.008
Error 5.370 12 0.448
Median Stand type 1.665 2 0.832 0.748 0.494
Error 13.362 12 1.114
3rd quartile Stand type 4.003 2 2.002 1.833 0.202
Error 13.105 12 1.092
Tukey comparison of means
Stand type Pure jack pine Jack pine + white birch Jack pine + trembling aspen
1st quartile 4.98a 3.50b 3.60b
Means with the same letter are not significantly different between stand types.
612 M. Béland et al.
3.3. Effect of competition on dbh
Multiple linear regressions measuring the effect of various
sources of competition on DBH of jack pine trees indicated
that the index combining all species was the only component
retained by the stepwise procedure except for stands mixed
with birch where the contribution of black spruce (a minor
component of some of the stands) was also significant. The
radius chosen for the calculation of the competition indices
was 6 m (lower radii had smaller R
2
and higher had to few
subject trees). Competition from aspen or birch had little effect
on the DBH of jack pine on the three stand types. Adjusted R
2
for the regressions varied between 0.58 and 0.768 (Tab. III).
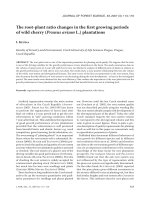
3.4. Spatial distributions
L statistic for the spatial distribution of trees in one of the
5 pure jack pine stands is presented in Figure 2a superimposed
on the complete spatial randomness 95% Monte Carlo enve-
lope. For concision, we combined the five stands on the same
graph but showed only the L statistic for the range of values
that are over their envelope (significantly clumped) and below
their envelope (significantly regular) for the five stands
(Fig. 2b). This graph indicates that stems are usually randomly
distributed at all scales except for a tendency to have a uniform
distribution at a scale between 1–1.5 m for all five stands
(Fig. 2). Some uniformity is still to be found at distance 6 m.
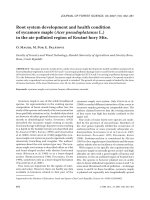
The spatial distribution of trees in jack pine stands mixed
with birch shows that jack pine trees are randomly distributed
at all scales for three of the five stands and have a clumped
distribution at scales higher than 3.6 m for the two remaining
stands (Fig. 3a). One exception to that is a trend toward uni-
formity between 1–3 m (Fig. 3a). Birch trees are clumped at
small scales with a trend towards uniform distribution at larger
scales (Fig. 3b). The bivariate statistic shows the two species
are independant except for repulsion at 3 m and 6 m (Fig. 3c).
Individual stand graphs (not shown) indicate that this repulsion
is present only on one stand.
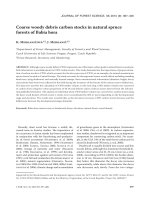
The spatial distribution of trees in jack pine stands mixed
with aspen shows that jack pine trees are usually clumped at
scales between 6 and 10 m otherwise, they are randomly dis-
tributed (Fig. 4a). Aspen trees are clumped through a large
range of scales for most stands (Fig. 4b). The bivariate statistic
shows repulsion between the two species for a wide range of
scales (Fig. 4c).
4. DISCUSSION
The results of this study shed some light on some of the
processes controlling stand composition, structure and spatial
distribution in mixed pine stands on clay soils.
Table II. Effect of stand type on skewness of basal area distribution
of the three main tree species in pure jack pine stands and stands
composed of a mixture of jack pine and white birch and jack pine
and trembling aspen.
Source DF Mean square P > F
Stand type 4 0.498 0.711
Error 19 0.929
Table III. Multiple linear regression of jack pine DBH as a function
of various sources of competition from trees inside a 6 m radius for
the three stand types.
Stand type Model Unstandardized
coefficients
Standardized
coefficients
P
Pure pine
Adj R
2
= 0.580,
N = 38
Constant
All species
Pin cherry
24.742
–1.267
–6.49
–0.763
–0.259
0.000
0.000
0.021
Excluded
variables:
Pine
Black spruce
White birch
White spruce
0.766
–0.040
–0.088
0.175
0.466
0.712
0.423
0.105
Pine with birch
Adj R
2
= 0.724,
N = 11
Constant
All species
Black spruce
31.122
–2.283
–12.831
–0.724
–0.547
0.000
0.002
0.011
Excluded
variables:
Pine
White birch
White spruce
Trembling aspen
Salix
–0.283
0.044
0.107
–0.169
0.460
0.676
0.825
0.579
0.397
0.646
Pine with aspen
Adj R
2
= 0.768,
N = 15
Constant
All species
28.116
– 2.979 –0.886
0.000
0.000
Excluded
variables:
Pine
White birch
Trembling aspen
–0.193
0.007
0.099
0.451
0.963
0.465
0
0,1
0,2
0,3
0,4
0,5
0,6
0,7
0,8
0,9
1
Pure Mixed with aspen Mixed with birch
Stand type
Skewness
Pine
Aspen
Birch
Figure 1. Skewness of basal area distribution of the
three main tree species in 68-years old pure jack
pine stands, stands mixed with aspen and stands
mixed with white birch.
Structure of mixed jack pine stands on clay 613
Establishment of most of jack pine trees within about
10 years is consistent with Gauthier et al. [17] who reported
age structures indicative of establishment within 10 to
20 years after fire on mesic mainland jack pine populations of
the same area. The small initial delay in tree establishment in
pure stands relative to mixed stands, is small enough to allow
us to use DBH as a surrogate for diameter growth for further
analysis. It also excludes the possibility that the outcome of
competition between species be influenced by such a delay at
least for this particular fire year. It would have been interesting
to also core aspen and birch trees to see if they experience the
same delay.
As of the size structures, in theory, high values of skewness
of size structure ought to be associated with a population
experiencing more assymetric competition for light whereas
low values are expected for symmetric competition for soil
resources. This could explain why jack pine shows low
skewness when mixed with birch and seems to confirm the
hypothesis of Longpré et al. [28] about lower competition for
light from birch than from pine or aspen. The very high values
of skewness for birch trees in mixtures with pine is consistent
with the fact that birch trees are overtopped by pine trees.
Although comparisons of size inequalities to characterize
competition between species are not common in the literature
and should be made with caution, low values of skewness of
aspen compared with pine in mixtures could indicate that aspen
is a stronger competitor than jack pine.
The influence of mortality might have had an important
influence on our results. According to Mohler et al. [30],
skewness is supposed to be maximal just prior to the beginning
of self thinning. Skewness is expected to be reduced afterwards
as the smaller trees in the understory die but still be positive.
Some mortality was recorded in the studied stands. However,
if the mortality was due to old tree senescence rather than to
self-thinning, then any inference concerning the influence of
spatial patterns and competition on diameter growth would be
biased because of the loss of large trees that had an important
competitive effect. However, field observation of the relative
diameter of dead trees and their coordinates indicates that they
are predominantly small trees from the understory that died
from self-thinning.
In order to see if results from the analysis of size structures
can be extrapolated to other stands, 1719 stands of various
species composition and soil type were selected in the data-
base of the Quebec Ministry of Natural Resources temporary
sample plots for the Abitibi-Témiscamingue region. These
plots indicate that skewness of basal area distribution do not
follow exactly the same trends as in study plots (unpublished).
Conversely, there was no difference in skewness in basal area
distribution of jack pine between pure jack pine stands and
stands composed of a mixture of jack pine and either of white
birch or aspen. Trembling aspen basal area distribution did not
show a lower skewness than that of jack pine when mixed
together but did show a significanly higher skewness in pure
stands. Birch skewness was not significantly different between
pure stands or mixtures with pine. However, skewness of birch
in pure stands was higher than that of jack pine and was not
significantly different from that of birch in mixture with jack
pine. The trend in aspen skewness seems to confirm that intra-
specific competition is of higher intensity than inter-specific
competition [38]. The trend in birch is in contradiction with
our hypothesis of higher intensity of competition exerted on
birch when overtopped by pine. One possible explanation of
these results is that pure stands would be more regular and thus
have fewer gaps which is confirmed in the study plots for pine
stands but would have to be confirmed for pure birch and pure
aspen stands since no stem mapping was done on those plots.
Figure 2. Ripley’s univariate L statistic
showing the spatial patterns of trees in 68-
years old pure jack pine stands. (a) L statis-
tic for one of the 5 stands superimposed
on the complete spatial randomness 95%
Monte Carlo envelope, (b) L statistic for the
range of values that are over their envelope
(significantly clumped “+”) and below their
envelope (significantly regular “”) for the
five stands.
614 M. Béland et al.
The little effect of the presence of nearby aspen or birch on
the DBH of jack pine trees on the three stand types support
Szwagrzyk’s [38] hypothesis that intra-specific competition is
more intense than inter-specific competition.
The uniform distribution of jack pine stems at a scale of 1–
1.5 m is probably indicative of the scale at which competition
between jack pine trees influence stem distribution, i.e. two
jack pine stems tend to exclude themselves when closer than
1.5 m apart. Uniformity found at distance 6 m is consistent with
the fact that radius 6 m is the best radius for the competition
index. The random distribution of jack pine is consistent with
its reproduction by seed. Kenkel et al. [25, 26] and Yarranton
and Yarranton [45] have shown that the distribution of jack
pine trees evolved with stand development from random at a
young age toward uniform as a consequence of self-thinning.
The trend toward uniformity of jack pine tree distribution in
mixture with birch may be explained in the same way as for
pure stands.
The spatial independance of jack pine and birch is explained
by birch reproducing itself by seed and by stump sprouts and
by its lower position in the canopy. Seed-origin birch trees are
probably randomly distributed and intricately mixed among
pines and influence little the spatial structure of pines, whereas
stump sprouts produce clumps of stems that are variable in
size. Larger clumps exclude pine trees over a larger area which
explains the occurence of spatial repulsion in one of the stands,
Figure 3. Ripley’s L statistic showing the
spatial patterns of trees in five 68-years old
stands composed of a mixture of jack pine
and white birch. (a) univariate L statistic for
the range of values that are over their com-
plete spatial randomness 95% Monte Carlo
envelope (significantly clumped “+”) and
below their envelope (significantly regular
“”) computed for jack pine alone, (b) uni-
variate statistic computed for birch alone
and c. Bivariate L
12
statistic computed to
test the the relationship between jack pine
and white birch (values above their enve-
lope indicate attraction between species “+”
and values below their envelope indicate
spatial repulsion between species “
”).
Structure of mixed jack pine stands on clay 615
whereas small clumps probably have no effect. Birch clumps
are probably uniformly distributed. These results and the
trends in skewness of basal area of pine in mixtures with birch
(described above) leads us to think that birch influence on pine
could be limited to symmetric competition for soil resources.
This effect was apparent at the stand level in Longpré et al. [28]
because the two species are more intricately mixed as a result
of smaller stump sprout clumps than aspen root sucker clumps.
Spatial repulsion between pine and aspen might be
explained by the strong dominance of vegetative reproduction
by root suckers for the regeneration of trembling aspen [27].
Aspen trees form large clumps that exclude pine trees. Between
clumps of aspen, pine trees are randomly distributed.
These results added to the fact that competition from aspen
in mature stands did not significantly reduce the diameter
growth of individual stems of jack pine and did not impact jack
pine basal area structure are consistent with the lack of
difference in mean jack pine diameter observed by Longpré
et al. [28] and are explained by the fact that the two species are
not intricately mixed but rather form clumps. Competition
between pine and aspen is thus limited to a relatively small
proportion of trees in mixed stand.
Overall, since competition from companion species seems
not to have had a large influence on the establishment delay,
size structure and growth of jack pine in mature stands, we are
forced to conclude that actual spatial structure and composition
of the stands is either dependent on pre-fire stand composition,
reproductive strategies of the species involved (as mentioned
earlier) or on competition induced mortality that may have
occured earlier in stand development. According to Greene and
Johnson [20], post-fire composition in aspen, jack pine and
black spruce stands is largely dependant on composition before
fire. This stability in forest composition could be caused by the
effect of forest composition on fire intensity; jack pine fuels
Figure 4. Ripley’s L statistic showing the spatial
patterns of trees in five 68-years old stands com-
posed of a mixture of jack pine and trembling
aspen. (a) univariate L statistic for the range o
f
values that are over their complete spatial ran-
domness 95% Monte Carlo envelope (signifi-
cantly clumped “+”) and below their envelope
(significantly regular “”) computed for jack pine
alone, (b) univariate statistic computed for aspen
alone and (c) Bivariate L
12
statistic computed to
test the the relationship between jack pine and
trembling aspen (values above their envelope
indicate attraction between species “+” and values
below their envelope indicate spatial repulsion
between species “
”).
616 M. Béland et al.
would favor more intense fires that kill most of the aspen roots
and aspen fuels would lower fire intensity favoring more aspen
root suckering. Another hypothesis involves the influence of
aspen wood ash which Thomas and Wein [41] showed to be
detrimental to jack pine germination before its alcaline content
is drained away by rain. The main weaknesses of these conclu-
sions is in the lack of data on stands at an earlier developmental
stage and for different fire years.
Based on that process, our study may have implications for
forest management since it is possible that cutting could favor
forest compositions dominated by aspen more so than fire
would [2, 9] even when large seedling stock are used [23, 40].
Greene and Johnson [20] argued that initial high aspen densi-
ties found after cutting are likely to diminish due to rapid self-
thinning among root suckers. However, that may not be
enough to change the relative dominance of species.
Our study could also have implications for the development
of growth and stand dynamics models of the boreal mixed
woods of Canada. Among other things, they stress the
importance of explicitly taking into account the spatial
distribution of trees. A model like SORTIE, in the process of
being calibrated in the study area would respond to this
concern.
Acknowledgments: The authors gratefully acknowledge financial
support from the NSERC-UQAT-UQAM Industrial Chair in
Sustainable Forest Management for a post-doc fellowship to Martin
Béland and from the Faculty of Forestry of Université de Moncton and
from the Groupe de recherche en écologie forestière interuniversitaire
(GREFi) for assistance to the publication. The original study was
funded by Quebec Ministry of Natural Resources. Tembec inc. and
Norbord Industries inc. made plots accessible for the study. We
acknowledge M. François Goreaud for his thorough review of the
manuscript and his help with Ripley’s statistical analyses.
REFERENCES
[1] Béland M., Dynamique et sylviculture des pinèdes à pin gris dans
la ceinture d’argile du nord-Ouest québécois, Ph.D. thesis at
UQAM, 2000.
[2] Béland M., Zarnovican R., Bergeron Y., Natural regenaration of
jack pine following harvesting and site preparation in the clay belt
of northwestern Québec, For. Chron. 75 (1999) 821–831.
[3] Béland M., Bergeron Y., Height growth of jack pine (Pinus
banksiana) in relation to site types in boreal forests of Abitibi,
Québec, Can. J. For. Res. 26 (1996) 2170–2179.
[4] Béland M., Bergeron Y., Harvey B., Robert D., Quebec’s
ecological framework for forest management: a case study in
Abitibi, For. Ecol. Manage. 49 (1992) 247–266.
[5] Bergeron Y., Camiré C., Bouchard A., Gangloff P., Analyse et
classification des sols pour une étude écologique intégrée d’un
secteur de l’Abitibi, Québec, Géogr. Phys. Quat. 36 (1982) 291–
305.
[6] Bergeron Y., Charron D., Post-fire stand dynamics in Quebec’s
southern boreal forest: a dendroecological approach, Eco-Science 1
(1994) 173–184.
[7] Besag J., Contribution to the discussion of Dr Ripley’s paper, J. R.
Statist. Soc. B 39 (1977) 193–195.
[8] Brand D.G., Magnussen S., Assymmetric, two-sided competition in
even-aged monocultures of red pine, Can. J. For. Res. 18 (1988)
901–910.
[9] Calmels S., Béland M., Bergeron Y., Jack pine regeneration on clay
from slash compared with plantation, Forestry Chronicle (to be
published).
[10] Cayford J.H., McRae D.J., The ecological role of fire in jack pine
forests, in: Wein R.W., MacLean D.A. (Eds.), The Role of Fire
in Northern Circumpolar Ecosystems, John Wiley and Sons,
Chapter 10, 1983, pp. 183–198.
[11] Dansereau P R., Bergeron Y., Fire history in the southern boreal
forest of northwestern Quebec, Can. J. For. Res. 23 (1993) 25–32.
[12] Day R.J., Woods G.T., The role of wildfire in the ecology of jack
and red pine forest in Quetico Provincial Park, Atikokan District,
North Central Region: Ontario Ministry of Natural Resources;
Report No. 5, 1977, 79 p.
[13] Diggle P.J., Statistical analysis of spatial point patterns, Academic
Press, New York, 1983, 148 p.
[14] Duncan R.P., A correction for including competitive asymmetry in
measurements of local interference in plant populations, Oecologia
103 (1995) 393–396.
[15] Environment Canada, Normales climatiques au Canada, Vol. 2:
Températures, Vol. 3: Précipitations, Service de l’environnement
atmosphérique, Environnement Canada, Ottawa, Ont., 1982.
[16] Fayle D.C.F., Bentley C.V., Growth and development of a natural
jack pine stand, in: McIver D.C., Street R.B., Auclair A.N. (Eds.),
Climate Applications in Forest Renewal and Forest Production;
Geneva Park, Orilla, Ontario, Atmospheric Environment Service,
1986, pp. 145–149.
[17] Gauthier S., Gagnon J., Bergeron Y., Population age structure of
Pinus banksiana at the southern edge of the Canadian boreal forest,
J. Veg. Sci. 4 (1993) 783–790.
[18] Gerry A.K, Wilson S.D., The influence of initial size on the
competitive response of six plant species, Ecology 76 (1995) 272–
279.
[19] Goreaud F., Pelissier R., Avoiding misinterpretation of biotic inte-
ractions with the intertype K
12
-function: population independence
vs. random labelling hypotheses, J. Veg. Sci. (to be published).
[20] Greene D.F., Johnson E.A., Modelling recruitement of Populus
tremuloides, Pinus banksiana, and Picea mariana following fire in
the mixedwood boreal forest, Can. J. For. Res. 29 (1999) 462–473.
[21] Hegyi F., A simulation model for managing jack-pine stands, in
Growth models for tree and stand simulation. Royal College of
Forestry, Stockholm, Sweden, 1974, pp. 74–90.
[22] Holmes M.J., Reed D.D., Competition indices for mixed species
northern hardwoods, For. Sci. 37 (1991) 1338–1349.
[23] Jobidon R., Roy V., Cyr G., Net effect of competing vegetation on
selected environmental conditions and performance of four spruce
seedling stock sizes after eight years in Québec (Canada), Ann. For.
Sci. 60 (2003) 691–699.
[24] Kenkel N.C., Pattern of self-thinning in jack pine: testing the
random mortality hypothesis, Ecology 69 (1988) 1017–1024.
[25] Kenkel N.C., Hoskins J.A., Hoskins W.D., Local competition in a
naturally established jack pine stand, Can. J. Bot. 67 (1989) 2630–
2635.
[26] Kenkel N.C., Hoskins J.A., Hoskins W.D., Edge effects in the use
of area polygons to study competition, Ecology 70 (1989) 272–274.
[27] Lavertu D., Mauffette Y., Bergeron Y., Effects of stand age and
litter removal on the regeneration of Populus tremuloides, J. Veg.
Sci. 5 (1994) 561–568.
[28] Longpré M.H., Bergeron Y., Paré D., Béland M., Effects of
companion species on the growth of jack pine, Can. J. For. Res. 24
(1994) 1846–1853.
[29] Lotwick H.W., Silverman B.W., Methods for analysing spatial
processes of several types of points, J. R. Statist. Soc. B 44 (1982)
406–413.
[30] Mohler C.L., Marks P.L., Sprugel D.G., Stand structure and
allometry of trees during self-thinning of pure stands, J. Ecol. 66
(1978) 599–614.
Structure of mixed jack pine stands on clay 617
[31] Nilsson U., Development of growth and stand structure in Picea
abies stands planted at different initial densities, Scand. J. For. Res.
9 (1994) 135–142.
[32] Palik B.J., Pregitzer K.S., Variability in early height growth rate
of forest trees: implications for retrospective studies of stand
dynamics, Can. J. For. Res. 25 (1994) 767–776.
[33] Peterson C.J., Squiers E.R., Competition and succession in an
aspen-white pine forest, J. Ecol. 83 (1995) 449–457.
[34] Ripley B.D., The second-order analysis of stationary point
processes, J. Appl. Probab. 13 (1976) 255–266.
[35] Rouse C., Fire effects in northeastern forests: jack pine, North
Central Forest Experiment Station, St. Paul, Minnesota: USDA,
Forest Service, 1986, 8 p.
[36] Rowe J.S, Les régions forestières du Canada, Can. For. Serv. Publ.
1300F.
[37] Szwagrzyk J., Spatial patterns of trees in natural forests of east-
central Europe, J. Veg. Sci. 4 (1993) 469–476.
[38] Szwagrzyk J., Small-scale spatial patterns of trees in a mixed Pinus
sylvestris-Fagus sylvatica forest, For. Ecol. Manage. 51 (1992)
301–315.
[39] Thibault M., Hotte D., Les régions écologiques du Québec
méridional, Deuxième approximation, Service de la cartographie,
ministère de l’Énergie et des Ressources du Québec, Québec, 1985.
[40] Thiffault N., Jobidon R., Munson A.D., Performance and physio-
logy of large containerized and bare-root spruce seedlings in rela-
tion to scarification and competition in Québec (Canada), Ann. For.
Sci. 60 (2003) 645–655.
[41] Thomas P.A., Wein R.W., Amelioration of wood ash toxicity and
jack pine establishment, Can. J. For. Res. 24 (1994) 748–755.
[42] Veillette J., Evolution and paleohydrology of glacial lakes Barlow
and Ojibway, Quat. Sci. Rev. 13 (1994) 945–971.
[43] Weiner J., Asymmetric competition in plant populations, Trends
Ecol. Evol. 5 (1990) 360–364.
[44] Wilson C.V., Le climat du Québec. Partie 1 : Atlas climatique du
Québec. Partie 2. Mise en application des renseignements climato-
logiques, Service de l’environnement atmosphérique, Environne-
ment Canada, Ottawa, Ont. Publ. 551.582.3 (714), 1973.
[45] Yarranton M., Yarranton G.A., Demography of a jack pine stand,
Can. J. Bot. 53 (1975) 310–314.
[46] Yastrebov A.B., Different types of heterogeneity and plant
competition in monospecific stands, Oikos 75 (1996) 89–97.
To access this journal online:
www.edpsciences.org