Báo cáo lâm nghiệp: "An approach for the analysis of vegetation spectra using non-linear mixed modeling of truncated power spectra" pdf
Bạn đang xem bản rút gọn của tài liệu. Xem và tải ngay bản đầy đủ của tài liệu tại đây (425.29 KB, 9 trang )
515
Ann. For. Sci. 61 (2004) 515–523
© INRA, EDP Sciences, 2004
DOI: 10.1051/forest:2004046
Original article
An approach for the analysis of vegetation spectra using non-linear
mixed modeling of truncated power spectra
Steen MAGNUSSEN
a
*, Nicholas COOPS
b
, Joan E. LUTHER
c
, Allan L. CARROLL
a
a
Natural Resources Canada, Canadian Forest Service, 506 West Burnside Road, Victoria V8Z 1M5 BC, Canada
b
CSIRO Forestry and Forest Products, Private Bag 10, Clayton South, Vic. 3169, Australia
c
Natural Resources Canada, Canadian Forest Service, PO Box 960, Corner Brook, A2H 6J3 NL, Canada
(Received 15 July 2003; accepted 17 October 2003)
Abstract – Analysis of vegetation spectra is often characterized by an adverse ratio of sample size to number of wavelengths. A reduction in
the dimensionality of the spectra is needed to ensure consistent estimates. We propose a reduction based on a non-linear mixed modeling of
power spectra transforms of truncated Fourier series representations of vegetation spectra. Two sets of foliage spectral data obtained from
balsam fir (Abies balsamea) exposed to different silvicultural regimes and three eucalypt species (Eucalyptus spp.) demonstrate the method.
Only the first 42 frequencies in a power spectrum contributed significantly to the variance of a spectrum. Power spectra were dominated by a
small number of low frequencies; the influence of frequency was described well by an exponentiated quadratic polynomial model with
significant fixed and random effects. Model parameters can be subject to physiological inference and hypothesis testing.
nonlinear-mixed model / Fourier transform / power spectra / hypothesis testing / classification
Résumé – Méthode d’analyse des spectres de végétation par modélisation mixte non linéaire des spectres de puissance tronqués.
L’analyse des spectres de végétation est souvent caractérisée par un rapport négatif entre la taille de l’échantillon et le nombre de longueurs
d’ondes. Une réduction de la dimension des spectres est nécessaire pour garantir des estimations uniformes. Nous proposons une réduction
fondée sur une modélisation mixte non linéaire des transformées de puissance spectrale des représentations de séries de Fourier tronquées visant
des spectres de végétation. Pour ce faire, nous utilisons deux ensembles de données spectrales du feuillage de sapins baumiers (Abies balsamea)
exposés à différents traitements sylvicoles et de trois espèces d’eucalyptus (Eucalyptus spp.). Seules les 42 premières fréquences de puissance
spectrale ont contribué de façon appréciable à sa variance. Un petit nombre de basses fréquences dominaient les puissances spectriques ; l’effet
de la fréquence a été bien décrit à l’aide d’un modèle polynomial quadratique d’exponentiation comportant des effets fixes et aléatoires
appréciables. Les paramètres du modèle peuvent faire l’objet d’analyse de l’hypothèse et d’une inférence physiologique.
modèle mixte non-linéaire / transformation Fourier / répartition spectrale / tests des hypothèses / classification
1. INTRODUCTION
Establishing relationships between hand-held and remote
reflectance spectra with biophysical and biochemical proper-
ties of terrestrial surface objects [31] is an important link in the
modeling and monitoring of the Earth system. For vegetated
surfaces the ability to link a variety of reflectance indices [1,
10, 11, 19, 37, 39, 40, 46, 58] to, for example, chlorophyll and
other pigment concentrations, light use efficiency, leaf water
content, and leaf area index ensures the continued pursuit of
improved sensors and signal extraction methods [5, 20, 26, 30, 55].
Extracted relationships often rely on ‘signature’ bands of
reflectance, first- or second-order derivatives of reflectance and
higher moments [19, 37, 39, 45, 46, 55, 58, 60, 64]. Endmember
classification [33] and factor spectra [11] also assist in identifying
relationships. Signatures are either known to exist from subject
knowledge but more generally they are found by various data
mining techniques, such as correlograms, stepwise regression,
multivariate factor analysis, or principal component analysis
[11, 13, 17, 32, 39]. While data mining can provide useful
insight, it is nonetheless problematic since the search for an
optimal signal often leads to overfitting, poor predictive per-
formance and biased estimates of significance of estimated
models [8, 14, 29]. Other approaches, such as, spectral mixture
analysis [2, 35, 41, 54, 56] spectral decomposition [45], deci-
sion trees [25], and lately S-space analysis [3], do not provide
unique solutions. Furthermore, issues related to sampling var-
iation, systematic errors, and natural between-object variation
are rarely addressed. Low ratios of sample size to the number
of channels in the reflectance spectrum, the colinearity of reflect-
ance values, and near singularity of covariance matrices increase
the risk of transient results [51, 52].
* Corresponding author:
S. Magnussen, J. Luther, A.L. Caroll (© 2004, Her Majesty the Queen in right of Canada).
516 S. Magnussen et al.
A transparent and robust statistical analysis approach that
lends itself to point estimation, hypothesis testing, and classi-
fication of objects based on their reflectance spectra is needed.
In addition to minimizing problems of data mining and colin-
earity, the approach should also reduce the dimensions of the
data with a minimum of information loss. It must accomplish
this reduction without losing the ability to interpret the results.
Transforming a series of observations to a power spectrum in
the frequency domain via a Fourier transform is a well accepted
procedure of data compression [47]. This paper demonstrates
how non-linear mixed models, in the frequency domain of trun-
cated Fourier transforms of vegetation spectra, can provide a
statistical approach for testing hypotheses regarding spectra
differences and help in the representation and classification of
spectra with regard to different biophysical and/or biochemical
properties. To do this we utilize two published datasets of foli-
age spectra – naturally grown Balsam fir (Abies balsamea L.)
exposed to various silvicultural treatments [32] and eucalypt
species [11]. Our focus is on methodology. Extensions to spe-
cific physiological and biological inference and hypothesis
testing is straightforward.
2. MATERIALS AND METHODS
2.1. Foliage samples
2.1.1. Balsam fir
Foliage samples for reflectance measurements were gathered on
two dates in the summer of 1996 (July 3rd and August 8th) by clipping
a midcrown branch from 24 dominant and codominant balsam fir trees
in central Newfoundland, Canada (48° 41’42’’ N and 56° 36’ 21’’ W).
The trees were growing in a randomized block design with three treat-
ments (thinning, thinning and fertilization, root pruning) and a control
replicated three times in 15 m × 15 m plots. Age determination of trees
growing in the same stand as the study trees indicated that the trees
were about 55 years old (± 1.6 years). Foliage samples (shoots) were
stratified into current-year and second-year samples (Tab. I) [32].
2.1.2. Eucalypt
Current-year and older foliage samples were collected from 14 field
plots located in the mixed eucalypt forest of the Tumbarumba study
area in New South Wales, Australia (35° 45’ S, 148° 14’ E). Foliage
from the two most dominant trees of each major eucalypt species was
excised from the upper canopy with a rifle. Leaf samples were stored
in a cool environment for a maximum of six hours until spectral meas-
urements were taken. Due to low sampling intensity of older foliage
emphasis was placed on current foliage. Table I lists the foliage sample
sizes. Coops et al. [11] provide the details of the foliage sampling pro-
tocols and the study sites.
2.2. Reflectance spectra
Eucalypt leaf reflectance measurements were obtained under field-
based laboratory conditions. Leaves from each sample were stacked
to cover an area of approximately 10 cm × 10 cm. Multiple layers rather
than single leaf profiles were used to obtain the reflectance from a layer
with an approximate infinite optical thickness. Balsam fir shoot
reflectance measurements were obtained under laboratory conditions.
Shoots were arranged in an optically thick layer on a background of
Krylon-painted aluminum to fill a circle larger than 10 cm in diameter.
Spectral reflectance measurements of eucalypt leaves and balsam fir
shoots were acquired with an Analytical Spectral Devices (ASD 1996)
FieldSpec FR spectroradiometer, which senses in the spectral range
350 to 2500 nm at a spectral bandwidth of 1.4 nm and a spectral res-
olution of 3–10 nm. Either a single 150-W or two 50-W halogen bulbs
were used as the light source to illuminate the leaves. Multiple reflect-
ance measurements were averaged to obtain a mean reflectance spec-
trum. Standard reflectance panels were used to convert the spectra to
reflectance.
As the ASD instrument has a poor signal-to-noise ratio at the
extremes of its range, the input spectra were truncated from 402 to
2449 nm resulting in 2048 (= 2
10
) wavelengths for analysis.
2.2.1. Fourier representation of spectra
For an even number (T) of wavelengths in an individual spectrum,
its Fourier representation of reflectance ω at a given wavelength
number (λ, λ = 1, , T) is [23]:
(1)
Table I. Number of foliage samples by treatment (balsam fir) and species (eucalypt). Balsam foliage was sampled from 24 trees in three blocks
and over two dates. The number of distinct balsam fir trees sampled per treatment is listed in parentheses. Eucalypt foliage samples (one per
tree) were gathered from 14 plots. Current- and second-year balsam fir foliage samples were paired to the same tree.
Balsam fir
Treatment Foliage Code Foliage samples
Thinning Current-year T1 12 (6)
Thinning Second-year T2 12 (6)
Thinning + Fertilization Current-year TF1 12 (6)
Thinning + Fertilization Second-year TF2 12 (6)
Root Pruning Second-year RP2 11 (5)
Control Current-year C1 11 (6)
Control Second-year C2 12 (6)
Eucalypt
E. delegatensis (R.T. Baker) Current-year AA 23
E. dalrympleana (Maiden) Current-year MG 13
E. macrophyncha (F. Muell) Current-year SB 8
ω
λ
ω 2/T a
j
cos
2πj
T
λ
b
j
sin
2πj
T
λ
+
a
T / 2
–1()
λ
+
j 1=
T/2–1
∑
×+=
Analysis of vegetation spectra 517
where is the mean reflectance of the spectrum, a
j
and b
j
are the Fourier
coefficients and . Fourier coefficients are obtained
by standard methods [23].
2.2.2. Power spectra of reflectance
The breakdown of the total within spectrum variance of reflectance
to individual frequencies v
k
= 2π × k/T, k = 1, 2, , T/2 follows Par-
seval’s theorem [23] stating that (for T even):
.(2)
The variance associated with each frequency
yields the power spectrum transform of a spectrum of reflectance val-
ues. The last term is a constant and trivial (here < 0.01%), and
is henceforth ignored.
Truncating the Fourier representation of a spectrum by eliminating
all terms associated with a frequency above a certain threshold, say,
, produces an approximation to the observed spectrum. A threshold
that incurs only a trivial average absolute lack of fit is to be determined.
We chose the minimum value r for which the average absolute deviation
was 0.05% or less, a limit considered well below the variation caused by
sensor noise. The variance accounted for by frequency and all higher
frequencies is considered to be white noise . The
statistical significance of the first r–1 individual terms in the power
spectrum is assessed with a F-ratio test statistic
1, , r – 1 of white noise [23]. Frequencies for which the test statistics
exceeded at the 5% significance level were deemed to contribute
significantly to the variance of a spectra. The choice of r–1 degrees
of freedom in the numerator of the F-ratio test instead of 2 was adopted
to keep the experiment-wide error rate at 0.05 or better [38]. The
number of retained frequencies contributing significantly to the spec-
tral variance is denoted by TT.
2.3. Non-linear mixed model of power spectra
Visual inspections of truncated power spectra suggested the following
non-linear relationship between the frequency and the frequency-specific
variance of the reflectance:
Exp (3)
where is the variance of the reflectance of the jth foliage
sample in the ith group (treatment × foliage age for the balsam fir sam-
ples, and species for the eucalypt samples) at frequency k (k = 1, …,
TT), is a 3 × 1 row vector of fixed effects for the ith
group and is a 3 × 1 row vector of random deviations (b
0ij
, b
1ij
, b
2ij
)
from capturing the effects of the jth sample in the ith group. Finally,
ε
ijk
is a residual term for the kth frequency in the ijth power spectrum.
A transpose of a vector (matrix) is denoted by . The random vector
is assumed distributed as a multivariate normal with a mean of and
a group specific covariance matrix of . Resid-
uals ε
ijk
are assumed independent normally distributed with a mean of 0
and a group and frequency specific variance of Exp where
, 4 are regression coefficients to be estimated. The model
for the residual terms was decided after visual inspection of ordinary
least squares residuals. According to this model, the random effects
in the balsam fir data arise due to sampling date (within tree variation),
block, and tree effects. In the eucalypt data they arise due to plot (site)
and tree effects. The expected power spectrum for a given group is one
for which the random effects are zero.
Estimation of the model parameters followed the procedures out-
lined by Pinheiro and Bates ([42], pp. 315–319) with a Laplacian
approximation of the log-likelihood function. The random effects
were constrained by a sum to 0 restriction. This approach is expected
to outperform a first-order Taylor-series approximation to the other-
wise intractable log-likelihood function. A program for the estimation
of the parameters was written in MATHEMATICA
®
[61] since no
major software package currently offers the Laplace approximation as
an option. Final estimates were obtained after one iteration of the
approximated log-likelihood function. Standard errors of the fixed
effects were obtained by standard application of the delta technique
[28] and detailed by Pinheiro and Bates [42].
A 95% confidence interval for individual power spectra belonging
to group was estimated by Monte Carlo simulation of 2000 random
realisations of the power spectrum ,
TT, j = 1, , 2000 [50]. Confidence interval limits for each frequency
were formed by the lower and upper 2.5 percentiles of the simulated
power spectra [15].
2.3.1. Hypothesis testing
A priori we expect the four balsam fir silvicultural treatments to
impart effects on the foliage reflectance spectra due to either direct
(fertilization) or indirect (thinning and root pruning) effects on foliage
chemistry, cellular structure and water content [7, 9, 16]. Species-spe-
cific differences in these factors are also conjectured for the eucalypt
foliage. These a priori expectations were tested with the null hypoth-
esis of no treatment viz. no species effect.
With the assumption of a correct model specification for the power
spectra the equality of two group average spectra was tested with
Hotellings T
2
statistic [48]. To be specific, the test statistic for testing
equality of spectra from group i and i’was:
(4)
where and are the sample sizes in Table II minus two for the
observations used for classification (see below), and is the esti-
mated variance-covariance matrix of the fixed parameter vector. The
probability of obtaining a larger T
2
under the null hypothesis of equal-
ity was obtained from the Hotelling distribution function of .
Multivariate tests of equality of group specific covariance matrices
of fixed effects were carried out as outlined by Rencher [48].
2.3.2. Conditional group membership probabilities
The proposed non-linear mixed model for group-specific power
spectra provides an estimate of group-specific model parameters and
their asymptotic gaussian variances and covariances suitable for a
discriminant analysis and classification of spectra of unknown group
origin [57]. After estimating group-specific non-linear mixed models
from a set of training data with known group membership the condi-
tional class membership of a spectra of unknown origin was com-
puted as [36]:
(5)
ω
a
T / 2
T
–1
ω
λ
j 1=
T
∑
–1()
j
=
ω
λ
j
ω–()
2
a
k
2
b
k
2
+()T
–0.5
a
T / 2
2
×+
k 1=
T/2–1
∑
=
j 1=
T
∑
σ
2
ων
k
()a
k
2
b
k
2
+()=+a
T / 2
2
, k 1= , , T/2
a
T / 2
r
ν
ν
r
∑
−
=
=
12/
22
0
)|(
ˆˆ
T
rk
k
νϖσσ
),
ˆ
2/()|(
ˆ
2
0
2
=× k
k
σνϖσ
,1−r
F
kijk
νϖσ
=
2
)|(
β
i
b
ij
+()
()
ijkkk
ενν
+
2
,,1
)|(
2
kijk
νϖ
σ
β
i
()
012
,,
ii i
βββ
b
ij
β
i
X X
′
b
ij 0
00102
01 1 12
02 12 2
2
,,
2
,,
2
,,
iiiii
ii i ii
ii ii i
bbbbb
ibbbbb
bb bb b
σσ σ
σσσ
σσ σ
Ψ=
4
0
r
ri k
r
θν
=
×
∑
,0,
ir
r
θ
=
K
i
,1,)
ˆ
,
ˆ
,
ˆ
,|(
2
=Ψ k
iiikijk
ψβνϖ
σ
k
ν
()
()
()
()
ii
iiii
ii
ii
nn
nn
nn
T
−
′
′′
′
′
−+
Ω×−+Ω×−
×
+×
′
−=
ββ
ββ
)2(
ˆ
ˆ
1
ˆ
ˆ
)1(
11
ˆˆ
ˆ
1
2
()
ii
′
−×
ββ
ˆˆ
i
n
i
n
′
()
ˆ
ˆ
i
β
Ω
2
,3
ii
nn
T
′
+
l
ω
()()
()
(
)
()
iliil
T
l
bniP
βββββϖ
ˆˆ
ˆ
ˆ
ˆ
ˆˆ
1)group(
1
1
2
1,1,3
−×Ψ+×Ω×
′
−Φ−=∈
−
−
518 S. Magnussen et al.
where is the vector non-linear least squares regression coefficients
obtained from fitting the unknown spectra to the model
Exp , is the Hotelling distribution
function, and n
i
is the sample size of group i, and are the
pooled within-group covariance matrices of fixed and random effects,
respectively. The spectrum of unknown origin is assigned to the group
yielding the highest conditional group membership probability. The
last two foliage samples in each of the seven balsam fir groups were
withheld from the model-fitting data and classified as outlined above
to one of the seven groups. Similar, the last two foliage samples in each
of the three eucalypt species were also removed from the model fitting
and subsequently classified to one of the three species.
3. RESULTS
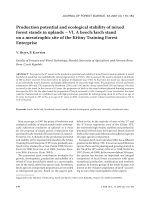
The reflectance spectra of individual foliage samples are
shown in Figure 1 and all exhibit the standard characteristics
of vegetation reflectance with low reflectance in the visible
wavelengths due to absorption of chlorophyll a and b and asso-
ciated pigments, high reflectance in the near infrared region,
and low reflectance in the SWIR, mainly as a result of strong
water absorptions (in particular at the four absorption peaks at
970, 1190, 1450 and 1940 nm) [12].
Current-year balsam fir foliage reflected almost 1.5 times more
of the light than did older foliage. A tendency for newer foliage
to contain more liquid water, less pigments and chlorophyll [32]
and for one-year-old foliage to be thicker, drier and occasionally
more damaged is the probable cause of this differentiation [21,
43, 53]. Although the eucalypt generally confirmed this pattern
the age effect was less clear, in agreement with the observation
that current and past foliage were visually very similar. Current
and one-year old-balsam fir foliage, on the other hand, could
be distinguished by a trained eye.
Eucalypt leaves had a consistently higher (about 10%) reflect-
ance than the balsam fir foliage; the cause for this difference
was not pursued further. The total wavelength-specific vari-
ance of reflectance followed basically the pattern in the reflect-
ance (Fig. 2).
Group mean spectra of reflectance are shown in Figure 3.
No single balsam fir treatment had consistently the lowest nor
the highest reflectance. Although treatment rankings were quite
stable across large parts of the spectrum (about two-thirds)
there were frequent rank changes within four segments of the
spectra that were about 100 nm wide. Luther and Carroll [32]
detail the interpretation of treatment effects within these bands.
Eucalypt species showed a more irregular pattern with red
stringybark (SB) foliage having high reflectance in the visible
yet reduced reflectance in the NIR and SWIR regions of the
spectrum.
l
β
ˆ
[]
2
210 klkll
νβνββ
×+×+
•Φ
2
1
,
1
,
3
T
ΨΩ
ˆ
and
ˆ
Figure 1. Reflectance (% ω) spectra of foliage samples. Wavelength
(λ) domain is 402–2449 nm. Nominal resolution is 1.4 nm. Spectra
of current-year foliage are in gray, and those of second-year foliage
in black.
Figure 2. Total variance of reflectance plotted against wavelength.
Analysis of vegetation spectra 519
In the Fourier representation of the spectra, a maximum of
48 frequencies sufficed to approximate the spectrum of either
a balsam fir or an eucalypt foliage spectrum to within a maxi-
mum average absolute deviation of 0.05%. With 48 frequencies
the median bias was –7 × 10
–7
% with a maximum lack of fit
for any given wavelength of just 0.8%. Higher frequencies were
considered to contribute only random noise to a spectra. In the
truncated Fourier representation of a balsam or eucalypt spec-
trum only the first approximately 30 frequencies contributed a
variance that was statistically significant larger than the vari-
ance attributed to the random noise (P ≥ 0.5) whereas another
10 frequencies were intermediate in significance (0.05 ≤ P <
0.5). In all cases, beyond the 42nd frequency the contribution
to the spectrum variance was negligible (< 0.04%). Figure 4
details the trend in significance across the first 48 frequencies.
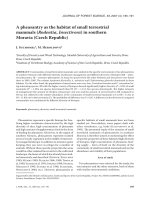
Examples of power spectra are given in Figure 5.
In the frequency domain a truncated power spectrum could
be approximated quite well by the model in (3). The non-linear
model explained over 98% of the variation within individual
power spectra. Residual variances declined initially rapidly
with increasing frequency ( , 5) but became slightly
higher and distinctly cyclical at higher frequencies . On
average, the residual variance was 0.1% at the second fre-
quency of π/1024 and about 0.5% for frequencies beyond the
Figure 3. Average reflectance spectra of balsam fir treatment groups
(pooled across foliage age) and three eucalypt species (current foliage
only). Note root pruning (RP) spectra are for current-year foliage only
(no second-year foliage samples).
,1, =k
k
ν
()
5>k
Figure 4. Summary of F-ratio tests of significance of the variance of the
reflectance associated with a specific frequency (ν
k
= π × 1024
–1
×
k, k = 1, , 47) where P (σ
2
(ν) > ) is the probability that the
variance is greater than the white noise variance associated with
frequencies . The arrow indicates the accepted truncation
point of the power spectra at the 42th frequency. The horizontal
dashed line indicates the 5% significance level under the null hypo-
thesis of no difference.
2
0
σ
2
0
σ
48, ≥k
k
ν
Figure 5. Truncated power spectra. Top: Balsam fir current-year
foliage (gray) and second-year foliage (black). Bottom: Eucalypt,
Green (AA), Blue (MG), Red (SG). Note MG power spectra are hidden
behind those of AA and SG. A colour version of this figure is available
at www.edpsciences.org/afs/
520 S. Magnussen et al.
fifth. Examples of model fit and the 95% bootstrap confidence
intervals of individual spectra are in Figure 6. Overall, the expo-
nential quadratic polynomial provides a low-dimensional rep-
resentation of a foliage spectra with, hopefully, a minimum of
information loss in the frequencies of important group differ-
entiation. Details of model parameter estimates are in Table II.
Non-linear least squares regression coefficients of individual
power spectra within a group varied sufficiently to support the
notion of random (sample) effects. The estimated group mean
power spectra and associated 95% confidence intervals of indi-
vidual sample spectra appear quite satisfactory in comparison
with individual observed power spectra. The standard deviation
of each of the three random effects (Tab. II) relative to their
associated fixed effects provides a measure of their relative
importance. Although one or sometimes two random effects
appear to contribute only a trivial amount of variation within a
group dropping them from the group model would in most cases
decrease the log likelihood significantly. To maintain model
consistency across groups no term was dropped. No significant
difference in reflectance variance between group means
(within a foliage class) emerged beyond the first five frequen-
cies (P > 0.28). Hence, the observed minor but systematic bias
of model predictions at higher frequencies was ignored. As
expected, the confidence interval shrinks rapidly with increas-
ing frequency.
Statistical T
2
-tests of equality of group mean power spectra
for the current-year foliage in balsam fir supported the null
hypothesis of no difference between a treatment and a control
(no P-value below 0.68). In contrast, power spectra of second-
year foliage (RP2, TF2 and T2) differed significantly from that
of the controls (C2, P < 0.001). No other pair-wise difference
between any two treatments emerged as significant. An approx-
imately ten-fold increase in the determinants of current-year
foliage power spectrum covariance matrices compared to second-
year foliage determinants is the main numerical reason for the
lack of significant treatment effects in current-year foliage. The
higher reflectance of current-year foliage is believed to be the root
cause behind this inflation. The effect of foliage age was, as
expected, highly significant across all treatment groups. Expected
mean power spectra of the three eucalypt species were dis-
tinctly different from each other. All pairwise comparisons
yielded highly significant T
2
-test statistics (P < 0.001).
Classification results based on conditional group membership
probabilities suggest some potential for practical application,
at least in the case of balsam fir where 7 of 14 power spectra
(= two spectra from each of the seven treatment × foliage age
combinations available; see Tab. I) of unknown origin were
assigned to the correct treatment × foliage age group. Strong
heterogeneity of the eucalypt variance covariance matrices of
random and fixed effects effectively made the eucalypt classi-
fication no better than chance (2 of 6 spectra of unknown origin
were correctly classified to one of the three species).
4. DISCUSSION AND CONCLUSIONS
High-dimensional autocorrelated data are commonplace in
sensor data [24, 44, 49]. When the ratio of sample size n to the
number of parameters to be estimated p falls below 1.0 most
popular techniques of multivariate analysis fail due to singularity
Table II. Laplacian approximation maximum likelihood estimates of power spectra model parameters for balsam fir treatment groups and
three eucalypt species. Numbers in brackets are asymptotic estimates of standard errors. See Table I for code definitions.
Code
×10
–2
×10
–3
×10
–1
×10
–3
T1 7.16
(0.18)
–5.49
(1.35)
10.64
(6.51)
1.14 0.00 2.42
T2 6.37
(0.11)
–5.17
(0.61)
6.61
(3.44)
0.79 0.00 0.00
TF1 7.05
(0.17)
–5.40
(1.27)
11.20
(5.77)
1.16 0.00 2.03
TF2 6.44
(0.12)
–5.46
(0.72)
11.14
(3.48)
1.15 0.00 3.21
RP2 6.66
(0.15)
–5.89
(0.91)
12.26
(4.17)
1.16 0.00 3.58
C1 7.22
(0.19)
–5.74
(1.35)
11.41
(6.26)
1.10 0.00 3.20
C2 6.47
(0.11)
–5.25
(0.64)
6.94
(3.60)
0.79 0.00 0.00
AA 7.59
(0.01)
–5.62
(0.04)
9.19
(0.18)
0.93 0.89 0.00
MG 7.58
(0.03)
–5.34
(0.08)
9.99
(0.37)
0.09 0.25 0.00
SB 7.63
(0.07)
–6.21
(0.02)
10.28
(9.25)
0.10 0.00 6.14
0
ˆ
β
1
ˆ
β
2
ˆ
β
0
ˆ
b
σ
1
ˆ
b
σ
2
ˆ
b
σ
Analysis of vegetation spectra 521
of covariance matrices [48]. Under these circumstances a sta-
tistical analysis requires a reduction of the number of variables [4,
6, 18, 62]. Mining high-dimensional data in an undirected search
for “interesting” relationships between variables will bias the
probabilities of Type I errors in follow-up statistical tests sta-
tistics and will frequently result in poor model predictions due
to overfitting [8]. Subject knowledge and a priori formulated
models and hypotheses may, of course, accomplish the reduc-
tion in a straightforward manner. Alternatively, a reduction is
achieved by some multivariate transformation; the proposed
approach falls into this category. All transformations pose the
challenge of deciding on an acceptable loss of information and
interpretation of the results. Our approach provides a transpar-
ent and intuitive method of dimension reduction based on fit to
observed spectra, and the simple trend patterns in the power
spectra facilitates statistical analysis and hypothesis testing.
Sensor data from an object (here, a foliage sample) are, with
respect to the object, to be treated statistically as repeated meas-
urements or longitudinal data [63]. Longitudinal data are charac-
terized by a within- and between-subject variance (covariance)
of observations. In a modeling context the within-subject var-
iance (covariance) is usually captured by introduction of a ran-
dom subject effect [34]. The “problem” of autocorrelation of
reflectance values is effectively resolved by modeling individ-
ual spectra as random deviations from their group expectations.
Once a suitable model for the expected group mean trend is
found the fitting and testing of group effects can occur within
a well-established framework of statistical inference [34]. In
Figure 6. Observed (gray), fitted group mean (black), and bootstrap 95% population confidence limits (dashed) of power spectra. Top four
panels: Balsam fir treatment groups (second-year foliage). Bottom three panels: Eucalypt species (current foliage).
522 S. Magnussen et al.
contrast, the effects of within- and among-group variances and
covariances in classical multivariate transformations such as
principal components and factor analysis are less clear [48].
As demonstrated, a vegetation spectrum can be represented
with a maximum lack of fit well below the level of sensor noise
by a relatively short (truncated) Fourier series. Taking the trun-
cated spectrum into the frequency domain results in a power
spectrum that is dominated strongly by the main features (the
bulges) of the reflectance spectrum. A low-dimensional para-
metric or semiparametric [22, 27] non-linear model will suffice
to describe these low-frequency features well. However, such
models invariably relegate detail at higher frequencies to the
residual variance despite the fact that group effects can be sta-
tistically significant at higher frequencies. The large number of
published foliage spectra suggest that these findings are of a
general nature.
A model reflecting the effects of groups and individual sam-
ples on the first few low frequencies in a power spectrum rep-
resentation of a reflectance spectrum captures the large feature
variation between groups and samples in support of statistical
inference of simple hypotheses of, say, equality, and a classi-
fication based on these features. A lack of statistical significant
differences in major features does not preclude the existence
of significant fine detail differences [32]. An analysis of an
a priori defined waveband conjectured to represent a feature of
interest is recommended for pursuit of this detail.
In the frequency domain of a vegetation spectrum one should
not, a priori, expect to find a direct causal relationship between
the spectrum variance explained by a certain frequency and a
physiological process or a chemical constituent. Correlations
may, of course, exist, but they may arise from the complex
interaction of several factors.
Practical applications of our approach are not limited to data
from designed experiments. Random effects, for example of
site, region, date, age, etc., can be incorporated into a hierar-
chical system within our modeling approach to reflect even
very complex data structures. Data imbalance (missing values)
is not a particular problem as long as data are missing com-
pletely at random [34, 59]. This flexibility combined with the
relative ease of modeling the trends in a power spectrum within
a well-known statistical framework is perhaps the best feature
of the proposed approach to analysis of vegetation spectra. Our
analysis approach extends naturally to in-situ collected spectra
although they show less structure and contain less information
than spectra obtained under controlled or semi-controlled con-
ditions.
Both the random and the fixed model parameters estimated
by the proposed methodology can be related to a set of meas-
urable leaf variables (for examples, water content, pigment
concentration, or nutrient content) by either adding these cov-
ariates as predictors or by a second-stage regression analysis.
REFERENCES
[1] Asner G.P., Biophysical and biochemical sources of variability in
canopy reflectance, Remote Sens. Environ. 64 (1998) 234–253.
[2] Asner G.P., Heidebrecht K.B., Spectral unmixing of vegetation,
soil and dry carbon cover in arid regions: comparing multispectral
and hyperspectral observations, Int. J. Remote Sens. 23 (2002)
3939–3958.
[3] Bielski C.M., Dube P., Cavayas F., Marceau D.J., S-space: a new
concept for information extraction from imaging spectrometer data,
Int. J. Remote Sens. 23 (2002) 2005–2022.
[4] Brown P.J., Haque M.S., Discrimination with many variables, J.
Am. Stat. Assoc. 94 (1999) 1320–1329.
[5] Bubier J.L., Rock B.N., Crill P.M., Spectral reflectance measure-
ments of Boreal wetland and forest mosses, J. Geophys. Res.
Atmosph. 102 (1997) 29483–29494.
[6] Campbell N.A., Robust procedures in multivariate analysis. I. Robust
covariance estimation, Appl. Stat. 29 (1980) 231–237.
[7] Carter G.A., Responses of leaf reflectances to plant stress, Am. J.
Bot. 80 (1993) 243.
[8] Casella G., Berger R.L., Statistical Inference, Duxbury, London,
2002.
[9] Chapin F.S.I., Integrated responses of plants to stress, BioScience
41 (1991) 36.
[10] Chen Z.K., Elvidge C.D., Groeneveld D.P., Monitoring seasonal
dynamics of arid land vegetation using AVIRIS data, Remote Sens.
Environ. 65 (1998) 255–266.
[11] Coops N., Dury S., Smith M.L., Martin M., Ollinger S., Compari-
son of green leaf eucalypt spectra using spectral decomposition,
Aust. J. Bot. 50 (2002) 567–576.
[12] Curcio J.A., Petty C.C., The near infrared absorption spectrum of
liquid water, J. Opt. Soc. Am. 41 (1951) 302–304.
[13] Datt B., Identification of green and dry vegetation components with
a cross-correlogram spectral matching technique, Int. J. Remote
Sens. 21 (2000) 2133–2139.
[14] Draper N.R., Smith H., Applied Regression Analysis, Wiley, New
York, 1981.
[15] Efron B., Tibshirani R.J., An introduction to the bootstrap, Chap-
man & Hall, Boca Raton, 1993.
[16] Ferretti M., Forest health assessment and monitoring – issues for
consideration, Environ. Monit. Assess. 48 (1997) 45–72.
[17] Fourty T., Baret F., On spectral estimates of fresh leaf biochemis-
try, Int. J. Remote Sens. 19 (1998) 1283–1297.
[18] Fraley C., Raftery A.E., Model-based clustering, discriminant ana-
lysis, and density estimation, J. Am. Stat. Assoc. 97 (2002) 611–
631.
[19] Fuentes D.A., Gamon J.A., Qiu H.L., Sims D.A., Roberts D.A.,
Mapping Canadian boreal forest vegetation using pigment and
water absorption features derived from the AVIRIS sensor, J. Geo-
phys. Res. Atmosph. 106 (2001) 33565–33577.
[20] Gastellu-Etchegorry J.P., Bruniquel-Pinel V., A modeling approach
to assess the robustness of spectrometric predictive equations for
canopy chemistry, Remote Sens. Environ. 76 (2001) 1–15.
[21] Giertych M.J., Karolewski P., De Temmerman L.O., Foliage age
and pollution alter content of phenolic compounds and chemical
elements in Pinus nigra needles, Water Air Soil Pollut. 110 (1999)
363–377.
[22] Härdle W., Mammen E., Müller M., Testing parametric versus
semiparametric modeling in generalized linear models, J. Am. Stat.
Assoc. 93 (1998) 1461–1474.
[23] Harvey A.C., Time series models, Phillip Allan, Oxford, 1981.
[24] Howard J.A., Remote sensing of forest resources. Theory and appli-
cation, Chapman & Hall, London, 1991.
[25] Jia X.P., Richards J.A., Progressive two-class decision classifier for
optimization of class discriminations, Remote Sens. Environ. 63
(1998) 289–297.
[26] Johnson L.F., Nitrogen influence on fresh-leaf NIR spectra, Remote
Sens. Environ. 78 (2001) 314–320.
[27] Ke C., Wang Y., Semiparametric nonlinear mixed-effects models
and their applications, J. Am. Stat. Assoc. 96 (2002) 1272–1283.
[28] Kendall M.G., Stuart A., The advanced theory of statistics, Griffin,
London, 1969.
[29] Lehmann E.L., Theory of Point Estimation, Wiley, New York,
1983.
Analysis of vegetation spectra 523
[30] Longhi I., Sgavetti M., Chiari R., Mazzoli C., Spectral analysis and
classification of metamorphic rocks from laboratory reflectance
spectra in the 0.4–2.5 µm interval: a tool for hyperspectral data
interpretation, Int. J. Remote Sens. 22 (2001) 3763–3782.
[31] Lunetta R.S., Elvidge C.D., Remote sensing change detection.
Environmental monitoring methods and applications, Taylor &
Francis, London, 1999.
[32] Luther J., Carroll A.L., Development of an index of balsam fir vigor
by foliar spectral reflectance, Remote Sens. Environ. 69 (1999)
241–252.
[33] Maselli F., Definition of spatially variable spectral endmembers by
locally calibrated multivariate regression analysis, Remote Sens.
Environ. 75 (2001) 29–38.
[34] McCulloch C.E., Searle S.R., Generalized, linear, and mixed
models, Wiley, New York, 2001.
[35] McGwire K., Minor T., Fenstermaker L., Hyperspectral mixture
modeling for quantifying sparse vegetation cover in arid environ-
ments, Remote Sens. Environ. 72 (2000) 360–374.
[36] McLachlan G.J., Discriminant analysis and statistical pattern ana-
lysis, Wiley, New York, 1991.
[37] Melack J.M., Gastil M., Airborne remote sensing of chlorophyll
distributions in Mono Lake, California, Hydrobiol. 466 (2001) 31–38.
[38] Miller R.G. Jr., Simultaneous Statistical Inference, 2nd ed., Sprin-
ger, New York, 1980.
[39] Nichol C.J., Huemmrich K.F., Black T.A., Jarvis P.G., Walthall
C.L., Grace J., Hall F.G., Remote sensing of photosynthetic-light-
use efficiency of Boreal forest, Agric. For. Meteorol. 101 (2000)
131–142.
[40] Niemann K.O., Goodenough D.G., Bhogal A.S., Remote sensing of
relative moisture status in old growth Douglas-fir, Int. J. Remote
Sens. 23 (2002) 395–400.
[41] Okin G.S., Roberts D.A., Murray B., Okin W.J., Practical limits on
hyperspectral vegetation discrimination in arid and semiarid envi-
ronments, Remote Sens. Environ. 77 (2001) 212–225.
[42] Pinheiro J.C., Bates D.M., Mixed-effects models in S and S-plus,
Springer, New York, 2000.
[43] Pinkard E.A., Beadle C.L., Davidson N.J., Battaglia M., Photosyn-
thetic responses of Eucalyptus nitens (Deane and Maiden) Maiden
to green pruning, Trees-Struct. Funct. 12 (1998) 119–129.
[44] Pratt W.K., Digital Image Processing, Wiley, New York, 1991.
[45] Price J.C., An approach for analysis of reflectance spectra, Remote
Sens. Environ. 64 (1998) 316–330.
[46] Rahman A.F., Gamon J.A., Fuentes D.A., Roberts D.A., Prentiss
D., Modeling spatially distributed ecosystem flux of Boreal forest
using hyperspectral indices from AVIRIS imagery, J. Geophys.
Res. Atmosph. 106 (2001) 33579–33591.
[47] Ramsay J.O., Silverman B.W., Functional data analysis, Springer,
New York, 1997.
[48] Rencher A.C., Methods of multivariate analysis, Wiley, New York,
1995.
[49] Ripley B.D., Statistics, images, and pattern recognition, Can. J.
Stat. 14 (1985) 83–111.
[50] Robert C.P., Casella G., Monte Carlo statistical methods, Springer,
New York, 1999.
[51] Scott D.W., Multivariate density estimation: Theory, practice and
visualization, Wiley, New York, 1992.
[52] Searle S.R., Matrix algebra useful for statistics, Wiley, New York,
1982.
[53] Sellin A., Morphological and stomatal responses of Norway spruce
foliage to irradiance within a canopy depending on shoot age, Envi-
ron. Exp. Bot. 45 (2001) 115–131.
[54] Suen P.H., Healey G., Invariant identification of material mixtures
in airborne spectrometer data, J. Opt. Soc. Amer. A Opt. Image Sci.
Vision 19 (2002) 549–557.
[55] Thenkabail P.S., Smith R.B., De Pauw E., Hyperspectral vegetation
indices and their relationships with agricultural crop characteristics,
Remote Sens. Environ. 71 (2000) 158–182.
[56] Theseira M.A., Thomas G., Sannier C.A.D., An evaluation of spec-
tral mixture modelling applied to a semi-arid environment, Int. J.
Remote Sens. 23 (2002) 687–700.
[57] Titterington D.M., Smith A.F.M., Makov U.E., Statistical analysis
of finite mixture distributions, Wiley, Chichester, 1985.
[58] Trotter G.M., Whitehead D., Pinkney E.J., The photochemical
reflectance index as a measure of photosynthetic light use effi-
ciency for plants with varying foliar nitrogen contents, Int. J.
Remote Sens. 23 (2002) 1207–1212.
[59] Verbeke G., Lesaffre E., A linear mixed-effects model with hetero-
genity in the random-effects population, J. Am. Stat. Assoc. 91
(1996) 217–221.
[60] Vodacek A., Kremens R.L., Fordham A.J., Vangorden S.C., Luisi
D., Schott J.R., Latham D.J., Remote optical detection of biomass
burning using a potassium emission signature, Int. J. Remote Sens.
23 (2002) 2721–2726.
[61] Wolfram S., The Mathematica Book, Wolfram Media / Cambridge
University Press, Champaign, IL, 1999.
[62] Woodruff D.L., Rocke D.M., Computable robust estimation of
multivariate location and shape in high dimension using compound
estimators, J. Am. Stat. Assoc. 89 (1994) 888–899.
[63] Zeger S.L., Liang K Y., Albert P.S., Models for longitudinal data:
A generalized estimating equation approach, Biometrics 44 (1988)
1049–1060.
[64] Zhang X.H., Chen C.H., New independent component analysis
method using higher order statistics with application to remote sen-
sing images, Opt. Eng. 41 (2002) 1717–1728.
To access this journal online:
www.edpsciences.org