Báo cáo lâm nghiệp: "Carbon and nitrogen winter storage and remobilisation during seasonal flush growth in two-year-old cork oak (Quercus suber L.) saplings" pptx
Bạn đang xem bản rút gọn của tài liệu. Xem và tải ngay bản đầy đủ của tài liệu tại đây (447.77 KB, 9 trang )
721
Ann. For. Sci. 61 (2004) 721–729
© INRA, EDP Sciences, 2004
DOI: 10.1051/forest:2004058
Original article
Carbon and nitrogen winter storage and remobilisation during
seasonal flush growth in two-year-old cork oak
(Quercus suber L.) saplings
Sofia CERASOLI
a,b
*, Pascale MAILLARD
c
, Andrea SCARTAZZA
d
, Enrico BRUGNOLI
d
,
Maria Manuela CHAVES
a,b
, João Santos PEREIRA
a
a
Instituto Superior de Agronomia, Tapada da Ajuda, 1349-017 Lisbon, Portugal
b
Instituto de Tecnologia Química e Biológica, Aptd. 12, 2781-901 Oeiras, Portugal
c
UMR INRA-Université Henri Poincaré, Écologie et Écophysiologie Forestières, INRA Centre de Nancy, 54280 Champenoux, France
d
Consiglio Nazionale delle Ricerche, Istituto de Biologia Agroambientale e Forestale, Via Guglielmo Marconi 2,
Villa Paolina, 05010 Porano (TR), Italy
(Received 1 April 2003; accepted 20 August 2003)
Abstract – A dual long-term
13
C and
15
N labeling was used to assess the contribution of winter assimilated carbon (C) and nitrogen (N) for the
spring growth flush of two-year-old cork oak plants. Changes in concentrations and partitioning of winter assimilated C and N, total C and N,
and total-non-structural carbohydrates were followed from January to August in the various plant parts (first year and second year leaves, stem,
branches, coarse and fine roots). No loss of winter C and N was observed with time suggesting that winter assimilates are retained within the
plant and contribute to storage. A strong mobilisation of C and N was demonstrated from first year leaves and fine roots during the spring growth
flush. Leaves from the second year and, to lesser extent, branches acted as sinks for winter C and N. At the beginning of the new leaf growth,
a significant decrease in starch concentration occurred in first year leaves. In August, before leaf fall we observed also a mobilisation from first
year to second year leaves, of N assimilated after labeling. We conclude that under these experimental conditions, both winter and current C
and N were used for the spring growth flush of the cork oak plants. The foliage grown during the previous year was a source of winter and
recently assimilated N and a source of C from recent assimilates for the new growth in the spring.
Quercus suber / 13C labeling / 15N labeling / remobilisation / carbohydrates
Résumé – Mise en réserve hivernale du carbone et de l’azote et remobilisation lors de la croissance saisonnière de chênes-lièges
(Quercus suber L.) âgés de deux ans. Un double marquage
13
C et
15
N à long terme a été réalisé afin d’évaluer la contribution du carbone (C)
et de l’azote (N) assimilés durant l’hiver, à la croissance printanière de chênes-lièges âgés de deux ans. Les évolutions concomitantes des
concentrations et de la répartition du C, du N, ainsi que la concentration en glucides totaux non structuraux, ont été suivies de janvier à août
dans les différents organes (feuilles préexistantes et printanières, tige principale, rameaux axillaires, grosses et fine racines) des jeunes arbres.
Le C et le N assimilés durant l’hiver ne sont pas perdus par les plants. Une forte mobilisation de C et de N est observée au printemps, pendant
la période de croissance aérienne, au niveau des feuilles préexistantes et des racines fines. Les feuilles développées au printemps et, dans une
moindre mesure les rameaux axillaires, importent le C et le N assimilés durant l’hiver. Lorsque la croissance des nouvelles feuilles démarre,
une diminution significative de la concentration en amidon est observée dans les feuilles préexistantes. En août, lors de leur sénescence, une
exportation d’azote nouvellement assimilé est aussi observée au niveau des feuilles préexistantes. Nous concluons que, dans nos conditions
expérimentales, il existe une coopération entre le C et le N assimilés en hiver et au printemps pour assurer la croissance printanière des plants
de chêne-liège. Il est démontré en outre que feuilles préexistantes sont une source de N hivernal et de C et de N nouvellement assimilés pour
cette nouvelle croissance.
Quercus suber / marquage
13
C / marquage
15
N / remobilisation / carbohydrates
1. INTRODUCTION
It has been widely demonstrated that in deciduous trees
wood and roots are major reservoirs for carbon (C) and nitrogen
(N) storage [4, 12]. Consequently, these organs will have an
important role during winter and early spring in supplying C
and N for maintenance metabolism and new growth. In ever-
greens, pre-existing leaves can also behave as sources of C and
N as new growth occurs. Starch is often considered as the main
form of C storage in plants. The mobilization and utilization of
* Corresponding author:
722 S. Cerasoli et al.
stored C implies the hydrolysis of starch and the synthesis of
sucrose, which is the main form of transport in plants [15]. Con-
sequently, mobilisation of starch results in a depletion of its
concentration in organs where it accumulated. In stem of decid-
uous species like hybrid poplar [33] and silver birch (Betula
pendula Roth) [25], as in wood and roots of young walnut trees
(Juglans regia L.) [11] the lowest starch concentrations were
observed just before bud break. In evergreens, a similar
decrease was observed in wood [5] in roots [10], and also in
one and two-year old needles [5]. In evergreens species starch
depletion was to a lesser extent than in deciduous consequence
of storage mobilisation, whereas the major fraction of starch
depletion was due to the decrease in the flow of photosynthates
directed downwards when the sink strength of sprouts
increased.
Also patterns of N storage and remobilisation show partic-
ularities inherent to deciduous and evergreen species. In deciduous
trees such as peach (Prunus persica (L.) Batsch), N is massively
withdrawn before leaf senescence from leaves to shoots and
roots where it is stored until the next growing season, when it
is used to support new leaf growth [30]. In evergreens, N is
translocated from previous years’ leaves, not only before their
fall [19] but in contrast to deciduous trees, also during the whole
leaf lifetime [32]. Similarly to deciduous species, N remobili-
sation in evergreens was demonstrated not only from leaves but
also from roots and wood, as shown in Sitka spruce (Picea
sitchensis (Bong.) Carr.) [18] and orange trees (Citrus sinensis
(L.) Osbeck) [13].
Cork oak (Quercus suber L.) is a broadleaved evergreen
from Mediterranean region with a leaf life span of about one
year, a short longevity compared to leaf lifetime of other ever-
greens such as conifers [6]. In adult trees, previous year’s leaves
usually fall along with the spring growth flush of new leaves
at the beginning of summer [8]. A second growth flush, less
intense, can also occur in autumn if environmental conditions
allow it [23]. Little is known about C and N balances in cork
oak, either in young or adult trees grown under natural condi-
tions. Some studies examined seasonal dynamics of N concen-
tration in leaves [20] and in litterfall [27]. However, at our
knowledge, only one study investigated mechanisms of N stor-
age and remobilisation in cork oak during winter and following
spring [1] and none considered together dynamics of C and N
during these periods. Nevertheless, as seen above, these proc-
esses are important prerequisites for evergreens to ensure new
growth in spring and to resist to biotic and abiotic stresses [2].
Moreover, as a consequence of global climate change, more
arid conditions are predicted to occur in the Mediterranean
region [21]. A basic knowledge on the utilisation of reserves
could be of great help for future investigations endeavouring
to understand the ability of this species to survive to future chal-
lenges.
Previous studies demonstrated that dual labeling of plants
with stable isotopes of C and N is a powerful tool to follow their
partitioning within the plant [16] and to distinguish recycling
from new uptake [22]. In the present study, cork-oak saplings
were subjected to a dual long-term labeling with
13
C and
15
N
isotopes in winter, when no growth was expected. In this way,
C and N stored in winter were labeled, allowing to evaluate,
the next spring, the relative contribution for the growth of new
organs, of C and N remobilised from storage tissues or recently
acquired by new N uptake and C assimilation.
With this approach we attempted to answer to the following
questions: (1) What is the contribution of winter stored C and
N for next spring and summer flush growth; (2) Which organs
in cork oak act as sources of stored C and N and which are their
respective sinks; (3) Whether sinks’ strength can induce mod-
ifications in the C/N equilibrium under non-limiting conditions
for C and N assimilation.
2. MATERIALS AND METHODS
2.1. Plant material and experimental conditions
Eight-month-old cork oak (Quercus suber L.) saplings were trans-
planted in July 1996 into 7.7 dm
3
pots filled exclusively with washed
sand. Cotyledons were removed to induce early autotrophy. The
experiment took place outdoors at the Instituto Superior de Agronomia
(Lisbon, Portugal). Plants were regularly watered and, twice a week,
fertilised with a complete nutrient solution (6 mol m
–3
N in the form
NH
4
NO
3
) as detailed in [17]. Spring growth flush began in March and
lasted until July 1997. Between June and July new leaf emission was
monitored.
2.2.
13
C and
15
N labeling
Between December 1996 and January 1997, 45 plants were labeled
with
13
CO
2
and
15
NH
4
15
NO
3
, respectively. Labeling was performed
when no growth was expected. Three sets of 15 plants each were
placed for five days in a growth cabinet (FITOCLIMA 700 EDTU,
ARALAB, Portugal) where atmospheric CO
2
was provided by a com-
mercial cylinder with a
13
CO
2
/
12
CO
2
ratio of 3.24 atom% (CK Gas
Products, ltd. UK). This
13
CO
2
labeling cycle (5 days) was repeated
for each set of plants. At the same time, all 45 labeled plants were fed,
every two days, with a nutrient solution enriched in
15
N (6 atom%) in
the form
15
NH
4
15
NO
3
(CK Gas Products, ltd. UK). Plants were placed
in the cabinet the evening before the beginning of the labeling cycle.
Just before to that, plant pots were enclosed individually in a plastic bag,
tied at the collar by a rubber to improve adherence and to limit the emis-
sion of CO
2
from root respiration. Temperature (min: 15 °C, max:
25 °C), relative humidity (55%), and CO
2
concentration (350 ppm)
were controlled in the growth cabinet. Light (provided by incandescent
and fluorescent lamps) switched on at 9:30 am and off at 5:30 pm. Its
maximum intensity (1000–1300 µmol m
–2
s
–1
) was reached half an
hour later. Every day, in order to prevent discrimination against
13
C
during C assimilation [3], CO
2
supply was stopped two hours before
the end of the photoperiod (8 h) and CO
2
concentration was let to decrease
down to the compensation point (about 100 ppm), as was assessed by
a preliminary test. A ventilator in the lower part of the growth cabinet
ensured a uniform CO
2
concentration. The isotopic composition of
atmospheric CO
2
was indirectly assessed in the chamber and in the glass-
house by isotopic analysis of leaves of one-month-old Zea mays seed-
lings [24]. Maize leaves were harvested on day 3 and day 5 of each
cycle in the growth cabinet.
Along the three labeling cycles, labeled and unlabeled plants stayed
temporarily in a greenhouse. In this way differences between growth
conditions of the 15 labeled plants in the cabinet for five days and of
the remaining 30 labeled and 45 unlabeled plants were limited. Tem-
perature and relative humidity in the greenhouse were controlled and
similar to those in the growth-cabinet, while light irradiance was nat-
ural. Lateral windows allowed a continuous renewal of the air in the
greenhouse. At the end of labeling, plants were transferred outside.
Remobilisation of stored C and N in cork oak 723
2.3. Plant harvest and isotopic analyses
Destructive harvests were performed in January 1997 at the end of
labeling, in March at the beginning of the new growth flush, and in
August when new leaves were mature. For each harvest, 12 plants, six
labeled and six at natural abundance of
13
C and
15
N, were collected.
Biomass was divided into first year leaves (developed in 1996, before
labeling), second year leaves (developed from March to July 1997)
stem, branches, and coarse and fine roots. Plant material was dried in
an oven (70 °C) for 48 h, weighed and finely ground in a laboratory
mill (MM2000, Retsch, Germany). Isotopic analyses were performed
partly in an elemental analyser (NA 1500 NCS, Carlo Erba, Milan,
Italy) coupled with a mass spectrometer (VGA optima, Fisons Micro-
mass, England) at the “Institut de Biotechnologie des Plantes”, Uni-
versité de Paris Sud (Orsay, France), and partly in an elemental analyser
(EA, Carlo Erba, Milan, Italy) coupled with a mass spectrometer (VG
Sira, Serie II, England) at the “Istituto de Biologia Agroambientale e
Forestale”, Consiglio Nazionale delle Ricerche (Porano, Italia). The
two machines were inter-calibrated.
Calculations were similar for
13
C and
15
N [3, 31]. Only formulas
for carbon (C) are shown below, for nitrogen (N) the suffix
C
should
be substituted with
N
. Parameters used are:
The relative specific allocation (RSA
C
), expressed in percentage,
which corresponds to the fraction of the all C (labeled and not labeled)
incorporated during the labeling period, and allows estimating in each
plant compartment the turnover rate of this element after the labeling
period.
where A represents the isotopic abundance and was calculated as
described in Deléens et al. [3]. A
labeled sample
% is the isotopic abundance
in a specific compartment of a labeled plant and A
unlabeled sample
% is
the average isotopic abundance of the respective compartment of the
unlabeled plants.
13
C atom% enrichment of Zea mays leaves, sub-
jected to the same labeling cycle than cork oak saplings, was used to
calculate A
labeled source
% (1.36%, 1.53% and 1.41% for the three labe-
ling cycles). A
unlabeled source
% (1.097%) was obtained from Zea mays
leaves not subjected to the enriched atmosphere in the growth cabinet.
A
labeled source
% and A
unlabeled source
% for nitrogen were obtained from
15
N atom% in the labeled (6 atom%) and unlabeled (0.39 atom%)
nutrient solution.
The winter C content was calculated for each plant part considering
its dry mass and C concentration: Winter C (mg tree
–1
) = RSA
C
× dry
mass × C concentration.
Partitioning of labeled C in plant was determined for each part as:
where the plant winter C content is given by the sum of the content of
every individual part. Partitioning of winter N and total C and N were
calculated with a similar procedure.
2.4. Non-structural carbohydrate analyses
Samples of leaves, stem, lateral branches and coarse roots were col-
lected for non-structural carbohydrate determinations in six plants at
each harvest. Leaf samples were always collected early in the morning
(8:00 h). First order branches were collected near their insertion point
on the stem. Stem samples were collected below the insertion of the
lower branch and coarse root samples few centimetres below the col-
lar. The proportion of wood and bark tissues in samples was main-
tained equal to the original. Fresh material was immediately frozen in
liquid nitrogen and stored at –80 °C until analyses. Soluble sugars were
extracted in ethanol (70%, v/v), the residue was incubated in HCl
(1.1%, v/v) for 30 min at 95 °C for starch extraction. Both soluble sug-
ars and starch were determined colorimetrically at 625 nm with
anthrone reagent [28]. Results are expressed as the percentage of C in
the carbohydrate per total C.
2.5. Statistical analyses
For every variable a one-way ANOVA was employed to analyse
differences among harvest independently in each plant part as in the
whole plant and in the biomass ratios. In order to compare C and N
concentration as well as of the ratio C:N between first year and second
year leaves a t-test was performed for each harvest. Statistical analyses
were performed following the procedure GLM of SPSS (SPSS Inc.
Chicago, Illinois, USA, version 10.0.5). Transformations of the vari-
ables were performed when the necessary condition of homogeneity
of variance was not verified. Tables and figures show always the orig-
inal values. Morphological measurements done before the beginning
of the experiment, height and leaf number were tested as covariates,
in order to avoid misleading due to genetic differences between sap-
lings. Their influence on the factor was always found not significant
in biomass as in labelled C and N distributions. Consequently they
were excluded by the analysis.
3. RESULTS
3.1. Biomass accumulation and seasonal changes
in total-non-structural carbohydrates concentration
Total plant biomass increased about 6 times from March to
August 1997 in labeled saplings (Tab. I). About 45% of the
plant biomass corresponded to coarse roots. Leaves (20%),
coarse roots (45%) and stem (17%): plant ratios remained
unchanged with time indicating a proportional biomass increase
of these organs along the experiment. The same was not true
for fine roots, which proportion to total plant biomass decreased
from 18 to 8% between January and August and consequently
also total root: plant ratio decreased significantly from March
to August. The importance of wood in plant biomass increased
with time reaching 30% in August as a consequence of branch
growth.
Coarse roots had the highest concentration in total non-
structural carbohydrates (TNC) (about 20% of total C) (Tab. II)
followed by stem (16%), leaves (13%) and branches (11%).
Starch and TNC concentrations and starch/TNC ratio were
never significantly different in the analysed plant parts (leaves,
branches, stem and coarse roots). Only first year leaves showed
in March a temporary decrease in starch concentration. This
decrease affected the starch/TNC ratio but not TNC concentration.
3.2. Seasonal changes in C and N concentration
and C:N ratio
In March C concentration and the C:N ratio (Tab. III) were
higher in first year than in second year leaves. (t-test, respec-
tively P < 0.01 and P < 0.05). In first year leaves C concentra-
tion was constant along the experiment whereas in second year
leaves it increased from March to August. As a consequence,
at the end of the experiment, no more differences were appre-
ciated between leaves of different age.
RSA
C
A
labeled sample
% A
unlabeled sample
%–
A
labeled source
% A
unlabeled source
%–
=
P
winter C
%
winter C
part
winter C
plant
100×=
724 S. Cerasoli et al.
N concentration decreased in both first year and second year
leaves from March to August. The decrease was greater in the
first year than in second year leaves. As a consequence, in
August, second year leaves had higher N concentration than
first year leaves (t-test, P < 0.05). The simultaneous increase
in C and decrease in N concentration from March to August in
second year leaves led to an increase of the C:N ratio in this
period. In first year leaves, similar changes in the C:N ratios
during the same period were only the consequence of the lower
N concentration observed in August.
In stem, coarse and fine roots N concentration decreased
from March to August. The C:N ratio was significantly higher
at the end of the experiment in stem and coarse roots, while in
fine roots a marked variability did not allow to distinguish sig-
nificant differences among harvests. The decrease observed in
N concentration in all plant parts at the August harvest led to
a decrease of N concentration in the whole plant and to a con-
sequent increase of the C:N ratio.
3.3. Seasonal changes of the relative specific allocation
of C and N assimilated the previous winter
From January to August, both RSA
C
and RSA
N
decreased
(Tab. IV) as a consequence of continuous assimilation of new
Table I. Biomass of different plant parts of cork oak saplings, of the whole plant and the ratios of parts to the whole plant (%). Values are the
average of 6 replicates ± one standard error. Different letters in the same line indicate significant differences to a One-way ANOVA (P < 0.05)
within the same plant part or ratio.
Part January March August
1st year leaves 0.98 ± 0.20 a 1.28 ± 0.19 a 0.75 ± 0.15 a
2nd year leaves 0.56 ± 0.16 a 7.64 ± 1.76 b
Branches (g) 6.38 ± 1.65
Stem (g) 0.67 ± 0.13 a 1.22 ± 0.21 a 8.49 ±1.11 b
Coarse root (g) 1.83 ± 0.29 a 3.97 ± 0.75 a 22.00 ± 1.69 b
Fine root (g) 0.78 ± 0.18 a 1.73 ± 0.22 b 4.02 ± 0.55 c
Plant (g) 4.26 ± 0.71 a 8.77 ± 1.23 a 49.28 ± 5.76 b
Stem:plant ratio (%) 16.55 ± 2.00 a 14.05 ± 1.33 a 17.45 ± 2.05 a
Coarse root:plant ratio (%) 44.58 ± 1.73 a 44.19 ± 2.44 a 45.96 ± 3.02 a
Fine root:plant ratio (%) 17.61 ± 2.30 a 20.04 ± 0.92 a 8.08 ± 0.36 b
Leaves:plant ratio (%) 21.26 ± 1.18 a 21.71 ± 1.46 a 16.33 ± 1.90 a
Wood:plant ratio (%) 16.55 ± 2.00 a 14.05 ± 1.33 a 29.63 ± 3.03 b
Root:plant ratio (%) 62.19 ± 2.44 a 64.24 ± 1.93 a 54.04 ± 3.10 b
Table II. Starch, Total-non-structural carbohydrates (TNC) concentration, expressed as the percentage of C in the carbohydrate per total C,
and the ratio starch/TNC (%) in 1st and 2nd year leaves, branches, stem and coarse roots in two-year-old cork oaks. Each value is the average
of six replicates ± one standard error. Different letters in the same line means significant differences to a one-way ANOVA among harvests
(P < 0.05).
Part January March August
1st year leaves Starch 5.11 ± 0.33 a 3.54 ± 0.23 b 4.78 ± 0.56 ab
TNC 14.47 ± 0.83 a 12.95 ± 1.27 a 13.08 ± 0.43 a
Starch/TNC 35.32 ± 1.32 a 28.38 ± 2.28 b 36.43 ± 2.42 a
2nd year leaves Starch 4.89 ± 0.47 a 4.65 ± 0.37 a
TNC 15.03 ± 1.71 a 13.16 ± 1.37 a
Starch/TNC 32.75 ± 0.90 a 35.64 ± 2.50 a
Branches Starch 7.10 ± 0.70
TNC 11.37 ± 0.68
Starch/TNC 61.97 ± 2.86
Stem Starch 9.96 ± 1.69 a 10.11 ± 0.85 a 11.47 ± 1.00 a
TNC 14.80 ± 1.88 a 14.80 ± 1.15 a 15.96 ± 1.05 a
Starch/TNC 66.64 ± 4.99 a 68.16 ± 1.66 a 71.71 ± 3.89 a
Coarse root Starch 19.75 ± 0.66 a 19.26 ± 1.95 a 20.83 ± 3.09 a
TNC 24.16 ± 0.67 a 22.59 ± 2.27 a 25.78 ± 3.52 a
Starch/TNC 81.90 ± 2.75 a 85.26 ± 1.45 a 80.04 ± 1.39 a
Remobilisation of stored C and N in cork oak 725
C and N, since RSA depends on the turnover rate of an element
in the plant.
In first year and second year leaves, both RSA
C
and RSA
N
decrease from January to August in a parallel way and the ratio
of the two was always constant. The same was true for coarse
and fine roots, despite the decrease observed in RSA
C
was sig-
nificant only between March and August. In stem and in the
whole plant, from March to August, the decrease in RSA
C
was
steeper than that in RSA
N
resulting in a significant decrease in
the ratio of the two.
3.4. Seasonal changes in content and partitioning
of winter C and N in plants
Winter C and N represent the amount of C and N assimilated
during labeling time, part of which accumulated as storage. The
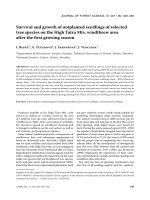
amount of winter C decreased gradually in first year leaves
from January to August (Fig. 1), whereas total C content did
not change significantly. From March to August, a decrease in
the amount of winter C was also observed in fine roots. In other
plant parts (second year leaves, stem and coarse roots), winter C
was constant throughout the harvests. In branches the amount
of winter C was very small: about 50 times lower than in the
whole plant. Despite the decrease observed in August in first
year leaves and fine roots, the winter C of the whole plant was
not significantly different among harvests.
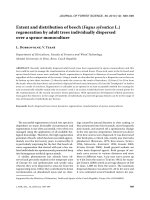
Both winter and total N decreased strongly from March to
August in first year leaves (Fig. 2). In second year leaves, stem,
coarse roots, and in the whole plant, winter N was constant
among the harvests, whereas total N increased continuously. In
fine roots, winter N decreased markedly from March to August
whereas total N remained constant.
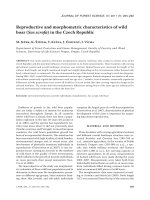
The pattern of carbon partitioning among organs was differ-
ent in August (when the seasonal shoot growth flush was com-
pleted) as compared to previous harvests (Fig. 3A): partitioning
of C to wood (stem + branches) was increased, whereas root C
partitioning decreased. Also N partitioning increased in August
in wood as compared to previous harvests (Fig. 3B). Both win-
ter C and winter N partitioning did not change throughout the
harvests (Figs. 3C and 3D).
Table III. Carbon (C) and Nitrogen concentration (N) and the ratio of the two (C:N) in different plant parts and in the whole plant. Values are
the average of 6 replicates ± one standard error. Different letters in the same line means significant differences to a One-way ANOVA among
harvests (P < 0.05). Differences between leaves of different age were tested at each harvest by a t-test (see Results). Plant values are weighted
averages of all analysed parts.
Part
Carbon (%) Nitrogen (%) C:N
January March August January March August January March August
1st year leaves 50.03 ± 0.54 a 49.89 ± 1.06 a 48.54 ± 0.29 a 2.35 ± 0.14 a 2.42 ± 0.09 a 1.48 ± 0.12 b 21.66 ± 1.30 a 20.73 ± 0.85 a 34.03 ± 3.08 b
2nd year leaves 43.43 ± 0.89 a 48.72 ± 0.34 b 2.40 ± 0.06 a 1.82 ± 0.09 b 18.14 ± 0.68 a 27.18 ± 1.56 b
Branches 45.91 ± 0.22 1.06 ± 0.08 44.37 ± 3.21
Stem 47.91 ± 0.69 a 45.87 ± 1.28 a 45.56 ± 0.39 a 1.45 ± 0.07 ab 1.99 ± 0.20 a 1.02 ± 0.13 b 39.77 ± 7.01 ab 24.12 ± 2.21 a 47.86 ± 5.05 b
Coarse Roots 46.87 ± 0.49 ab 48.83 ± 0.99 a 46.06 ± 0.37 b 1.73 ± 0.17 a 1.99 ± 0.21 a 1.07 ± 0.11 b 28.54 ± 2.85 a 25.94 ± 2.87 a 45.25 ± 4.87 b
Fine roots 47.20 ± 1.30 ab 50.66 ± 0.98 a 46.22 ± 1.14 b 1.91 ± 0.17 a 1.99 ± 0.13 a 1.21 ± 0.13 b 25.54 ± 2.04 a 26.04 ± 1.96 a 42.37 ± 9.49 a
Plant average 47.79 ± 0.66 ab 48.61 ± 0.33 a 46.47 ± 0.25 b 1.84 ± 0.10 a 2.08 ± 0.13 a 1.19 ± 0.09 b 26.68 ± 1.32 a 23.78 ± 1.46 a 40.09 ± 3.10 b
Table IV. Carbon (RSA
C
) and nitrogen (RSA
N
) relative specific
allocation and the ratio of the two (RSA
C
/RSA
N
) measured in diffe-
rent plant parts and in the whole plant. Each value is the average of
six replicates ± one standard error. Different letters in the same line
indicate significant differences to a one-way ANOVA (P <0.05).
RSA
C
(%)
Part January March August
1st year leaves 22.18 ± 3.90 a 11.55 ± 2.98 ab 7.80 ± 2.00 b
2nd year leaves 9.04 ± 2.74 a 1.90 ± 1.13 b
Branches 0.23 ± 0.05
Stem 15.82 ± 1.83 a 11.11 ± 0.97 a 1.26 ± 0.35 b
Coarse root 10.25 ± 2.24 a 6.27 ± 0.90 a 1.04 ± 0.24 b
Fine root 13.34 ± 1.96 a 8.91 ± 2.11 a 1.10 ± 0.34 b
Plant 14.22 ± 1.71 a 8.76 ± 0.80 a 1.20 ± 0.31 b
RSA
N
(%)
Part January March August
1st year leaves 53.61 ± 3.56 a 29.09 ± 1.41 b 17.48 ± 3.39 c
2nd year leaves 51.21 ± 3.35 a 8.65 ± 1.69 b
Branches 4.71 ± 0.29
Stem 70.08 ± 1.25 a 32.35 ± 1.36 b 9.72 ± 1.16 c
Coarse root 70.99 ± 1.29 a 36.85 ± 2.08 b 11.15 ± 0.65 c
Fine root 67.80 ± 3.35 a 26.11 ± 1.45 b 5.96 ± 1.02 c
Plant 66.47 ± 1.96 a 33.87 ± 1.11 b 9.31 ± 0.69 c
RSA
C
/RSA
N
Part January March August
1st year leaves 0.41 ± 0.06 a 0.38 ± 0.09 a 0.42 ± 0.08 a
2nd year leaves 0.19 ± 0.06 a 0.18 ± 0.08 a
Branches 0.05 ± 0.01
Stem 0.23 ± 0.03 ab 0.34 ± 0.03 a 0.12 ± 0.03 b
Coarse root 0.14 ± 0.03 a 0.17 ± 0.02 a 0.09 ± 0.02 a
Fine root 0.19 ± 0.02 a 0.34 ± 0.08 a 0.19 ± 0.05 a
Plant 0.21 ± 0.02 ab 0.26 ± 0.02 a 0.13 ± 0.03 b
726 S. Cerasoli et al.
4. DISCUSSION
4.1. Winter C and N internal mobilization
Contents of winter C and N of two-year-old cork oak plants
did not decrease significantly from harvest to harvest, indicat-
ing that saplings kept C and N assimilated during the previous
winter. This result suggests also that respiration does not use
stored C but rather more recent assimilates and that winter C
and N losses due to senescence or roots exudation did not occur
or was negligible in comparison to the whole plant pool.
Winter C and N were found in organs developed after labeling:
second year leaves, fine roots and branches, demonstrating that
internal mobilization of winter stored C and N occurred. How-
ever the allocation of winter C and N to branches was much
lower than to any other plant part. Time differences observed
in growth of leaves and branches led to differences in the use
of both reserves and new assimilates by these organs. Particu-
larly, our results showed that spring leaves used more reserves
for their growth than branches formed later in the season. No
important mobilization was observed from stem or coarse
roots, confirming that cork oak behave mainly as an evergreen
plant [5, 19] mobilizing storage more from leaves than from
perennial organs, in spite of the relatively short leaf duration
(ca. one year) as compared to other evergreens [23].
4.2. Sources and sinks for winter C and N
First year leaves showed a decrease in the amount of winter
N in August just before senescence. A withdrawal of leaf
reserves before their fall was already demonstrated for N in the
Mediterranean evergreen Quercus ilex L. [26]. Our results
showed also a decrease of winter C from January to August in
first year leaves. Since both starch and the starch/TNC concen-
trations did not decrease from March to August in first year
leaves, the results suggest that the eventual loss of winter C in
the form of carbohydrates was compensated by the accumula-
tion of new carbohydrates in this period. At the same time the
remobilisation of winter N from first year leaves suggests that
hydrolysis of storage proteins and export of amino acids may
have occurred [29].
An export of winter C and N was also observed from fine
roots. The explanation for such a result should consider that the
ratio fine root: plant biomass decreased from March to August
suggesting that fine roots were subjected to a fast turnover [14].
So, similarly to what happens in first year leaves, cork-oak fine
roots export C and N before dying, as was already observed in
the evergreen Sitka spruce (Picea sitchensis (Bong.) Carr.) [7].
Despite the changes observed throughout the year in winter C
and N, their partitioning among the main classes of organs
(leaves, wood and roots) was never markedly different along
the experiment. Such a result suggests that, in cork oak sap-
lings, the flow of C and N from source to sink organs operates
preferentially within the shortest source-sink distance, from
first year leaves to new leaves, from stem to branches and from
old fine roots to growing roots. Evidences for N translocation
from old to new leaves were already found in conifers [19] as
well as in broadleaf evergreens such as Eucalyptus globulus
Labill. [32].
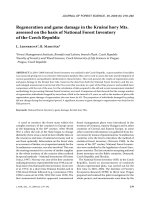
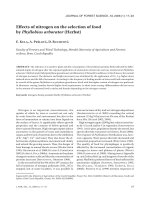
Figure 3. Total C (A), total N (B), winter C (C) and winter N (N) partitioning among leaves, wood and root. Each Value is the average of six
replicates. Different letters for the same part indicate significant differences to a One-Way ANOVA among harvests.
Remobilisation of stored C and N in cork oak 727
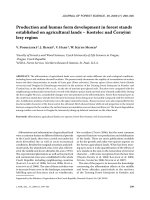
Figure 1. Total (open bars) and winter (closed bars) carbon in first
and second year leaves, branches, stem, coarse and fine roots and in
the whole plant. Each value is the average of six replicates. Different let-
ters indicate significant differences to a One-way ANOVA (P < 0.05)
among harvests.
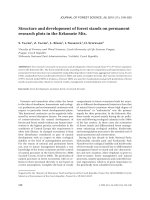
Figure 2. Total (open bars) and winter (closed bars) nitrogen in first
and second year leaves, branches, stem, coarse and fine roots and in
the whole plant. Each value is the average of six replicates. Different let-
ters indicate significant differences to a One-way ANOVA (P < 0.05).
728 S. Cerasoli et al.
4.3. Recent assimilates mobilisation and changes
in starch pool
Our results show that new assimilates cooperated with
reserves to sustain the seasonal flush growth of cork oak sap-
lings. N partitioning in leaves did not show any change along
the experiment, whereas a decrease was observed in total N
content in old leaves in August. These results suggest that not
only winter N but also recently assimilated N were withdrawn
from old to spring leaves before their fall.
Only at the beginning of the growth flush, in March, the
decrease in the ratio starch/TNC observed in first year leaves
suggests a trend to export photoassimilates from old to new
leaves, as sucrose is the preferred form for the transport of car-
bohydrates within the plant [15]. The last result suggests that
remobilisation of C from old to new leaves is more dependent
on the presence of strong sinks, like new developing leaves than
on leaf senescence. In any other part plant (stem, branches and
coarse root) our results show no significant changes in starch
and TNC concentration among harvests. Anyway, the time gap
between harvests was quite big and did not allow excluding that
a temporary decrease in TNC amount or in the ratio starch/TNC
occurred. Anyway, if this is the case, TNC availability was
shortly re-established.
4.4. Carbon/Nitrogen equilibrium
The metabolisms of C and N in the plant are strictly inter-
dependent [9]. As a consequence both C and N storage will be
mobilized when necessary to support new growth. In our exper-
iment we observed that C and N reallocation proceeded in a par-
allel way as the ratio RSA
C
/RSA
N
was practically constant
along the experiment. Similarly, the partitioning of winter C
and N and the partitioning of the whole C and N in the plant
proceeded in a very similar way. As a consequence our results
suggest an equilibrate utilization of storage for both C and N
at the whole plant level under non-limiting conditions for their
assimilation. Obviously different experimental conditions could
influence results. For example, in Sitka spruce (Picea sitchensis
(Bong.) Carr.), it was demonstrated that trees grown at low N
conditions remobilised a bigger proportion of N from roots than
trees grown at high N conditions [18], affecting nitrogen par-
titioning.
Our results show the importance of pre-existing leaves for
the spring growth flush of cork oak plants. In the Mediterranean
type of climate an important pulse of nutrient availability may
occur in autumn when litter accumulated throughout the sum-
mer decomposes with the first rains. Cork oak, as other ever-
green trees, may use this pulse of nutrient availability for uptake
and storage with existing foliage acting as reservoirs. Together
with the possibility of assimilating C in winter (when water is
available in the Mediterranean climate), this pattern of storage
and use may be one of the advantages of this species in keeping
older leaves until the new foliage is completely developed.
Acknowledgments: Authors are indebted to the last Eliane Deléens
(IBP- Paris, France) for her help in the design of the labeling experi-
ment. This project was funded by the Portuguese government through
FCT (GGPXXI/BD/976 and SFRH/BPD/14603/2003).
REFERENCES
[1] Carvalho P.O., Ciclo interno do azoto em árvores, Ph.D. thesis,
Departamento de Engenharia Florestal, Instituto Superior de Agro-
nomia, Lisbon, 1997.
[2] Chapin I.F.S., Schulze E.D., Mooney H.A., The ecology and econo-
mics of storage in plants, Annu. Rev. Ecol. Syst. 21 (1990) 423–447.
[3] Deléens E., Cliquet J.B., Prioul J.L., Use of
13
C and
15
N plant label
near natural abundance for monitoring carbon and nitrogen partitio-
ning, Aust. J. Plant Physiol. 21 (1994) 133–146.
[4] Dickson R.E., Carbon and nitrogen allocation in trees, Ann. Sci.
For. 46 (1989) 631–647.
[5] Egger B., Einig W., Schlereth A., Wallenda T., Magel E., Loewe
A., Hampp R., Carbohydrate metabolism in one- and two-year-old
spruce needles, and stem carbohydrates from three months before
until three months after bud break, Physiol. Plant. 96 (1996) 91–
100.
[6] Escudero A., Del Arco J.M., Sanz I.C., Ayala J., Effects of leaf lon-
gevity and retranslocation efficiency on the retention time of
nutrients in the leaf biomass of different woody species, Oecologia
90 (1992) 80–87.
[7] Ferrier R.C., Alexander I.J., Internal redistribution of N in Sitka
spruce seedlings with partly droughted root systems, For. Sci. 62
(1991) 861–869.
[8] Fialho C., Lopes F., Pereira H., The effect of cork removal on the
radial growth and phenology of young cork oak trees, For. Ecol.
Manage. 141 (2001) 251–258.
[9] Foyer C.H., Ferrario S., Noctor G., Interactions between carbon and
nitrogen metabolism, in: Lea P.J., Morot Gaudry J.F. (Eds.), Plant
Nitrogen, Springer-Verlag, Berlin, 2001, pp. 237–254.
[10] Gholz H.L., Cropper W.P.J., Carbohydrate dynamics in mature
Pinus elliottii var. elliottii trees, Can. J. For. Res. 21 (1991) 1742–
1747.
[11] Lacointe A., Kajji A., Archer P., Frossard J.S., Mobilization of car-
bon reserves in young walnut trees, Acta Bot. Gallica 4 (1993) 435–
441.
[12] Lacointe A., Sauter J.J., Ameglio T., Harms U., Pellicer V., Frossard
J.S., Carbohydrate and protein reserves in trees, in EUROSILVA –
Contribution to Forest Tree Physiology, INRA, Dourdan, 1994.
[13] Legaz F., Serna M.D., Primo-Millo E., Mobilization of the reserve
N in citrus, Plant Soil 173 (1995) 205–210.
[14] López B., Sabaté S., Gracia C.A., Fine-root longevity of Quercus
ilex, New Phytol. 151 (2001) 437–441.
[15] Magel E., Einig W., Hampp R., Carbohydrates in trees, in: Gupta
A.K., Kaur N. (Eds.), Carbohydrate reserve in plants – synthesis and
regulation, Elsevier Science, 2000, pp. 318–336.
[16] Maillard P., Guehl J.M., Muller J.F., Gross P., Interactive effects of
elevated CO
2
concentration and nitrogen supply on partitioning of
newly fixed
13
C and
15
N between shoot and roots of pedunculate
oak seedlings (Quercus robur), Tree Physiol. 21 (2001) 163–172.
[17] Millard P., Proe M.F., Leaf demography and the seasonal internal
cycling of nitrogen in sycamore (Acer pseudoplatanus L.) seedlings
in relation to nitrogen supply, New Phytol. 117 (1991) 587–596.
[18] Millard P., Proe M.F., Storage and internal cycling of nitrogen in
relation to seasonal growth of Sitka spruce, Tree Physiol. 10 (1992)
33–43.
[19] Nambiar E.K.S., Fife D.N., Growth and nutrient retranslocation in
neeedles of radiata pine in relation to nitrogen supply, Ann. Bot. 60
(1987) 147–156.
[20] Oliveira G., Martins-Loucao M.A., Correia O., Catarino F.,
Nutrient dynamics in crown tissues of cork-oak (Quercus suber L.),
Trees-Struct. Funct. 10 (1996) 247–254.
[21] Parry M., Assessments of potential effects and adaptations for cli-
mate change in Europe – The Europe Acacia project, European
Commission: University of East Anglia, UK, 2000.
[22] Pellicer V., Guehl J.M., Daudet F.A., Cazet M., Riviere L.M.,
Maillard P., Carbon and nitrogen mobilization in Larix × eurolepis
Remobilisation of stored C and N in cork oak 729
leafy stem cuttings assessed by dual
13
C and
15
N labeling: rela-
tionships with rooting, Tree Physiol. 20 (2000) 807–814.
[23] Pereira J.S., Beyschlag G., Lange O.L., Beyschlag W., Tenhunen
J.D., Comparative phenology of four Mediterranean shrub species
growing in Portugal, in: Tenhunen J.D., Catarino F.M., Lange O.L.,
Oechel W.C. (Eds.), Plant response to stress, Springer-Verlag, Ber-
lin, 1987, pp. 503–514.
[24] Picon C., Ferhi A., Guehl J.M., Concentration and δ
13
C of leaf car-
bohydrates in realtion to gas exchange in Quercus robur under ele-
vated CO
2
and drought, J. Exp. Bot. 48 (1997) 1547–1556.
[25] Piispanen R., Saranpää P., Variation of non-structural carbohydra-
tes in silver birch (Betula pendula Roth) wood, Trees 15 (2001)
444–451.
[26] Rapp M., Santa Regina I., Rico M., Antonio-Gallego H., Biomass,
nutrient content, litterfall and nutrient return to the soil in Mediter-
ranean oak forests, For. Ecol. Manage. 119 (1999) 39–49.
[27] Robert B., Caritat A., Bertoni G., Vilar L., Molinas M., Nutrient
content and seasonal fluctuations in the leaf components of cork-
oak (Quercus suber L.) litterfall, Vegetatio 122 (1996) 29–35.
[28] Robyt J.F., White B.J., Biochemical techniques. Theory and prac-
tice, Waveland Press, 1990.
[29] Sauter J.J., Van Cleve B., Seasonal variations of amino acids in the
xylem sap of “Populus × canadensis” and its relation to protein
body mobilisation, Trees (1992) 26–32.
[30] Tagliavini M., Millard P., Quartieri M., Storage of foliar-absorbed
nitrogen and remobilization for spring growth in young nectarine
(Prunus persica var. nectarina) trees, Tree Physiol. 18 (1998) 203–
207.
[31] Vivin P., Martin F., Guehl J.M., Acquisition and within-plant allo-
cation of
13
C and
15
N in CO
2
- enriched Quercus robur plants, Phy-
siol. Plant. 98 (1996) 89–96.
[32] Wendler R., Carvalho P.O., Pereira J.S., Millard P., Role of nitro-
gen remobilization from old leaves for new leaf growth of Eucalyp-
tus globulus seedlings, Tree Physiol. 15 (1995) 679–683.
[33] Witt W., Sauter J.J., Starch metabolism in poplar wood ray cells
during spring mobilization and summer deposition, Physiol. Plant.
(1994) 9–16.
To access this journal online:
www.edpsciences.org