Báo cáo lâm nghiệp: "Predicting solar radiation transmittance in the understory of even-aged coniferous stands in temperate forests" ppt
Bạn đang xem bản rút gọn của tài liệu. Xem và tải ngay bản đầy đủ của tài liệu tại đây (996.58 KB, 13 trang )
629
Ann. For. Sci. 61 (2004) 629–641
© INRA, EDP Sciences, 2004
DOI: 10.1051/forest:2004061
Original article
Predicting solar radiation transmittance in the understory
of even-aged coniferous stands in temperate forests
Gabriela SONOHAT
a
, Philippe BALANDIER
a
*, Felix RUCHAUD
a,b
a
Cemagref, Clermont-Ferrand Regional Centre, Team of Applied Ecology of Woodlands, 24 av. des Landais, BP 50085, 63172 Aubière Cedex, France
b
Present address: ONF, Agence départementale de l’Allier, Les Portes d’Arvernes, rue de la République, BP 1722, 03017 Moulins Cedex, France
(Received 30 January 2003; accepted 3 September 2003)
Abstract – The amount of transmitted light in the understories of forest stands affects many variables such as biomass and diversity of the
vegetation, tree regeneration and plant morphogenesis. Therefore, its prediction according to main tree or stand characteristics, without the need
for difficult and costly light measurements, would be most useful for many different users and scientists. Transmitted global solar radiation was
measured using tube solarimeters in the understories of 204 plots of even-aged coniferous stands of four species (Pseudotsuga menziesii, Picea
abies, Larix sp. and Pinus sylvestris) in a wide range of ecological and management conditions in the temperate climate zone. From these data,
a range of simple models based on the Beer-Lambert law was built and fitted to predict mean stand radiation transmittance from basic stand
traits and management features: stand basal area, stand age, time since last thinning, and last thinning intensity. Forest managers can use it to
predict understory light availability and adapt their silviculture to various objectives.
coniferous forest / solar radiation / model / basal area / stand management
Résumé – Simulation de l’éclairement relatif dans le sous-bois de peuplements réguliers de conifères en forêts tempérées. La quantité
de lumière disponible dans le sous-bois des forêts affecte de nombreux processus tels que la production de biomasse et la diversité de la
végétation, la régénération des arbres et la morphogénèse des plantes. Prédire cette quantité sans avoir à effectuer de mesures de lumière
délicates et coûteuses serait donc d'un grand intérêt pour différents utilisateurs et chercheurs. Le rayonnement solaire global transmis a été
mesuré avec des solarimètres dans le sous-bois de 204 parcelles de peuplements réguliers de quatre espèces de conifère (Pseudotsuga menziesii,
Picea abies, Larix sp. et Pinus sylvestris) dans diverses conditions écologiques et de gestion en climat tempéré. A partir de ces données et en
utilisant le formalisme de la loi de Beer-Lambert, plusieurs modèles ont été bâtis et ajustés simulant la transmission de l'éclairement sous couvert
en fonction des caractéristiques dendrométriques simples des peuplements étudiées et de leur gestion : surface terrière et âge du peuplement,
durée depuis la dernière éclaircie et intensité de celle-ci. Ces outils pourraient être facilement utilisés par les gestionnaires forestiers pour estimer
le niveau d’éclairement sous couvert et ainsi adapter leur sylviculture à divers objectifs.
forêt de conifères / éclairement / modèle / surface terrière / gestion des peuplements
1. INTRODUCTION
Transmitted irradiance to forest understories is a crucial
environmental factor governing many processes such as under-
story microclimate [2, 22], tree regeneration, seedling and tree
survival and growth [9, 31, 34], growth of advance regeneration
[32, 44], biomass allocation and crown morphology [38], spe-
cies succession and diversity [4, 10, 27], soil biological activity
[3, 60], and water and mineral resource use [1, 16]. Also, under-
story transmitted irradiance is a measure of the amount of solar
radiation intercepted by the tree stand canopy, which is directly
linked to dry biomass production (Monteith [40], and later [17,
25, 43], for example). Hence the assessment of available light
in forest understories is important for a better understanding of
a wide range of different processes.
Each process is associated with a specific solar wavelength
domain. Photosynthetically active radiation (PAR) of wave-
length between 400 and 700 nm controls photosynthetic proc-
esses. Plant morphogenesis is driven by the red/far red ratio
(660/730 nm) or the blue-UV-A wavebands [8, 57]. Global
solar radiation over the whole solar spectrum is involved in
energy balance (soil surface and canopy foliage microclimate,
vegetation transpiration, etc.). Wavelengths greater than 780 nm,
PAR and total solar radiation are most often measured in can-
opy studies, with different measuring systems and different
units [7].
* Corresponding author:
630 G. Sonohat et al.
Forest canopies modify the flux density, spatial distribution
and spectral characteristics of incident solar irradiance accord-
ing to the geometric, optical and physiological properties of the
canopy. For the same tree species, radiation transmission through
the canopy can be very different according to stand structure.
The various forest operations, particularly thinning, will mod-
ify radiation transmission, which in turn will modify tree
growth and development along with other processes such as
those involved in plant diversity and soil biology. As transmit-
ted radiation directly controls fundamental processes in the for-
est understory, quantifying this variable is often more efficient
to adapt silvicultural operations to meet different objectives [5],
than the simple knowledge of basal area per se for example.
Solar radiation transmission measurement under a tree can-
opy is not easy and needs accurate equipment and methods,
generally a large number of sensors and can be complicated by
spatial and temporal variability of transmitted radiation [7, 51,
64]. Hence because of their technical complexity, reports of
direct measurements of transmitted solar radiation under forest
stands are scant (e.g. [45, 50, 52, 58, 59]). An easy indirect
method for adequate estimation of canopy transmittance would
thus be a useful tool for scientific and forest management purposes.
Numerous surrogate methods to estimate understory solar
radiation transmittance have been proposed, including empir-
ical or process-based forest light models [56]. Empirical mod-
els relate light behavior to canopy or tree characteristics such
as stand density, crown closure percentage, site index [32, 35],
basal area (e.g. [24, 28]), and combinations of tree size and dis-
tance [11, 30]. These models provide a statistical measure of
the influence of stand or individual tree characteristics on solar
radiation interception, but have limited predictive value for
ecological conditions where data are not available. Theoretically,
process-based radiation models can describe and predict light
regime in any forest stand (e.g., [37] for agroforestry systems),
but the large amount of data required to describe canopy struc-
ture and leaf properties precludes their routine use and most of
them are so complex that they are unusable for practitioners
such as forest managers [51].
A practical compromise is provided by semi-empirical proc-
ess-oriented models, which adjust relationships describing
light behavior as a function of stand traits, based on fundamen-
tal laws for light interception in plant canopies. Most forest
radiation models are included in this class, with a wide range
of stand structure complexity, from even-aged homogeneous
stands (e.g., [20]) to heterogeneous, mixed, uneven-aged ones
(e.g., [15]). More complex models can require a large number
of parameters (e.g., 30 parameters in [67]) or a large amount
of data for spatially explicit or individual-based approaches
(e.g., [15, 18]). Two main assumptions are generally made: the
first one assumes that geometrical and/or physiological stand/tree
characteristics are synthetic indicators of environment-driven
processes, and this makes it possible empirically to replace
unknown ecological mechanisms by canopy trait relationships
(e.g., in [49], site effects are described by a nonlinear allometric
model). The second main assumption is that the light intercep-
tion process is driven by canopy foliage amount, so leaf area
or leaf biomass becomes a model key variable. Consequently,
a preferred empirical approach is to link easy-to-measure stand
characteristics to leaf area, which is difficult to measure directly.
Foliage area is thus expressed as a function of sapwood area,
basal area, stem diameter, tree and crown size, etc. (e.g. [55, 66]).
Our aim was therefore (i) to assess, by direct measurements,
understory radiative environment in coniferous stands of
Douglas fir (Pseudotsuga menziesii (Mirbel) Franco), Norway
spruce (Picea abies (L.) Karsten), larch (Larix decidua Miller,
Larix × eurolepis A. Henry and Larix kaempferi (Lindley) Car-
rière) and Scots pine (Pinus sylvestris L.) in a wide range of
ecological and management conditions in the temperate cli-
mate zone, and (ii) to propose a simple model to predict mean
stand radiation transmittance, founded on basic stand traits and
management features, and therefore easy to use by forest man-
agers. As we were interested in characterizing the light envi-
ronment not only for its PAR component or morphogenetic
effects but also for its energy budget component, we measured
global solar radiation transmittance. We also wanted to char-
acterize mean radiation transmittance under trees at the stand
level and not at a smaller scale.
2. MATERIALS AND METHODS
2.1. Site and stand characteristics
Four coniferous species, Douglas fir (Pseudotsuga menziesii (Mirbel)
Franco), Norway spruce (Picea abies (L.) Karsten), larch (Larix
decidua Miller, Larix × eurolepis A. Henry, and Larix kaempferi
(Lindley) Carrière) and Scots pine (Pinus sylvestris L.) were studied.
Light measurements were carried out in France and Belgium on a total
of 46 stands in different sites; 9 for Douglas-fir, 5 for Norway spruce,
11 for larch and 21 for Scots pine. On these sites, a total of 204 plots
were measured; 54, 41, 49 and 60 for Douglas fir, Norway spruce, larch
and Scots pine respectively. Sites presented well-contrasted ecologi-
cal, and climatologic characteristics, with latitude ranging between
45° N and 50° N, and altitude between 145 m and 1250 m. According
to measurement dates and site latitude, solar elevation at noon ranged
between 45° and 68°. The stands also had different age and thinning
histories. Stands were all even-aged and generally monospecific. None
contained more than 20% of trees of other species. Analysis was thus
possible by species.
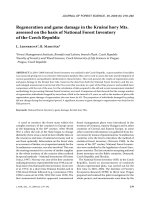
Frequency distributions of main stand characteristics are shown in
Figure 1, giving the validity range of this study. Stand ages ranged
from 18 to 31, 20 to 36, 10 to 92 and 22 to 96 years for respectively
Douglas fir, Norway spruce, larch and Scots pine. Only larch and Scots
pine had stand ages above 50 years; 7 stands for larch (at the same age
of 92 years) and 20 stands for Scots pine, i.e., a proportion of 13% of
all the stands studied.
The stands were not all thinned. For stands that were thinned (42
for Douglas fir, 37 for Norway spruce, and 28 for larch, thus 107 stands
in total), the time since last thinning ranged between 1 and 15 years,
with a sharply decreasing frequency for the highest values. Only two
old larch stands presented a value of 31 years for time since last thin-
ning. No information on Scots pine stand thinning was available, and
so pine was not included in the analysis with this variable.
Thinning intensity (expressed as ratio of basal area decrease to ini-
tial basal area) was available only for 28 Douglas fir stands, 26 Norway
spruce stands and 21 larch stands. 94% of values were grouped
between 0.25 and 0.65 of the stand basal area value before thinning.
2.2. Measurements
2.2.1. Light measurements
Solar irradiation was measured under the canopy of each plot (i.e.,
a surface area between 500 and 1600 m
2
) using tube solarimeters of
Solar radiation in coniferous stand understory 631
length 1.0 m (TSL tube solarimeters, Delta-T devices Ltd, Burwell,
UK). Tube solarimeters measure incoming short-wave radiation
between 300 and 3000 nm, which corresponds to global solar radia-
tion. As we wanted to characterize mean irradiation under trees at the
stand or part-stand level and not at a smaller scale, 1 m long solarim-
eters were more suitable than point sensors as they integrate the local
variations of irradiation. Moreover, when the tree cover is rather het-
erogeneous, linear sensors give better results than point sensors in pre-
dicting mean irradiation [54]. In order to integrate spatial variability,
which can be high (variation coefficient sometimes > 20%, [6, 51]),
4 to 8 sensors were placed in different points of the same stand, and
the measurements were averaged to characterize light environment
under the canopy. As there was also a marked temporal variation of
irradiation for the same point under the canopy during the same day
(and of course during the same season, but we made measurements
only during the leafy season for larch, i.e., from May to September),
we measured irradiance continuously for 24 h in each plot. Simulta-
neously, two tube solarimeters were installed nearby in the open to
measure daily incident global radiation, which was calculated by aver-
aging values measured by the two instruments. Stand solar radiation
transmittance T was calculated as the ratio of daily transmitted solar
irradiation to daily incident solar irradiation. This T value obtained
from measured irradiation values will hereafter be called measured
transmittance. Measured solar radiation transmittance ranged respec-
tively from 0.005 to 0.5, 0.007 to 0.3, 0.03 to 0.64, and 0.15 to 0.81
for Douglas fir, Norway spruce, larch and Scots pine stands. 70% of
transmittance data had values between 0.01 and 0.14 for Douglas fir,
between 0.04 and 0.2 for Norway spruce, between 0.06 and 0.32 for
larch and between 0.21 and 0.55 for Scots pine (see Fig. 1).
2.2.2. Tree measurements and derived stand
characteristics
All the trees around the solarimeters and over a distance of about
one tree height from the solarimeters were measured for their total
height, stem circumference C at breast height (1.30 m), and height of
crown. Stem density n and stand basal area G were then calculated,
as n = N/A and , where N is total stem number and A is
the ground surface area investigated. Stand age was noted for all the
stands, and information on thinning practices was collected when
available. Concerning thinning characteristics, the time since last thin-
ning
τ
and the thinning intensity I were retained for this study. Thin-
ning intensity I is defined in terms of basal area, being equal to the
ratio of absolute G variation (∆G = G
0
– G) against initial value G
0
:
I = ∆G/G
0
.
Basal area ranged from 11 to 66, 18 to 62, 4 to 51 and 4 to 57 m
2
ha
–1
for respectively Douglas fir, Norway spruce, larch and Scots pine
stands. Larch and Scots pine were characterized by a high proportion
of stands with low values of basal area (< 20 m
2
ha
–1
), while Douglas
fir exhibited a greater frequency in the upper range of basal area values
(> 45 m
2
ha
–1
) (see Fig. 1).
2.3. Data treatment and modeling
Influence of diverse stand characteristics, as presented above, on
solar radiation transmittance was assessed using a multiple factor
regression procedure (GLM), with SAS/STAT
®
software [53], for
independent and crossed variable combinations. For the final analysis
we retained the two stand variables that showed the most obvious
effect on stand transmittance for all the stands studied: basal area and
stand age, together with thinning management data: time since last
thinning and last thinning intensity. Simple models shaped on the
Beer-Lambert law for radiation extinction were subsequently proposed
Figure 1. Frequency distributions of main stand characteristics and
of measured transmittance values, by species.
G
i
∑
C
i
2
4πA
=
632 G. Sonohat et al.
to describe light behavior as a function of the factors listed above. The
Beer-Lambert turbid medium approach [39] is widely used for
describing radiation extinction in plant canopies, including forests
(e.g., [16]). Light transmittance under a canopy is expressed as:
(1)
where LAI is the canopy leaf area index, and k is an extinction coef-
ficient, which depends mainly on cover properties. This theoretically
derived law for vegetation canopies assumes that leaves are small and
randomly distributed in the canopy layer, so it can basically be used
for closed homogeneous forest canopies. Deviations from this canopy
pattern can be modeled by correction factors applied to extinction
coefficient k. More generally, extinction coefficient k reflects influ-
ences of all variables other than LAI on light extinction in the canopy,
so it can be expressed as a function of these variables instead of as a
constant value in the basic relation. Assuming stand leaf area index
(LAI) is related to basal area G by a linear unbiased relationship
LAI = aG, the Beer-Lambert law (1) for solar radiation extinction can
be re-written:
= = (2)
where T is canopy transmittance (dimensionless), G stand basal area
(m
2
ha
–1
) and b a coefficient that can be considered as a G–related
extinction coefficient.
Our modeling approach thus consisted in adjusting certain func-
tions to express light extinction coefficient depending on the main var-
iables studied. Correction coefficients were successively defined
through functional relationships for stand characteristics, and the
resulting model improvement was tested. Model parameters were
adjusted using the SAS/STAT nonlinear model (NLM) procedure
[53]. To estimate model sensitivity to parameter variation, the relative
variation of transmittance, dT/T, was calculated for a parameter vari-
ation of 0.1 and typical values of model parameters. A simplified one-
parameter model was finally proposed as a modeling analysis outcome.
To validate this model, a bootstrap method of data random resampling
was applied: on each species data set, 75% of data were used to fit
model parameter, and the model was tested on the remaining 25% of
data. The two sub-samples were obtained by random data sampling,
and the procedure was reiterated 15 times.
3. RESULTS
3.1. ANOVA results
Table I reports multiple factor variance analysis results for
the transmission coefficient as influenced by the four retained
stand characteristics; basal area, stand age, time since last thin-
ning and thinning intensity. Analysis is carried out either on the
whole data set or by species. Basal area was a strong explana-
tory variable for all four species, with 66, 51, 27, and 71% of
the whole transmittance variance explained by this single var-
iable for respectively Douglas fir, Norway spruce, larch and
Scots pine. Depending on the species, the other three variables
added singly or in combination to the basal area sometimes
improved transmittance prediction, sometimes not. Stand age
strongly affected the transmittance in larch stands, more
weakly in Norway spruce and Scots pine stands, and was only
slightly significant in Douglas fir stands. Thinning features
were influential in Douglas fir stands, but less so for Norway
spruce and larch. For the three species with thinning informa-
tion, the models that took into account at least one of the thin-
ning features had the best values of adjusted R
2
.
3.2. Qualitative derivation of the effects
of stand parameters
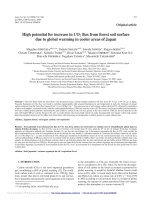
Figure 2 presents light transmittance values plotted against
the main explanatory variable, i.e., stand basal area. For all four
Table I. Fitting of general linear models explaining stand transmittance by the four variables retained for this study, namely basal area (G),
age (A), time since last thinning (τ) and thinning intensity (I). Analysis is performed on the whole data set and by species, and models are clas-
sified by their adjusted R-square values Only basal area G and age A values were available for Scots pine stands.
Total Douglas-fir Spruce Larch Pine
Model Adj-R
2
Model Adj-R
2
Model Adj-R
2
Model Adj-R
2
Model Adj-R
2
GAτ 0.715 Gτ 0.699 GAI 0.586 GAτI 0.540 GA 0.720
GAτI 0.714 GτI 0.691 GAτ I 0.572 GA 0.525 G 0.707
GτI 0.699 GAτ 0.677 GI 0.571 GAτ 0.517 A 0.001
Gτ 0.696 GAτI 0.666 GτI 0.555 GAI 0.515
GAI 0.691 G 0.663 GA 0.540 GI 0.330
GA 0.658 GI 0.648 GAτ 0.528 Aτ I 0.304
GI 0.542 GA 0.639 G 0.513 GτI 0.293
G 0.480 GAI 0.621 Gτ 0.495 Gτ 0.276
τI 0.155 τI 0.274 τ 0.434 G 0.268
AτI 0.152 AτI 0.235 τI 0.427 τI 0.259
Aτ 0.141 I 0.200 Aτ 0.418 I 0.244
t 0.134 AI 0.171 AτI 0.407 AI 0.202
A 0.106 τ 0.048 I 0.143 τ 0.004
I 0.010 A 0.003 A 0.001 A 0.001
Te
–k LAI
=
Te
–k LAI
= e
–k aG
e
–bG
Solar radiation in coniferous stand understory 633
species, the light transmission follows an exponential decreas-
ing function of stand basal area, but the curve parameters are
specific to each species.
For a given basal area, stand age influenced this relationship
by increasing transmission in very young or very old stands (see
aged plots highlighted in Fig. 2). In recently thinned stands,
solar radiation transmission was in many cases greater than for
unthinned stands with a similar basal area, but this difference
decreased as time since thinning increased (data not shown).
Thus the influences of stand age, time since last thinning and
intensity of last thinning on extinction coefficient b (relation-
ship (2)) were further analyzed.
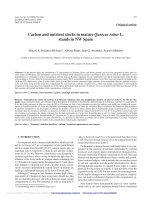
The variations of b according to stand age are shown in
Figure 3. The pattern of the relationship between b and stand
age varied among the four species: Douglas fir values were very
widely spread for a moderate range of ages, and so for this spe-
cies stand age influence on b was not demonstrated. Norway
spruce, larch and Scots pine presented a decreasing trend of b
with increasing stand ages. For larch, b first increased with
stand age and then decreased with older stands. The same trend
was shown qualitatively for Norway spruce, but the increase
at lower ages was not statistically significant. This type of rela-
tionship can be described by an asymmetric three-parameter
function passing through the origin of the axes on the left (as
canopy extinction coefficient is initially equal to zero), and
tending asymptotically to zero to the right of the age axis:
f(x) = ax
p
e
qx
(3)
where a, p and q are parameters. To have parameters with a
practical meaning, we can rewrite relationship (3) using as
parameters the coordinates of the maximum of f(x), which will
be called respectively b
max
and age
max
, with b
max
= f(age
max
).
In this case, a and q can be computed as:
and
and relationship (3) can be written:
(4)
where b
max
, age
max
and p are parameters, and b (age) =
is an age-correcting coefficient for
b
max
, the maximum value of which is equal to 1 when age =
age
max
or parameter p = 0 when no age influence exists. Dashed
curves on Figure 3 represent relationship (4) with parameters
b
max
, age
max
and p fitted from experimental data, by species.
Mathematically, parameter p drives the decreasing rate of
extinction coefficient b with age, on the both sides of age
max
value. Actually, the shape of the relationship (4) depends on p
and also on the ratio p/age
max
. Therefore possible values of
these parameters are correlated (i.e small age
max
values impose
small p values in order to remain in the experimental range of
extinction coefficient b values).
A qualitative analysis of the influences of time since last
thinning (τ) and thinning intensity (I) on extinction coefficient b
showed that coefficient b slightly increased with τ for all species,
decreased with I for Douglas fir, and increased with I for larch.
A simple function that could describe these effects is a two-param-
eter function, with an asymptotic shape according to τ, namely:
(5)
where u and v are parameters, and . This function
is a thinning correction factor equal to 1 when I = 0 or when
. It can be larger or smaller than 1, depending on the sign
of the parameter u.
Figure 2. Stand transmittance as a function of basal area, by species. Fitting curves correspond to the one-parameter negative exponential rela-
tionship (2) and are identified by the initials of the species. Stands older than 50 years are highlighted.
ab
max
e
age
max
p
=
q –
p
age
max
=
b age()b
max
age
age
max
e
1
age
age
max
–
p
b
max
b
age
==
age
age
max
e
1
age
age
max
–
p
b
thinning
1 u∆
G
e
–vτ
+=
∆
G
I
1 I–
=
∞→
τ
634 G. Sonohat et al.
3.3. Assessment of different solar radiation
transmission models
3.3.1. Model 1: one-parameter negative exponential light
extinction model
This is the simplest model accounting for light transmission
under a canopy, using the Beer-Lambert law (2) with extinction
coefficient b constant for a given species.
Results are presented in Table II, fitting curves on Figure 1
and plots of predicted data against measured data in Figure 5a.
The values of the extinction coefficient b are different between
species, ranging from 0.048 for Scots pine to 0.106 for larch
(Tab. II) so larch presented the lowest stand transmittance and
Scots pine the highest at the same basal area values (Fig. 2).
This simple model presented adjusted R-square values
between 0.56 (for Norway spruce) and 0.80 (for Douglas fir),
so explaining much of the irradiance variation in forest stands.
3.3.2. Model 2: age-corrected negative exponential light
extinction model
Instead of taking coefficient b as constant, this model
expresses the extinction coefficient b as a function of stand age,
using relationship (3). Results are presented in Table II and
Figure 5b. The fitting of this model was impossible for Douglas
fir as there was no obvious stand age influence on b values, as
shown before. Moreover, the R-square value decreased for
Douglas fir when applying this model. On the contrary, for Nor-
way spruce, larch and Scots pine the age-corrected model sig-
nificantly enhanced R-square values (Tab. II). As shown in
Figure 3, the curves for b according to stand age can present a
peak at around 20 years (Norway spruce and larch) or decrease
monotonically (when age
max
fitted values are close to 0, as for
Douglas and Scots pine). The values of the parameter p are very
different between species, and model 2 is very sensitive to these
values, as it will be shown below.
3.3.3. Model 3: thinning- and age-corrected negative
exponential light extinction model
As shown above, thinning characteristics had a weak influ-
ence on light regime, and to test the significance of this effect,
transmittance was also expressed as a function of time since last
thinning and the intensity of this thinning:
(6)
with (5), parameters b
max
, age
max
,
p, u and v being fitted from data. Scots pine stands were not
included in this model assessment as no data was available on
thinning for this species. Results are presented in Table II and
Figure 4c. Parameters b
max
, age
max
and p are considerably
modified by this new fitting compared with model 2 for Douglas
fir and larch, while Norway spruce parameter values remain
stable. The u values are negative and v-values are positive for
Douglas fir and Norway spruce, which means that thinned
stands have higher transmittance than unthinned ones at equal
basal area values. Larch presents the opposite behavior, but the
u value is very small, with a large standard error value, and the
R-square value is not enhanced by adding a thinning correction
in comparison with the age-corrected only model. This means
that thinning did not influence the b coefficient in larch.
Figure 3. G-related extinction coefficient b as a function of stand age. Points are values corresponding to individual stands. Squares are mean
values by class age, and bars show standard error values. Dashed lines are fittings of the Model 2b variation with age (see relationship (4)) and
solid lines correspond to Model 3S age correction (relationship (6)). Letters present multiple mean comparison results (SAS/STAT, Student-
Newman-Keuls method): different letters indicate statistically significant differences between means, with mean values decreasing with alpha-
betical order.
T = e
− b
max
b
age
b
thinning
G
b
thinning
1 u∆
G
e
–vτ
+=
Solar radiation in coniferous stand understory 635
3.3.4. Alternative models and/or sets of data
As Douglas fir was only slightly sensitive to stand age and more
sensitive to thinning variables, a simple thinning corrected model
was applied to Douglas fir data . This model
gave an adjusted R
2
of 0.863 and the following parameter val-
ues: b
max
= 0.0956, u = –0.178, v = 0.348 (compare with those
in Tab. II, model 3). This shows that the best R-square values
can be reached by applying only a thinning correction to Doug-
las fir stand data. For Norway spruce, this alternative model
raised R
2
values from 0.556 (model 1) to 0.662, and parameter
values were close to those of model 3 (b
max
= 0.0857, u = –0.235,
v = 0.746). For larch, differences were greater (data not shown),
but larch data did not show significant sensitivity to thinning,
as seen before.
Table II. Estimated values of the parameters of the proposed models, and corresponding adjusted R-square values, by species and for pooled
data. Standard errors and estimated mean standard error respectively are given in brackets. DOU = Douglas fir, SPR = Norway spruce, LAR =
larch, PIN = Pine.
Model
Parameters values
(standard errors in brackets)
Adjusted R – square
(and estimate’s standard error)
DOU SPR LAR PIN DOU
n = 54
SPR
n = 41
LAR
n = 49
PIN
n = 60
All data
n = 204
Model 1
b = 0.0903 b = 0.0788 b = 0.1056 b = 0.0477 0.804 0.556 0.623 0.731 0.824
(0.0027) (0.0021) (0.0059) (0.0020) (0.039) (0.039) (0.099) (0.104) (0.080)
Model 2
with
(dashed lines on Fig. 3)
b
max
= 0.1324
(0.8753)
age
max
= 0.241
(years)
(3.65)
p = 0.0034
(0.1592)
b
max
= 0.0948
(0.0026)
age
max
= 24.40
(years)
(0.56)
p = 7.152
(1.459)
b
max
= 0.1179
(0.0033)
age
max
= 18.13
(years)
(1.05)
p = 1.533
(0.361)
b
max
= 0.0904
(0.0116)
age
max
= 0.04
(years)
(.)
p = 0.0005
(0.0001)
0.786
(0.037)
0.834
(0.027)
0.867
(0.057)
0.776
(0.089)
0.886
(0.061)
Model 3
with
b’
max
= 0.1922
(0.0268)
age’
max
= 0.233
(years)
(.)
p’ = 0.0062
(0.0012
u = –0.310
(0.067)
v = 0.293
(0.169)
b’
max
= 0.0987
(0.0030)
age’
max
= 24.35
(years)
(0.556)
p’ = 6.99
(1.38)
u = –0.236
(0.151)
v = 0.752
(1.022)
b’
max
= 0.1076
(0.0034)
age’
max
= 12.91
(years)
(4.11)
p’ = 0.3215
(0.173)
u = 0.048
(0.043)
v = –0.22
(0.134)
–
–
–
–
–
0.865
(0.036)
0.875
(0.026)
0.865
(0.051)
– 0.894
(0.039)
Model 3S
with
(fitted from measurement data)
(solid lines on Fig. 3)
( for missing thinning data)
age* = 20 years,
b* = 0.0939 b* = 0.0876 b* = 0.1131 b* = 0.0748 0.857 0.728 0.866 0.765 0.880
(0.0031) (0.0024) (0.0028) (0.0097) (0.041) (0.040) (0.058) (0.091) (0.063)
z = 0.00568 z = 0.01161 z = 0.0121 z = 0.0148
(0.0035) (0.0033) (0.0020) (0.0018)
[For comparison, b* values calculated
with model 3 (model 2 for Pine) at age* = 20 years
:
0.1014 0.08303 0.1115
0.0711]
Te
–bG
=
Te
–b
max
b
age
G
=
b
age
age
age
max
e
1
age
age
max
p=
Te
–b
max
′
b
age
′
b
thinning
G
=
b
age
′
age
age
max
′
e
1
age
age
max
′
p
′
=
b
thinning
1 u∆
G
e
ντ–
+=
Te
–b
*
b
age
*
b
thinning
*
G
=
b
*
bage
*
()=
b
age
*
e
τ age age
*
–(
)
–
=
b
thinning
*
10.3∆
G
e
0.5
τ
–
–=
b
thinning
*
1=
b
*
b
10 age 30<<()
=
T = e
− b
max
b
thinning
G
636 G. Sonohat et al.
Model 3 was tested against all the experimental data (Tab. II,
last column) by considering b
thinning
= 1 for stands with una-
vailable thinning data. Unknown possible thinning effects were
thus included in coefficient b variability. Considering only data
where thinning information was available, the number of obser-
vations decreases to n = 42, n = 26 and n = 21 for Douglas fir,
Norway spruce and larch respectively (against n = 54, n = 41
and n = 49 respectively considering all data). Corresponding
adjusted R
2
values are, in this case, 0.724 for model 1 (constant
b values), 0.873 for model 2 (age-corrected values), and 0.918
for model 3 (age and thinning corrected values), which con-
firms model 3 better fitting.
Finally, as stand ages were mainly below 50 years (only 13%
of values were above, mainly from the Scots pine data), models 1,
2 and 3 were fitted and afterwards compared to data corre-
sponding only to age < 50 years. Pooling all species, adjusted
R
2
values were respectively 0.883, 0.909, and 0.914 for models 1,
2 and 3, all greater than those of models fitted with all stand
age data (see Tab. II).
3.4. Sensitivity analysis
Transmittance sensitivity to parameters b
max
, age
max
and p
are presented in Figures 5a, 5b and 5c respectively. The figures
present isolines for dT/T values computed from model 2 and
model 3, as a function of stand age and basal area. Values of
dT/T up to 0.5 are presented, as transmittance T rapidly
decreases with stand basal area (50% of total data amount had
T values less than 15%) and measurement precision is of a few
percent order. Typical parameters values were chosen as fol-
lows: age
max
= 20 years, b
max
= 0.1, p = 1. Figures backround
is representing measured values set, in order to account on real
basal area – age values range.
Figure 5a shows that models 2 and 3 sensitivity against b
max
values is maximal for age = age
max
at the same basal area. It
increases with increasing basal area, but with a lower rate for
advanced ages. For model 1, which does not present age depend-
ence, corresponding sensitivity values are those corresponding
to age
max
value on the abscissa. Figure 5b shows model sensi-
tivity to age
max
, variation, which is greatest around 2 age
max
,
i.e., 40 years for our parameter value set. We can conclude that
models are generally quite stable against variations in both
parameters b
max
and age
max
, except for particular age values
(age
max
, 2 age
max
) and for basal area values above 50 m
2
ha
–1
.
Sensitivity analysis for parameter p (Fig. 5c) was carried out
for an absolute variation of one unit for p, at p = 1. Except for
ages around age
max
, models 2 and 3 show a high sensitivity to
parameter p, a variation of 50 % for transmittance T being
already reached at basal area values of around 20 m
2
ha
–1
. Also,
relative variation of transmittance T increases linearly with p.
Since p values range widely among species (from 0 for pine to
7 for spruce), and also standard errors of estimated p values are
high, the models are unstable against the p parameter.
Concerning u and v, dT/T values always remain less than 0.4 for
all considered age and basal area values, and so model 3 is robust
enough for these parameters (some type of figures, not shown).
3.5. Model 3S: a simplified model
3.5.1. Model 3S derivation
Model 3 presented above, which takes stand age and thin-
ning characteristics into account, yields satisfactory values of
adjusted R
2
. However, estimating five parameters can induce
Figure 4. Comparison between measured and simulated transmit-
tance values for the different models, for data pooled along species.
(4a) for model 1, (4b) for model 2 and (4c) for model 3S fitted on only
data concerning stands with available thinning information.
Solar radiation in coniferous stand understory 637
marked instability in some cases and NLIN procedure conver-
gence could be local in these cases (i.e., strongly dependent on
the values used to initialize the parameters). Thus a simplified
model with fewer parameters would be useful. It will be derived
from some general traits deduced from the previously presented
models.
Concerning the influence of stand age, the general trend is
a fall in b values, beginning at some particular age. Assuming
that the decrease in b begins with an age value age*, then b
decreases asymptotically, and the simplest law for the correc-
tion coefficient is in this case a negative exponential function:
(6)
where z is a parameter to be fitted from the data.
The thinning correction can be considered the same for all
species, deduced from the experimental data for the species that
showed the highest sensitivity to thinning characteristics,
namely Douglas fir and Norway spruce. Approximate means of
u and v values could be considered respectively u = –0.3, and
v = 0.5, so the thinning correction could have the expression:
.(7)
Therefore, from equations (6) and (7), a simplified relation-
ship for light transmittance could be written:
.
The value of b*, can be directly deduced from experimental
data, as the mean of the measured extinction coefficient b cor-
responding to an age class including age*. For example, in this
study, age* = 20 years, and . In this case,
z remains the single parameter to be fitted with a NLIN proce-
dure applied on experimental data.
3.5.2. Model 3S assesment
Results of applying model 3S are presented in Table II and
Figure 4c. The model was applied on all data, and for the stand
with missing information on thinning b*
thinning
was considered
equal to 1. Adjusted R
2
values for model 3S were only slightly
below the best R
2
values obtained with models 2 or 3 for Doug-
las fir, Norway spruce and Scots pine, and the same for larch,
but were better than values obtained with model 1.
The sensitivity of model 3S to parameter z was assessed
using the same procedure as described above. Values of dT/T
are all less than 0.4 for all age and basal area values, so model 3S
can be considered stable enough against parameter z (data not
shown).
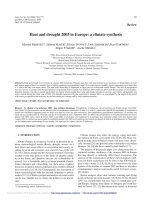
3.5.3. Model 3S simulation and validation
Figure 6 presents some simulations of model 3S for age* =
20 years and two thinning situations (no thinning and thinning
three years previously at intensity I = 0.5), and two b* values
(0.11 and 0.08). For a given basal area, thinning induces an
increase of transmittance values. Transmittance increases also
with age, and with a lower extinction coefficient b*. Differ-
ences between transmittance values can be very marked for
basal area values greater than 10 m
2
ha
–1
. For example, T varies
from 5% to more than 40% between stands aged 20 years and
80 years at a 20 m
2
ha
–1
basal area. Table III presents averages
and variation coefficients CV for z values obtained from ran-
domly sampled subsets of data (as presented in Materials and
Figure 5. Sensitivity analysis of models 2 and 3, for parameters b
max
,
age
max
, and p. Figures show relative variation of transmittance dT/T
for a relative variation of 0.1 for b
max
(Fig. 5a), and age
max
(Fig. 5b),
and for an absolute variation of one unit for parameter p (Fig. 5c), at
typical parameter values of b
max
= 0.1, age
max
= 20 years, and p = 1.
Lines are isolines of dT/T values, as a function of basal area (G) and
stand age. Legend identifies 0.0, 0.5 and –0.5 isolines, and between
these values dT/T variation is monotonic. Grey diamonds in the back-
ground are the experimental points. Figure 5a presents also the sen-
sitivity analysis of model 1 for b
max
parameter, i.e. at age equals
20 years (the typical age
max
value chosen for this analysis).
b
age
*
e
–z age age
*
–()
=
Table III. Analysis of model 3S robustness and predictivity from
randomly sampled subsets of data, by species: means of parameter z
(relationship (6)) fitted values, variation coefficients of those values,
and mean standard errors of the model on test data subsets.
Douglas-fir Spruce Larch Pine
0.00595 0.01108 0.01183 0.01523
Variation
coefficient CVr
20.94% 14.64% 7.66% 5.27%
MSE
test
4.91% 1.48% 4.19% 1.83%
Z
b
thinning
*
10.3∆
G
e
–0.5τ
–=
T = e
− b
*
b
age
*
b
thinning
*
G
b
*
b
10 age 30<<()
=
638 G. Sonohat et al.
methods), together with mean standard error averages for test
subsets. CV of z values fitted on data subsets ranged from 5%
to 21%, with the highest values for Douglas fir stands. The
mean standard error of the model applied on test subsets had
averaged values between 2% and 5%.
4. DISCUSSION
This study reports the results of global solar radiation meas-
urements under forest stands of four coniferous species (Doug-
las fir, Norway spruce, larch and Scots pine) and different mod-
els to predict light availability in their understory from easily
measurable tree or stand characteristics. The data sets analyzed
were large, with a total of 204 measurement plots, among which
89 had complete thinning information. This total plot number
was relatively well balanced among the four species. Different
soil and climate conditions were sampled and data covered
stand ages from 10 to 96 years and stand basal area values from
11 to 66 m
2
ha
–1
, for which solar radiation transmittance ranged
between 4 and 81%. The data set was therefore representative
of a large range of coniferous stands for the four species con-
sidered and conditions in the temperate zone. We found no
effect of site richness (soil and climate) on the relationships
between mean relative irradiance and stand basal area. There-
fore, the relationships seem rather insensitive to this factor.
This could be expected because the relationship between the
basal area and the leaf area, which determines the light trans-
mission, is also rather stable.
Concerning tube solarimeters use for measurements, Sattin
et al. [54] showed that the standard error of average transmit-
tance stabilizes with 2 to 3 tube solarimeters for a fairly homo-
geneous canopy with normally distributed transmittance values.
For more heterogeneous covers, with a variation coefficient
greater than 20%, a higher number of tube solarimeters (5 to 6)
is needed [6, 51]. Tube solarimeter geometry allows the inte-
gration of radiation spatial variability over their length of about
1 m and so they give better results than point sensors in pre-
dicting mean transmittance in heterogeneous cover [54], but
they can also be a source of measurement error, depending on
their orientation according to sun course and canopy spatial lay-
out (e.g. [41] for tropical behavior).
As canopy optical properties are different for different wave-
bands, canopy transmittance values also vary according to the
waveband considered; hence caution is necessary when com-
paring results and/or converting between the different wave-
band ranges. Some relationships are available to convert global
radiation into PAR and vice-versa, but although conversion rate
between overstory global radiations and PAR is quite constant,
depending slightly on cloud cover [13, 63], understory trans-
mittance of PAR radiation is lower than global solar radiation
transmittance and the difference depends on canopy closure
and leaf optical properties induced by species, clone, seasonal
development, environmental factors, etc. ([21, 54] for Turkey
oak, [12] for Douglas fir, [29] for Sitka spruce). Therefore, this
type of relationship, though not invalid, must be used with caution.
As in previous works, we found a negative exponential rela-
tionship between light transmittance and stand basal area,
which explained between 56% and 80% of transmittance vari-
ation according to the species, and 82% for all species pooled
data. For a stand age around 73 years, Kuusipalo [33] found that
basal area explained 75% of light transmittance in Norway
spruce and Scots pine for a basal area ranging from 14 to
37 m
2
ha
–1
. Comeau [19] reported a logarithmic relationship
that explained 88% of light transmittance variation in young
aspen (Populus tremuloides Michx.), for basal area between 5
and 40 m
2
ha
–1
. Hale [29] found a similar relationship for pon-
derosa pine (Pinus ponderosa Dougl.) stands. As pointed out
by Hale [29], in some of these studies, for values of basal area
above a specific threshold (from 15 m
2
ha
–1
to 30 m
2
ha
–1
) light
transmittance values became very low and independent of basal
area. Ferment et al. [23] found in a tropical forest few signifi-
cant correlations between light measures and trees basal area
Figure 6. Simulated stand transmittance as a function of basal area, obtained with model 3S for three stand ages (20, 50, and 80 years, as indicated
on the figure). Black lines: b
*
= 0.11. Grey lines: b
*
= 0.08. Solid lines: unthinned stands. Dashed lines: thinning of intensity = 0.5, 3 years ago.
Parameter age
max
was set at 20 years.
Solar radiation in coniferous stand understory 639
within 10 m, possible due to the light extinction induced by
below 10 cm DBH stems. For our measurements, the 10 exper-
imental points with the lowest transmittance values for each
species still showed a good negative correlation (with R-square
values ranging from 0.38 to 0.76) between transmittance and
stand basal area values.
The relationship have an exponential form, following the
Beer-Lambert formalism for light extinction (see Eq. (1)). In
our case we measured transmittance at ground level, i.e. as
influenced by the whole tree LAI. We did not measure LAI in
this study because it is not a variable that is easily accessible
for forest managers. However, a close relationship between the
basal area of a tree and its leaf area has been frequently reported
and used in the “pipe” models [55, 65, 66]. Therefore, it is not
surprising that the variable that accounts for most of the relative
irradiance variability is the basal area.
Other variables added to the basal area can improve the pre-
diction of transmittance, such as tree height, crown height,
crown length/total tree height, height of the first green whorl,
etc. but never to an extent (only a few percent of the variability)
that justifies adding them to the relationships [51]. Exceptions
are stand age and stand thinning characteristics, which
enhanced the basic negative exponential model for solar radi-
ation transmittance, with different behaviors for the four spe-
cies considered. For Douglas fir and Norway spruce the model
was markedly improved by applying both age and thinning cor-
rection, while data concerning larch were not sensitive to thin-
ning correction.
The variations of the G-extinction coefficient b is actually
a combined effect of the variation of LAI-extinction coefficient k
from the Beer-Lambert law and the variation of the slope a
between LAI and basal area G (see relationship (2)). Diverse
studies have dealt with the influence of stand characteristics on
one or another of these coefficients. Sampson and Smith [52]
showed for lodgepole pine (Pinus contorta var. latifolia) that
canopy light extinction coefficient k depends on solar eleva-
tion, canopy LAI, foliage aggregation, average leaf inclination
angle and vertical foliage distribution. They found a negative
correlation between k and cover LAI. Our data also presented
a negative correlation between extinction coefficient b and basal
area G, except for Norway spruce, but this dependency dimin-
ished for age-corrected coefficient b (data not shown). Lower
extinction coefficient b values for pine may indicate clumping
in its foliage. For similar foliage aggregation, differences in
b values could be an indicator of different mean leaf inclination
angle. Black et al. [12] found strong planophile characteristics
for Douglas fir stands. This trend could be coherent with the
higher b values for Douglas-fir found with our data.
Concerning age influence on extinction coefficients, Turner
et al. [61] reported that estimated LAI from basal area meas-
urements was higher than those based on sapwood area in older
Douglas fir stands, which could signify that slope a linking
basal area to actual LAI decreased for old stands. Brown and
Parker [14] reported for mixed species deciduous forests that
k was lowest for youngest stands, increased toward age 50 years
and declined with age in the oldest sites (65–340 years). Porté
et al. [47] reported the slope a of the relationship between crown
foliage area and basal area in maritime pine (Pinus pinaster
Aït.) decreased with stand age. Usolstev and Hoffmann [62]
showed that for Norway spruce, foliage biomass varied with
stand age, with a maximum between 40 and 60 years, while
branch biomass presented an inverse behavior, reaching a min-
imum value at an age about of 50 years. Considering branch
biomass as an expression of trunk size, this leads to an initial
increase of slope a at low ages followed by a decrease with
advanced ages. The above proposed relationship (3) between
extinction coefficient b and stand age can describe not only the
decrease of extinction coefficient at advanced age, but also a
possible increase at low ages to a maximum value. This func-
tion presented the best agreement with experimental data (mod-
els 2 and 3), but was very sensitive to the parameter p, and so
its predictive use is limited to a sufficient data set to calibrate
the model. For example, fitting function (3) was critical in the
case of Douglas fir where data presented few stand age classes.
A simpler function is an asymptotic decrease of the extinction
coefficient with age increase (6). However, its use may be inac-
curate for young ages for species whose extinction coefficient
decreases in their young age.
Correction for extinction coefficient b due to thinning char-
acteristics (stem sampling intensity and time since last thinning)
was important for Douglas fir and Norway spruce. Proposed
relationship (5) can equally describe values higher or less than 1
(depending on the sign of parameter u), and tends to 1 as the
time since last thinning increases. Under the turbid medium
approach for light transmission, this correction can be related
to the clumping coefficient often used to multiply the extinction
coefficient in the Beer-Lambert law to account for foliage
clumping [42]. When u is negative, the thinning correction (5)
is less than 1, which means that transmittance is higher, which
can be explained by a more clumped foliage after thinning than
in unthinned stands. This is realistic as thinned stands present
a heterogeneous canopy with a larger number of gaps immedi-
ately after thinning. A negative value of parameter u can be
obtained particularly when thinning is performed too late, with
a high value of G, which means that tree crowns are limited in
their extension. Consequently, extinction coefficient b decreases
with stand basal area G in unthinned stands and so thinned
stands will initially have the lower b value corresponding to
higher basal area before thinning. Conversely, a positive value
of u would mean, by analogy with the clumping parameter, that
the canopy becomes more regular after thinning. Again this
would be possible, for example, when thinning acts to improve
canopy regularity, and/or trees have a good plasticity and a
structure that changes quickly after thinning. This is the case
for larch, a light-demanding species, and its slightly positive u
parameter value fitted with model 3 may account for these prop-
erties. Similar results have been reported for various species.
For instance, Hale [29] showed that thinning induces a decrease
in extinction coefficient k in ponderosa pine (Pinus ponderosa
Dougl.). Granier [26] found for Douglas fir that the slope
between foliage mass and sapwood basal area did not depend
on age or stocking for unthinned stands, but increased after
stand thinning.
Previous works had also demonstrated the influence of ver-
tical foliage distribution on the canopy extinction coefficient
[14, 52]. Medhurst and Beadle [36] reported for Eucalyptus
nitens that thinning did not affect the relationship between
branch size and branch area, or branch inclination angles, but
vertical leaf distribution of thinned trees was less skewed
640 G. Sonohat et al.
toward the crown top than in unthinned stands, which could
bring about an increase in canopy extinction coefficient k. Among
the stand characteristics that are easiest to measure, total stem
and crown heights could lead to a synthetic variable that could
account for vertical leaf distribution. In this study these varia-
bles had insufficient weight in the general linear model analysis
for stand transmittance to be maintained, so they were not used
in the models proposed above. Nevertheless, it would be inter-
esting to further analyze their effects on the extinction coeffi-
cient b, corrected for age and thinning characteristics in order
to separate the effects of the different variables. A priori, stand
height effects on light transmission should interfere mainly with
age effects, as thinning is reported not to influence height
growth (e.g., Roberts and Long [48], for Abies lasiocarpa).
5. CONCLUSION
This study shows that with a very simple model, needing
only the measurement of stand basal area, forest managers or
scientists can accurately predict mean global solar radiation
transmittance in the understory of even-aged coniferous stands
of Douglas fir, Norway spruce, larch and Scots pine in the tem-
perate climate zone. For a better prediction, stand age, and also
thinning intensity and time since last thinning can be added to
the model. Thus the model explicitly allows to take into account
managing features, which are controlled by the forester How-
ever, for use in new conditions not explored by this study, this full
model needs a large set of data to adjust the different parameters.
The simplified model 3S is easier to adjust, and is more con-
venient for predictive use. Nevertheless, the assumption that
parameters u and v for thinning correction are general may be
critical. It is expected that changes in cover structure after thin-
ning depend on species traits such as mechanical and morpho-
logical plasticity, for example. Further analysis of data sets of
larger size will be necessary to refine this point for thinned
stands. However, the model can still be used by forest managers
to adapt their silvicultural practice to different objectives
according to light requirement, such as tree regeneration, plant
biodiversity, biomass production, etc. [5]. The radiation trans-
mittance model can also be included in more general models
of silviculture, to help adapt silvicultural operations such as
thinning to meet different objectives such as wood production,
wood quality and biodiversity maintenance [46]. Finally, the
model is obviously built with data on coniferous even-aged
stands that are relatively regular and homogeneous. Its appli-
cation to very heterogeneous stands (for instance with very
large gaps or harvesting pathways), uneven-aged stands, or
mixed stands with broad-leaved species is inadvisable until fur-
ther work has been done.
Acknowledgements: The authors thank R. Jouvie, A. Marquier and
F. Landré for their technical contributions in the field. They also thank
D. Pauwels for her help in Belgium. The study was supported by grants
from the Auvergne Region, the Auvergne Regional Directorate of
Agriculture and Forest (DRAF Auvergne) and the European Commu-
nity (FEOGA 5b and FAIR5 – CT 98-3354).
REFERENCES
[1] Aussenac G., La maîtrise du microclimat en plantation, Rev. For.
Fr. 38 (1986) 285–292.
[2] Aussenac G., Granier A., Naud R., Éclaircie systématique dans un
jeune peuplement de Douglas : modifications microclimatiques et
influences sur la croissance, Rev. For. Fr. 36 (1984) 279–288.
[3] Bailly A., Éclaircir les peuplements résineux : un impératif écolo-
gique, AFOCEL-ARMEF, Informations-Forêt 4 (1992) 342–348.
[4] Balandier P., Landré F., Lampin N., Ruchaud F., Understorey vege-
tation diversity, composition and cover according to light level
under canopies of larch stands thinned with different intensities, in:
“Popular summaries of the Fourth International Conference on
Forest Vegetation Management”, Frochot H., Collet C., Balandier
P., Compilation, Nancy, France, 17–21 June 2002, INRA, 2002,
pp. 157–159.
[5] Balandier P., Pauwels D., La lumière, outil sylvicole pour favoriser
la diversité végétale ou la gestion cynégétique des peuplements de
mélèze (Larix sp.), Forêt Wallone 61 (2002) 9–13.
[6] Balandier P., Ruchaud F., Pauwels D., Jouvie R., Predicting light
transmission through canopies of larch stands (Larix sp.) in France
and Belgium, in: Pâques L.E. (Ed.), “Improvement of larch (Larix
sp.) for better growth, stem form and wood quality”, 2002/09/16-
21, Gap, Auvergne and Limousin, (FRA), INRA-Cemagref, 2002,
pp. 340–349.
[7] Baldocchi D., Collineau S., The physical nature of solar radiation
in heterogeneous canopies: spatial and temporal attributes, in:
Caldwell M.M., Pearcy R.W. (Eds.), Exploitation of Environmental
heterogeneity by plants, Academic Press, 1994, pp. 21–72.
[8] Ballaré C.L., Light gaps: sensing the light opportunities in highly
dynamic canopy environments, in: Caldwell M.M., Pearcy R.W.
(Eds.), Exploitation of Environmental heterogeneity by plants,
Academic Press, 1994, pp. 73–110.
[9] Beaudet M., Messier C., Growth and morphological responses of
yellow birch, sugar maple, and beech seedlings growing under a
natural light gradient, Can. J. For. Res. 28 (1998) 1007–1015.
[10] Beaudet M., Messier C., Paré D., Brisson J., Bergeron Y., Possible
mechanism of sugar maple regeneration failure and replacement by
beech in the Boisé-des-Muir old-growth forest, Quebec, Ecos-
cience 6 (1999) 264–271.
[11] Bigings G.S., Dobertin M., A comparison of distance-dependent
competition measures for height and basal area growth of indivi-
dual conifer trees, For. Sci. 38 (1992) 695–720.
[12] Black T.A., Chen J.M., Lee X., Sagar R.M., Characteristics of short-
wave and longwave irradiances under a Douglas-fir stand, Can. J.
For. Res. 21 (1991) 1020–1028.
[13] Blackburn W.J., Proctor H.T.A., Estimating photosynthetically
active radiation from measured solar irradiance, Sol. Energy 31
(1983) 233–234.
[14] Brown M.J., Parker G.G., Canopy light transmittance in a chrono-
sequence of mixed-species deciduous forests, Can. J. For. Res. 28
(1994) 1694–1703.
[15] Brunner A., A light model for spatially explicit forest stand models,
For. Ecol. Manage. 107 (1998) 19–46.
[16] Cannell M.G.R., Grace J., Competition for light: detection, measu-
rement, and quantification, Can. J. For. Res. 23 (1993) 1969–1979.
[17] Cannell M.G.R., Sheppard L.J., Milne R., Grace J., Light use effi-
ciency and woody biomass production of poplar and willow, Fores-
try 61 (1988) 126–136.
[18] Cescatti A., Modelling the radiative transfer in discontinuous cano-
pies of asymmetric crowns. I. Model structure and algorithms,
Ecol. Model. 101 (1997) 263–274.
[19] Comeau P., Measuring light in the forest, Extension note 42, Minis-
try of Forests Research Program, British Columbia, 2000, 7 p.
[20] Courbaud B., Comparing light interception with stand basal area
for predicting tree growth, Tree Physiol. 20 (2000) 407–414.
[21] Cutini A., The influence of drought and thinning on leaf area index
estimates from canopy transmittance method, Ann. Sci. For. 53
(1996) 595–603.
[22] Dai X., Influence of light conditions in canopy gaps on forest rege-
neration: a new gap light index and its application in a boreal forest
in east-central Sweden, For. Ecol. Manage 84 (1996) 187–197.
[23] Ferment A., Picard N., Gourlet-Fleury S., Baraloto C., A compari-
son of five indirect methods for characterizing the light environ-
ment in a tropical forest, Ann. For. Sci. 58 (2001) 877–891.
Solar radiation in coniferous stand understory 641
[24] Geiger R., The Climate Near the Ground, Harvard University Press,
Cambridge, 1965, 612 p.
[25] Grace J.C., Jarvis P.G., Norman J.M., Modelling the interception of
solar radiation energy in intensively managed stands, N.Z. J. For.
Sci. 17 (1987) 193–209.
[26] Granier A., Étude des relations entre la section du bois d’aubier et
la masse foliaire chez le Douglas (Pseudotsuga menziensii (Mirb.)
Franco), Ann. Sci. For. 48 (1991) 503–512.
[27] Guitton J.L., Ruchaud F., Conséquences écologiques de l’éclaircie
des peuplements de résineux, Informations-Forêt 1, fiche n° 523,
1996, 6 p.
[28] Hale S.E., Light regime beneath Sitka spruce plantations in nor-
thern Britain: preliminary results, For. Ecol. Manage. 151 (2001)
61–66.
[29] Hale S.E., The effect of thinning intensity on the below-canopy
light environment in a Sitka spruce plantation, For. Ecol. Manage.
179 (2003) 341–349.
[30] Houllier F., Bouchon J., Birot Y., Modélisation de la dynamique
des peuplements forestiers: état et perspectives, Rev. For. Fr. 63
(1991) 87–107.
[31] Kobe R.K., Pacala S.W., Silander J.A. Jr., Canham C.D., Juvenile
tree survivorship as a component of shade tolerance, Ecol. Appl. 5
(1995) 517–532.
[32] Kozlowski T.T., Kramer P.J., Pallardy S.G. (Eds.), The physiologi-
cal ecology of woody plants, Academic Press, San Diego, CA,
1991, 657 p.
[33] Kuusipalo J., On the use of tree stand parameters in estimating light
conditions below the canopy, Silva Fenn. 19 (1985) 185–196.
[34] Lieffers V.J., Messier C., Stadt K.J., Gendron F., Comeau P.G.,
Predicting and managing light in the understorey of boreal forests,
Can. J. For. Res. 29 (1999) 796–811.
[35] Long J.N., Smith F.W., Leaf area – sapwood area relations of lod-
gepole pine as influenced by stand density and index, Can. J. For.
Res. 18 (1988) 247–250.
[36] Medhurst J.L., Beadle C.L., Crown structure and leaf area index
development in thinned and unthinned Eucalyptus nitens planta-
tions, Tree Physiol. 21 (2001) 989–999.
[37] Meloni S., Sinoquet H., Assessment of the spatial distribution of
light transmitted below young trees in an agroforestry system, Ann.
Sci. For. 54 (1997) 313–333.
[38] Messier C., Nikinmaa E., Effects of light availability and sapling
size on the growth, biomass allocation, and crown morphology of
understory sugar maple, yellow birch, and beech, Écoscience 7
(2000) 345–356.
[39] Monsi M., Saeki T., Über den Lichtfaktor in den Planzengesells-
chaften und seine Bedeutung für die Stoffproduction, Soc. Jap. J.
Bot. 14 (1953) 22–52.
[40] Monteith J.L., Solar radiation and productivity in tropical ecosys-
tems, J. Appl. Ecol. 9 (1972) 747–766.
[41] Mungai D.N., Stigter C.J., Coulson C.L., Ng’etich W.K., Muniafu
M.M., Kainkwa R.M.R., Measuring solar radiation transmission in
tropical agriculture using tube solarimeters; a warning, Agric. For.
Meteorol. 86 (1997) 235–243.
[42] Nilson T., A theoretical analysis of the frequency of gaps in plant
stands, Agric. Meteorol. 8 (1971) 25–38.
[43] Oker-Blom P., Pukkala T., Kuuluvainen T., Relationship between
radiation interception and photosynthesis in forest canopies: effect
of stand structure ad latitude, Ecol. Model. 40 (1989) 73–87.
[44] Page L.M., Cameron A.D., Clarke G.C., Influence of overstorey
basal area on density and growth of advance regeneration of Sitka
spruce in variably thinned stands, For. Ecol. Manage. 151 (2001)
25–35.
[45] Parker G.G., Davis M.M., Moon Chapotin S., Canopy light trans-
mittance in Douglas-fir-western hemlock stands, Tree Physiol. 22
(2002) 147–157.
[46] Pauwels D., Lejeune P., Balandier P., Rondeux J., A silvicultural
decision support system for pure larch stands: helping managers to
meet their goals, in: Pâques L.E. (Ed.), “Improvement of larch
(Larix sp.) for better growth, stem form and wood quality”, 2002/
00/16-21, Gap, Auvergne and Limousin, (FRA), INRA-Cemagref,
2002, pp. 340–349.
[47] Porté A., Bosc A., Champion I., Lousteau D., Estimating the foliage
area of Maritime pine (Pinus pinaster Aït.) branches and crowns
with application to modeling the foliage area distribution in the
crown, Ann. For. Sci. 57 (2000) 73–86.
[48] Roberts S.D., Long J.N., Production efficiency of Abies lasiocarpa:
influence of vertical distribution of leaf area, Can. J. For. Res. 22
(1992) 1230–1234.
[49] Roberts S.D., Long J.N., Smith F.W., Canopy stratification and leaf
area efficiency: a conceptualization, For. Ecol. Manage. 60 (1993)
143–156.
[50] Ross M.S., Flanagan L.B., La Roi G.H., Seasonal and successional
changes in light quality and quantity in the understory of boreal
forest ecosystems, Can. J. Bot. 66 (1986) 2792–2799.
[51] Ruchaud F., Nicolaïdes O., Jouvie R., Modélisation de l’éclairement
au sol dans des peuplements de résineux : proposition de sylvicul-
tures développant la richesse spécifique du sous-bois ou la produc-
tion herbacée, Rapport interne, Cemagref, Clermont-Ferrand,
France.
[52] Sampson D.A., Smith F.W., Influence of canopy architecture on
light penetration in lodgepole pine (Pinus contorta var. latifolia)
forests, Agric. For. Meteorol. 64 (1993) 63–79.
[53] SAS Institute Inc., SAS/STAT Software Version 8 of the SAS Sys-
tem for Windows, 2000, Cary, NC: SAS Institute Inc.
[54] Sattin M., Milne R., Deans J.D., Jarvis P.G., Radiation interception
measurement in poplar: sample size and comparison between tube
solarimeters and quantum sensors, Agric. For. Meteorol. 85 (1997)
209–216.
[55] Shinozaki K., Yoda K., Hozumi K., Kira T., A quantitative analysis
of plant form – The pipe model theory. I. Basic analysis, Jap. J.
Ecol. 14 (1964) 97–105.
[56] Sinoquet H., Le Roux X., Short term interactions between tree
foliage and the aerial environment : an overview of modeling
approaches available for the structure-function models, Ann. For.
Sci. 57 (2000) 477–496.
[57] Smith H., Plant architecture and light signals, in: Marshall B.,
Roberts J.A. (Eds.), Leaf development and canopy growth, Shef-
field Academic Press Ltd, CRC Press, 2000, pp. 118–144.
[58] Smith N.J., Predicting radiation attenuation in stands of Douglas-fir
(Pseudotsuga menziesii), For. Sci. 37 (1991) 1213–1223.
[59] Smith N.J., Estimating leaf area index and light extinction coeffi-
cient in stands of Douglas-fir (Pseudotsuga menziesii), Can. J. For.
Res. 23 (1993) 317–321.
[60] Toutain F., Les humus forestiers: structure et mode de fonctionne-
ment, Rev. For. Fr. 32 (1981) 449–479.
[61] Turner D.P., Acker S.A., Means J.E., Garman S.L., Assessing alter-
native allometric algorithms for estimating leaf area of Douglas-fir
trees and stands, For. Ecol. Manage. 126 (2000) 61–76.
[62] Usoltsev V.A., Hoffmann C.W., A preliminary crown biomass
table for even-aged Picea abies stands in Switzerland, Forestry 70
(1997) 103–112.
[63] Varlet-Grancher C., Chartier M., Gosse G., Bonhomme R., Rayon-
nement utile pour la photosynthèse des végétaux en conditions
naturelles : caractérisation et variations, Acta Oecol. Oecol. Plant.
16 (1981) 189–202.
[64] Varlet-Grancher C., Gosse G., Chartier M., Sinoquet H., Bonhomme
R., Allirand J.M., Mise au point : rayonnement solaire absorbé ou
intercepté par le couvert végétal, Agronomie 9 (1989) 29–43.
[65] Vertessy R.A., Benyon R.G., O’Sullivan S.K., Gribben P.R., Rela-
tionships between stem diameter, sapwood area, leaf area and trans-
piration in a young mountain ash forest, Tree Physiol. 15 (1995)
559–567.
[66] Waring R.H., Schoeder P.E., Oren R., Application of the pipe
model theory to predict canopy leaf area, Can. J. For Res. 12 (1982)
556–560.
[67] West P.W., Model of above-ground assimilate partitioning and
growth of individual trees in even-aged forest monoculture, J.
Theor. Biol. 161 (1993) 369–394.