Báo cáo lâm nghiệp: "High potential for increase in CO2 flux from forest soil surface due to global warming in cooler areas of Japan" ppt
Bạn đang xem bản rút gọn của tài liệu. Xem và tải ngay bản đầy đủ của tài liệu tại đây (530.94 KB, 10 trang )
Ann. For. Sci. 63 (2006) 537–546 537
c
INRA, EDP Sciences, 2006
DOI: 10.1051/forest:2006036
Original article
High potential for increase in CO
2
flux from forest soil surface
due to global warming in cooler areas of Japan
Shigehiro I
a,b
*
,
**
, Tadashi S
a
*
,b
, Satoshi S
c
, Shigeto I
b
*
,d
,
Chisato T
e
, Nobuaki T
e,f
*
,HisaoS
a
*
,g
, Takanori S
h
,KensakuK-N
i
,
Shin-ichi O
j
, Nagaharu T
a
, Masamichi T
b
a
Hokkaido Research Center, Forestry and Forest Products Research Institute, 7 Hitsujigaoka, Sapporo, Hokkaido 062-8516, Japan
b
Forestry and Forest Products Research Institute, Tsukuba, Ibaraki 305-8687, Japan
c
Akita Prefecture Forest Technology Center, Akita, Akita 019-2611, Japan
d
Tohoku Research Center, Forestry and Forest Products Research Institute, Morioka, Iwate 020-0123, Japan
e
Graduate School of Bioagricultural Sciences, Nagoya University, Nagoya, Aichi 464-8601, Japan
f
Mizuho Information and Research Institute Inc., Tokyo 101-8443, Japan
g
Kiso Experimental Station, Forestry and Forest Products Research Institute, Kisogun, Nagano 397-0001, Japan
h
Kyushu Research Center, Forestry and Forest Products Research Institute, Kumamoto, Kumamoto 860-0862, Japan
i
Okinawa Prefecture Forestry Experiment Station, Nago, Okinawa 905-0017, Japan
j
Hiroshima University, Higashi Hiroshima, Hiroshima 739-8521, Japan
(Received 8 December 2005; accepted 22 February 2006)
Abstract – The CO
2
fluxes from the forest floor were measured using a closed chamber method at 26 sites from 26
◦
NLat.to44
◦
N Lat. in Japan.
Seasonal fluctuation in CO
2
flux was found to correlate exponentially with seasonal fluctuation in soil temperature at each site. Estimate of annual
carbon emission from the forest floor ranged from 3.1 to 10.6 Mg C ha
−1
. The emission rate of soil-organic-carbon-derived CO
2
, obtained by incubation
of intact soil samples, correlated closely with the carboxymethylcellulase (CMCase) activity in the soil. The sum of cool-water soluble polysaccharides,
hot-water soluble polysaccharides, hemicellulose, and cellulose content in the soil was greater at the sites with low CMCase activity than that at the
sites with high CMCase activity. Because the sites in cooler-climate sites had a high content of easily decomposable soil organic carbon and organic
litter, the potential increase in CO
2
efflux from forest floor with increasing soil temperature would be greater in cooler-climate sites.
cellulose / Japanese forest / soil organic carbon / soil respiration
Résumé – Fort potentiel d’accroissement de flux de CO
2
issu de la surface du sol forestier en relation av ec le réchauffement global dans les
régions fraîches du Japon. Le flux de CO
2
issu du sol forestier a été mesuré dans 26 sites, allant du 26
◦
au 44
◦
de latitude Nord dans l’archipel
japonais, en utilisant la méthode des chambres fermées. Il a pu être mis en évidence que la fluctuation saisonnière du flux de CO
2
était corrélée de
façon exponentielle avec celle de la température du sol de chacun des sites étudiés. L’estimation annelle de l’émission de carbone venant du sol variait
de 3,1 à 10,6 Mg C ha
−1
. Le taux d’émission de CO
2
obtenu par incubation d’échantillons intacts de sol est corrélé positivement avec l’activité de la
carboxyméthacellulase (CMCase), dans le sol. La somme totale des polysaccharides solubles dans l’eau froide, des polysaccharides solubles dans l’eau
chaude, des hémicelluloses et de la cellulose contenus dans le sol était plus grande dans les sites caractérisés par une faible activité CMCase que dans
les sites avec une forte activité CMCase. Du fait que les sites en climat frais ont un contenu élevé en carbone organique du sol facilement décomposable
et une litière organique, le potentiel d’accroissement du flux de CO
2
avec l’accroissement de la température du sol devrait être plus grand dans les sites
à climat frais.
cellulose / forêt japonaise / carbone organique du sol / respiration du sol
1. INTRODUCTION
Carbon dioxide (CO
2
) is the most important greenhouse
gas, contributing to 60% of global warming [12]. The world-
wide carbon stock in soils is estimated to be 1500 Pg, three
times greater than that in terrestrial plants [12], and soil car-
bon is gradually mineralized by microorganisms to be released
* Present address.
** Corresponding author: ishiz03@ffpri.affrc.go.jp
to the atmosphere as CO
2
gas. Generally the forest ecosys-
tem is considered to be a CO
2
sink [33], but if the decompo-
sition of soil carbon in the forest ecosystems is promoted by
global warming, it would be doubtful whether forests could
serve as CO
2
sinks. A recent study shows that soil in England
and Wales lost carbon at a mean rate of 0.6% y
−1
from 1978
to 2003 according to soil inventory data [1]. In light of global
warming, the amount of carbon transferred from soil organic
matter to the atmosphere is a serious concern [5].
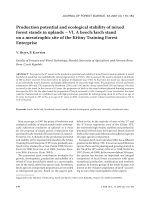
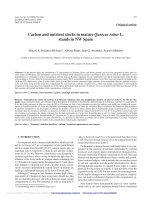
Article published by EDP Sciences and available at or />538 S. Ishizuka et al.
Figure 1. (a) Japan in East Asia, (b) sampling sites in Japan.
Many factors affect the decomposition of soil organic car-
bon in a forest ecosystem. Soil temperature often controls
the seasonal fluctuation of soil respiration, which increases in
summer and decreases in winter [7]. Rainfall and soil water
content also affect the soil respiration, as is seen in the suppres-
sion of soil respiration by drought in Mediterranean forests
in summer [15]. Besides environmental factors, the quality of
organic matter is important. Soil organic carbon consists of
various components with different turnover rates. Radiocarbon
study indicates that the turnover times of soil organic carbon
range from decades (or shorter) to millennia [31, 32]. Accord-
ing to these studies, the cooler the climate is, the more organic
carbon with short turnover time accumulates [31]. Thus when
we consider the effects of global warming on soil organic car-
bon, we need to take into account changes in the proportion of
components with different turnover rates, as well as the direct
effect of temperature on soil organic matter decomposition.
In a soil warming experiment, soil respiration was found to
increase for the initial 6 years to 28% of the respiration be-
fore the experiment, but respiration was negligible from the
tenth year onward, suggesting that the consumption of eas-
ily decomposable substrates within ten years serves as a lim-
iting factor [18]. Another interpretation for the global warm-
ing effect on the soil respiration is possible: changes in soil
respiration may be caused by changes in net primary produc-
tion, which is related to the input of organic matter to the
soil [16, 18]. Therefore, the relationship between the quality
and quantity of soil carbon and CO
2
flux from the soil surface,
and litter respiration remains a serious concern [10].
On the global scale, the amount of soil respirations is
greater in warmer climates than in cooler climates [23]. In the
tropics, vigorous plant growth and rapid decomposition of soil
organic matter are responsible for the high rates of soil respira-
tion [26]. Cold temperature inhibits organic matter decomposi-
tion, which results in the low rate of soil respiration seen in bo-
real forests [25]. On a continental scale, soil respiration varies
from site to site. It does not relate to mean annual tempera-
ture over a wide range of European forest ecosystems [9, 15].
Davidson et al. [5] suggest that this insensitivity to temperature
results from a great accumulation of easily decomposable sub-
strates in cool climates. However, few studies had been con-
ducted to examine how soil respiration varies with latitude. To
estimate the soil respiration rate on a global scale, observation
at different latitude at another longitude would be useful.
Much soil respiration research has been conducted on for-
est ecosystems in Japan, but different researches have used dif-
ferent methods (e.g., alkaline absorption, dynamic chamber),
which raises the problem of comparing data among sites. The
objectives of this research are (1) to compare soil respiration
in various forest ecosystems at different latitude in Japan, from
26
◦
Nto44
◦
N Lat., using a single method, and (2) to analyze
the relationship between CO
2
flux from the soil and the quali-
ties of soil organic carbon. This study promises to contribute to
understanding of Japan-wide CO
2
emission from the soil sur-
face and the characteristics of soil organic carbon in Japanese
forests.
2. MATERIALS AND METHODS
2.1. Site description
We established 26 forested plots for CO
2
flux measurement
through the Japanese islands from 26
◦
Nto44
◦
NLat.(Fig.1
and Tab. I). These are mainly humid temperate forests, with four
exceptions: 1 subtropical forest (OK) and 3 sub-alpine coniferous
forests (SK, OD1 and OD2). The mean annual soil temperatures of
these sites range from 4 to 22
◦
C. The mean annual rainfall for the
last ten years at the meteorological station nearest each site ranged
from 1200 to 3500 mm (1630 mm on average) (Japan Meteorolog-
ical Agency, Automated Meteorological Data Acquisition System:
The northern sites (SK, HG, JK, MM,
AP, ANM and TZ) and the high-altitude sites (OD and OT) are usu-
ally covered with snow from December through April. The central
sites (OG, HT, KB, TK, KZ, ST and IB) are sometimes covered with
snow for a few weeks in winter. The ages of trees at all plantations
were greater than 20 years. Four soil types (Cambisol, Andosol, Pod-
zol and Alisol) exist at the study sites, and most sites are affected by
CO
2
flux from soil surface in Japan 539
Table I. General Information of the Sites.
Site Lat. Long. Elev. Vegetation
a
Forest Soil type
b
Annual Avg. soil Flux observation Number of
(m) type rainfall
c
temp. (˚C) period samplings
SK 43
◦
40’ 143
◦
06’ 1000 PJ, AS Natural Podzol 1418 4.1
e
Sep 99 – Oct 01 8
JK 42
◦
58’ 141
◦
10’ 322 AS Planted Cambisol 1268 7.3
e
Jun99–May01 6
MM 42
◦
56’ 141
◦
16’ 440 AS Planted Cambisol 1268 6.4
f
Jun99–Sep99 4
HG1 42
◦
59’ 141
◦
23’ 240 BP, QM Natural Andosol 1167 7.6
f
Jun98–Sep99 12
HG2 42
◦
59’ 141
◦
23’ 260 BP, QM Natural Andosol 1167 7.5
f
Jun98–Sep99 11
HG3 42
◦
59’ 141
◦
23’ 175 BP, QM Natural Andosol 1167 8.3
e
Jun98–Aug00 6
AP 39
◦
59’ 140
◦
54’ 825 FC Natural Andosol 1207 6.9
e
Jun00–Nov01 13
ANM 39
◦
59’ 140
◦
24’ 200 CJ Planted Cambisol 2006 9.4
f
Jun01–Nov02 14
TZ 39
◦
46’ 140
◦
43’ 350 CJ Planted Andosol 2188 9.6
e
Jul 00 – May 02 13
OG1 36
◦
56’ 140
◦
35’ 650 FC, FJ Natural Andosol 1948 10.6
e
May 95 – Mar 02 30
OG2 36
◦
56’ 140
◦
35’ 650 FC, FJ Natural Cambisol 1948 10.6
e
Jul 95 – Mar 98 13
OG3 36
◦
56’ 140
◦
35’ 650 CJ Natural Andosol 1948 9.5
e
Jun97–Mar02 18
OG4 36
◦
56’ 140
◦
35’ 650 QS, CA Deforested Cambisol 1948 ND
g
Nov 96 – Dec 97 6
HT 36
◦
35’ 140
◦
35’ 380 CA Mixed
d
Cambisol 1371 12.1
f
Jul97–May98 6
KB1 36
◦
18’ 140
◦
09’ 470 CA, QM Mixed
d
Cambisol 1310 11.1
f
Aug97–Jun02 23
KB2 36
◦
19’ 140
◦
09’ 250 CO Planted Cambisol 1310 12.0
e
Apr 99 – Jun 02 19
TK 36
◦
10’ 140
◦
11’ 330 CJ Planted Andosol 1310 12.2
f
May95–Nov95 6
KZ 36
◦
00’ 140
◦
08’ 22 CO Planted Andosol 1203 14.0
f
Feb 95 – Aug 95 5
OT 35
◦
55’ 137
◦
19’ 1350 CO Planted Andosol 3502 6.4
f
Aug 00 – Dec 01 13
OD1 35
◦
51’ 138
◦
39’ 2090 AV Natural Podzol 1365 4.2
e
Jun99–Sep01 14
OD2 35
◦
51’ 138
◦
39’ 2080 LK Planted Podzol 1365 5.2
e
Jun99–Sep01 14
ST 35
◦
14’ 137
◦
08’ 630 CO Planted Cambisol 1528 11.2
e
Jul 00 – Dec 01 14
IB 35
◦
12’ 137
◦
34’ 1010 CO Planted Cambisol 1972 9.3
e
Jul 00 – Dec 01 14
HS 34
◦
24’ 132
◦
43’ 240 PD Natural Cambisol 1513 15.1
f
Oct01–Dec01 3
KH 33
◦
05’ 130
◦
26’ 165 CO, CJ Planted Cambisol 2072 14.2
e
May 00 – Mar 03 35
OK 26
◦
31’ 127
◦
59’ 100 CC Natural Alisol 2131 21.5
e
Apr 99 – Jan 02 7
a
AV: Abies veitchii,AS:Abies sachalinensis,BP:Betula platyphylla,CA:Carpinus spp., CC: Castanopsis cuspidata,CJ:Cryptomeria japonica,CO:
Chamaecyparis obtusa,FC:Fagus crenata,FJ:Fagus japonica,LK:Larix kaempferi, CJ: Cryptomeria japonica,CO:Chamaecyparis obtusa,FC:
Fagus crenata,FJ:Fagus japonica,LK:Larix kaempferi, PD: Pinus densiflora,PJ:Picea jezoensis,QM:Quercus mongolica,QS:Quer cus serrata.
b
WRB classification (ISSS Working Group RB, 1998).
c
1993–2002 at the nearest meteorological station of Japan Meteorological Agency.
d
Unsuccessful afforestation (overgrown by natural vegetation).
e
Average soil temperature through a year measured with a thermorecorder at 1-h intervals.
f
Estimation; based on the mean annual air temperature at the nearest meteorological station and the elevation of the site.
g
ND: cannot be estimated because the daily fluctuation of flux did not correlate with soil temperature due to deforestation.
volcanic ash deposition to some extent even though the soil is not
Andosol. The general soil properties are shown in Table II.
2.2. Flux measurement
CO
2
flux was measured by static chamber method [24]. Three or
five stainless-steel chambers (40 cm in diameter, 15 cm in length)
were inserted in the soil to a depth of at least 1 cm at each site. Each
chamber was fixed at its location throughout the observation period.
For CO
2
flux measurement, the chamber was covered with a PVC
lid with a sampling port and an air bag to equalize the air pressure
in the chamber. We took gas samples from the chamber using a dis-
posable syringe at 0, 10, 20 and 40 min elapsed after the chamber
was covered with a lid. Each gas sample was filled into a glass vial
with a butyl rubber top that had been evacuated beforehand in the
laboratory. The CO
2
gas concentration was determined using a gas
chromatograph equipped with a thermal conductivity detector (Shi-
mazu GC-14B-TCD, Japan). A 5-mL gas sample was used for anal-
ysis. Standard calibration was made using standard gases of 310 and
4130 µLCO
2
L
−1
(Sumitomo Seika Chemicals Co., Japan). We cal-
culated fluxes using a non-linear model [11], in which the chamber
volume was corrected according to the air pressure for the altitude of
the plot. The CO
2
fluxes were measured monthly, avoiding a rainy
540 S. Ishizuka et al.
Table II. Soil characteristics of the surface 5 cm of soil.
Site pH Water Total C Total N Bulk Inorganic N Microbial Soil texture
(H
2
O) content density NH
4
-N NO
3
-N biomass C Sand Silt Clay
kg kg
−1
mg g
−1
mg g
−1
Mg m
−3
µgg
−1
µgg
−1
µgCg
−1
(%) (%) (%)
SK 4.2 0.78 86 4.6 ND
a
17.2 2.0 1305 51.3 27.8 20.9
JK 5.1 0.45 50 3.1 ND
a
ND
a
ND
a
ND
a
50.0 32.6 17.4
MM 5.3 0.59 55 4.0 0.46 25.0 2.3 ND
a
56.8 34.0 9.2
HG1,2 6.0 0.68 78 5.7 0.55 19.7 1.7 534 59.7 25.1 15.2
HG3 6.2 1.08 104 5.6 0.36 11.8 0.5 1704 ND
a
ND
a
ND
a
AP 4.5 1.17 129 8.7 0.41 21.5 7.8 3119 16.3 40.2 43.4
ANM 5.2 ND
a
300 12.5 ND
a
ND
a
ND
a
ND
a
11.9 53.5 34.6
TZ 5.8 1.23 140 8.6 0.33 21.7 12.9 1702 13.5 75.4 11.1
OG1 4.9 1.67 230 13.0 0.33 13.8 15.3 2262 ND
a
ND
a
ND
a
OG2 4.8 0.78 54 4.0 0.51 9.0 1.2 1524 ND
a
ND
a
ND
a
OG3 4.5 1.04 162 10.4 0.35 ND
a
ND
a
ND
a
30.9 20.1 49.0
OG4 4.8 0.64 94 5.6 0.58 10.6 6.4 2021 63.1 22.5 14.4
HT 4.5 0.50 48 3.1 0.55 13.5 18.5 ND
a
40.9 36.5 22.6
KB1 4.6 0.94 125 10.2 0.34 10.0 9.2 ND
a
62.6 18.3 19.2
KB2 ND
a
1.32 148 9.1 0.30 ND
a
ND
a
ND
a
ND
a
ND
a
ND
a
TK 4.4 1.45 169 11.0 0.31 14.9 48.8 ND
a
ND
a
ND
a
ND
a
KZ ND
a
ND
a
ND
a
ND
a
ND
a
ND
a
ND
a
ND
a
ND
a
ND
a
ND
a
OT 4.1 1.68 133 9.2 0.31 20.6 22.3 1700 ND
a
ND
a
ND
a
OD1 3.7 1.18 212 11.6 0.32 14.9 14.2 3275 43.1 20.7 36.2
OD2 4.0 0.62 132 7.5 0.55 13.6 9.3 2361 59.6 16.5 23.9
ST 4.2 0.45 24 1.7 0.79 9.7 1.9 634 26.1 20.2 53.6
IB 4.8 1.04 80 4.6 0.51 20.4 5.3 1123 25.3 21.6 53.1
HS 4.3 0.36 71 3.4 0.88 13.1 0.3 1008 74.3 12.7 13.0
KH 4.5 0.61 42 2.7 0.84 13.8 0.1 1157 28.3 37.5 34.2
OK 4.9 0.25 50 2.4 0.80 8.8 0.4 1632 41.6 38.9 19.4
a
Not determined.
day. When snow covered the whole surface of the chamber, we did
not take gas samples. While collecting gas samples, we measured the
air temperature 1 m above the ground and the soil temperature at 5 cm
depth. Soil temperature at 5 cm depth was also recorded hourly using
a data logger (TR-71S or TR-52, T & D Co., Japan). At sites without a
temperature data logger, hourly soil temperature was estimated from
the air temperature obtained from the nearest meteorological station
(Japan Meteorological Agency, Automated Meteorological Data Ac-
quisition System) using the relationship between air temperature and
soil temperature measured on sampling days. We defined an “inte-
grated soil temperature” as the sum of the daily average soil temper-
atures for one year.
2.3. Soil analysis
Soils for chemical analysis were sampled from the depths of 0–5,
5–10 and 10–15 cm. All soils were sieved with a 2-mm-mesh sieve
and stored in a refrigerator at 4
◦
C until analysis. The soil total carbon
and nitrogen contents were measured using an NC analyzer (NC-800,
Sumitomo Chemical Co., Japan). The inorganic NH
4
and NO
3
in the
extractant of 10 g fresh soil shaken with 100 mL 2M KCl for 1 h were
determined using a flow-injection analyzer (Aquatec 5400, Tecator
Co., Sweden). Soil water content was calculated by the weight differ-
ence before and after oven drying at 105
◦
C for 24 h. We determined
the content of wax, cool-water-soluble polysaccharides, hot-water-
soluble polysaccharides, hemicellulose, cellulose, and lignin in the
soils of ten sites (HG3, AP, TZ, OD1, OD2, IB, ST, KH, HS and OK).
The wax was extracted using a Soxhlet-extraction system with 1:1
benzene-ethanol solution for 24 h and weighed after the solvent was
evaporated. After the Soxhlet-extraction, cool-water-soluble polysac-
charides, hot-water-soluble polysaccharides, hemicellulose and cel-
lulose were obtained by sequential extraction using cool water, hot
water, 2% HCl solution, and 72% H
2
SO
4
solution, respectively, and
lignin was obtained in the residue [29]. The contents in each fraction,
except lignin, were expressed as the sum of pentose and hexose [20].
The pentose content was determined by orcinol method [19], and the
hexose content was determined by anthrone method [4]. Once all the
extraction were complete, carbon and nitrogen contents of the residue
were measured using an NC analyzer and the lignin content was cal-
culated using this equation: lignin content = carbon content × 1.724 –
nitrogen content × 6.25. The microbial biomass carbon was measured
CO
2
flux from soil surface in Japan 541
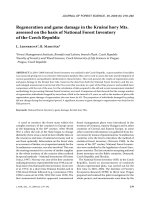
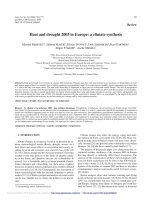
Figure 2. Example of seasonal fluctuation of CO
2
flux (left) and the correlation between CO
2
flux and soil temperature (right) at KH.
by chloroform fumigation extraction method [34] using a TOC ana-
lyzer (TOC-5000, Shimazu Co., Japan). Carboxymethylcellulase ac-
tivity (CMCase) was determined by the difference in the reducing
sugar contents in the sample and in a control solution [21]. The reduc-
ing sugar contents were determined by Somogyi-Nelson method [28].
The activity of phosphomonoesterase was determined by colorimetric
method [30] with a minor modification [13]. The particle size distri-
bution was determined by pipette sampling method [6].
2.4. Soil core incubation
Intact soil cores with a volume of 100 mL (5 cm in diameter,
5.1 cm in height) were collected from the soil depths correspond-
ing to the soil sampling depth at each plot. Triplicate samples were
collected for each depth. We incubated soil cores to evaluate the po-
tential of CO
2
emission of the soils at the ten sites (HG3, AP, TZ,
KB2, OD1, OD2, IB, ST, KH and OK) by the following method [14].
An intact soil core was placed in a 500-mL incubation jar at 25
◦
C
and stopped with a butyl rubber stopper. The gas in the headspace
was sampled 4 h and 24 h after closure. The CO
2
concentration in the
headspace was preliminarily found to show a linear increase during
this incubation period. The emission rate of CO
2
from the soil core
was calculated using the slope of a line showing the rate of increase
in CO
2
concentration with time. All data are the means of triplicate
samples. We defined the emission potential of CO
2
derived from soil
organic carbon decomposition (hereafter SOC-CO
2
) as the sum of the
emission rates at 0–5 cm, 5–10 cm and 10–15 cm depths obtained by
incubation method.
3. RESULTS
3.1. CO
2
flux from the forest floor
The CO
2
flux from the forest floor fluctuated seasonally,
showing maximum in summer and minimum in winter. The
CO
2
fluxes during the observation period ranged from 0.08 to
5.89 g C m
−2
d
−1
(Tab. III). The fluxes correlated exponen-
tially with the soil temperature at 5 cm depth at most sites (an
example is shown in Fig. 2), and the flux can be expressed by
the following equation:
Flux (gC m
−2
d
−1
) =A e
BT
(1)
where T is the soil temperature at 5 cm depth (
◦
C), and A and
B are constants for each site. A is the CO
2
flux at 0
◦
CandB
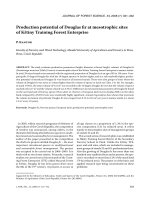
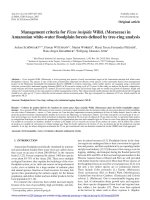
Figure 3. Relationship between integrated soil temperature and CO
2
flux at 15
◦
C calculated using the parameter in Table III.
is the parameter of temperature dependency (if B is larger than
0.069, then Q
10
is greater than 2). To compare the CO
2
flux
under the same temperature at all sites, the CO
2
flux at 15
◦
C
calculated using the (Eq. (1)) was used. The fluxes correlated
negatively with the integrated soil temperature (Fig. 3).
Annual CO
2
flux from the forest floor at each site was es-
timated by the sum of hourly CO
2
flux calculated by equa-
tion (1), using the data logger records of hourly soil temper-
ature at 5 cm depth on the site (Tab. III). Because the soil
temperature and CO
2
flux at KZ did not show a close rela-
tionship, we did not calculate the annual CO
2
efflux at KZ.
The estimated CO
2
flux from the forest floor ranged from 3.1
to 10.6 Mg C ha
−1
y
−1
(Tab. III). A correlation between inte-
grated soil temperature and CO
2
efflux was not found (Fig. 4).
The average of annual CO
2
efflux at the northern sites (SK,
JK, MM, HG, AP, ANM, TZ and OG; the mean and standard
deviation were 6.82 ± 1.18) was significantly greater than at
southern sites (HT, KB, TK, OT, OD, ST, IB, HS, KH and OK;
the mean and standard deviation were 4.91 ± 2.06) (p = 0.009
in student’s t-test). To compare our data with global-scale ob-
servations, the estimated CO
2
flux was calculated by the fol-
lowing equation [25]:
EVOL = −0.242 × (LAT) + 17.215 (2)
where EVOL (Mg C ha
−1
y
−1
)isCO
2
flux from the forest floor
and LAT (
◦
) is the north latitude of the site. The flux rates
542 S. Ishizuka et al.
Table III. Estimates of annual CO
2
emission rate from the relationship between soil temperature and CO
2
flux (rate 1) and annual CO
2
emission
rate estimated by Schlesinger’s equation (rate 2).
Site Avg. soil CO
2
flux range Regression parameter
a
Annual CO
2
emission rate
temp. (g C m
−2
d
−1
)Rate1Rate2
◦
Cminmax ABr
2
(Mg C ha
−1
)(MgCha
−1
)
SK 5.70 1.22 3.91 0.795 0.090 0.937 5.71 6.65
JK 8.70
b
1.69 5.53 0.973 0.082 0.786 7.66 6.82
MM 9.00
b
2.17 5.49 1.005 0.085 0.996 9.27 6.83
HG1 9.00
b
0.96 4.36 0.541 0.100 0.832 6.32 6.82
HG2 9.00
b
0.83 4.61 0.579 0.092 0.862 6.52 6.82
HG3 9.00
b
2.07 4.96 0.894 0.085 0.897 8.51 6.82
AP 8.90 0.68 4.71 0.546 0.123 0.848 6.69 7.54
ANM 9.56
b
1.47 3.10 0.845 0.054 0.707 6.22 7.54
TZ 9.56 0.81 5.42 0.419 0.114 0.916 7.02 7.59
OG1 11.14
b
0.13 5.60 0.268 0.141 0.783 6.62 8.28
OG2 10.09
b
0.33 4.73 0.238 0.126 0.979 6.76 8.28
OG3 9.47
b
0.08 4.65 0.222 0.137 0.813 4.57 8.28
OG4 11.19
b
0.57 5.82 0.322 0.136 0.907 6.80 8.28
HT 11.80
b
0.19 4.19 0.190 0.150 0.860 5.79 8.37
KB1 11.80
b
0.10 3.41 0.184 0.129 0.851 4.61 8.43
KB2 11.80 0.35 1.78 0.463 0.068 0.602 4.26 8.43
TK 11.77
b
0.83 2.22 0.689 0.053 0.697 5.83 8.42
KZ 13.40
b
0.50 2.89 0.832 0.056 0.347 ND
c
8.50
OT 7.80
b
0.33 2.74 0.268 0.125 0.968 3.56 8.52
OD1 5.19 0.55 5.89 0.560 0.094 0.802 3.60 8.54
OD2 4.18 0.68 2.91 0.552 0.121 0.693 4.35 8.54
ST 10.83 0.71 1.99 0.564 0.050 0.586 4.05 8.69
IB 8.95 0.50 1.92 0.323 0.083 0.805 3.06 8.70
HS ND
c
0.78 1.44 ND
c
ND
c
ND
c
ND
c
ND
c
KH 14.23 0.22 4.18 0.140 0.129 0.906 4.29 9.20
OK 21.99 0.76 2.70 0.062 0.168 0.901 10.57 10.80
a
Regression parameter of the equation: [flux] = A × e
B[SoilTemperature]
.
b
Estimated using the data of the nearest meteorological station ( />c
Not determined.
estimated using equation (2) were almost the same as those
measured at the sites north of 39
◦
N (north of TZ), but were
higher than those measured at sites south of 39
◦
N.
3.2. Soil organic components
The sum of cool-water-soluble polysaccharides and hot-
water-soluble polysaccharides, hemicellulose and cellulose
ranged from 790 to 2700 g m
−2
in the soil from 0 to 15 cm
depth. This was 19.4% of the total soil organic matter on aver-
age (Tab. IV). Of these components, the hemicellulose content
was the highest (66.7% of the sum of polysaccharides, hemi-
cellulose and cellulose on average). The hemicellulose con-
tent (14.2% on average) was two to nine times greater than the
cellulose content. Lignin content ranged from 24.4 to 56.6%
of total soil organic matter. The ratio of cellulose to hemicel-
lulose to lignin was 1:5:17 on average, which is remarkably
different from that in plant materials (e.g., 2:1:1 in woody
xylem, and 1:1:2 in leaves) and litter (nearly the same ratio
as in leaves [3]).
3.3. Soil enzyme activities
CMCase is an endo-β-glucanase (EC 3.2.1.4), that is used
as an index of microbial activity in cellulosic material de-
composition [27]. CMCase activity ranged from 4.5 to 24.0
g-glucose d
−1
per square meter in the soil from 0–15 cm depth
(Tab. V). The activity of phosphomonoesterase correlated with
that of CMCase (Tab. V, r = 0.716, n = 9, p < 0.05 in Pear-
son’s correlation test), suggesting that these enzyme activities
CO
2
flux from soil surface in Japan 543
Table IV. Soil organic matter, wax, polysaccharides, hemicellulose, cellulose and lignin contents in topsoil
a
.
Site Organic Wax Soil cellulosic materials Lignin
matter
b
Cool-water extracted Hot-water extracted Hemicellulose Cellulose Total
Hexose
c
Pentose
d
Hexose
c
Pentose
d
Hexose
c
Pentose
d
Hexose
c
Pentose
d
(kg m
−2
)(gm
−2
)(gm
−2
)(gm
−2
)(gm
−2
)(gm
−2
)(gm
−2
)(gm
−2
)(gm
−2
)(gm
−2
)(gm
−2
)(gm
−2
)
HG3 8.2 252 37 7 74 29 510 195 108 16 980 2210
AP 11.0 385 23 7 233 63 1640 483 222 26 2700 4595
TZ 13.0 157 19 6 152 41 1210 455 226 42 2150 7350
OD1 18.9 635 22 6 422 160 945 318 152 20 2050 5450
OD2 15.8 525 22 6 338 116 760 243 125 17 1630 4030
ST 4.2 207 45 17 114 45 660 267 282 39 1470 1645
IB 8.9 272 25 8 116 37 1010 388 285 37 1900 3430
HS 7.1 385 26 8 188 82 378 143 207 25 1060 1740
KH 6.4 426 55 20 244 71 1200 385 235 35 2250 3200
OK 5.9 422 17 4 113 44 334 134 126 17 790 1905
a
Total amount in the soil from 0 to 15 cm depth.
b
Carbon content × 1.724.
c
Equivalent to glucose weight.
d
Equivalent to xylose weight.
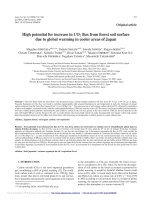
Figure 4. The relationship between integrated soil temperature and
annual CO
2
emission from soil surface.
can be used as an indicator of total microbial activity for de-
composing soil organic matter in Japanese soils.
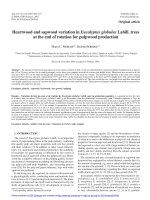
3.4. CO
2
emission potential f or soil
The CO
2
emission rates (mg C d
−1
) from incubated soil
cores ranged from 0.76 to 3.42 at 0–5 cm depth, from 0.28
to 0.96 at 5–10 cm depth, and from 0.26 to 1.06 at 10–15 cm
depth. Approximately 60% of CO
2
emission was derived from
the uppermost 5-cm layer on average. The emission potential
of SOC-CO
2
correlated positively with CMCase activity and
correlated negatively with the cellulose content (Fig. 5). The
other soil constituents did not correlate significantly with the
Table V . Enzyme activities in topsoils
a
.
Site CMCase Phospho-monoesterase
(g d
−1
)
b
(mol h
−1
)
HG3 ND
c
ND
c
AP 7.2 2.7
TZ 8.4 1.6
OD1 6.9 3.7
OD2 14.9 2.3
ST 6.2 3.0
IB 4.5 4.5
HS 24.0 7.2
KH 9.3 2.9
OK 20.3 9.3
a
Total amount in the soil from 0 to 15 cm depth per square meter.
b
Equivalent to glucose weight.
c
Not determined.
emission potential of SOC-CO
2
(p > 0.05 in Pearson’s corre-
lation test).
4. DISCUSSION
We did not find that the CO
2
flux from the soil surface
tended to decrease with the increase of latitude, as was re-
ported by Schlesinger [25] (Tab. III). If we exclude OK from
the analysis, we see the opposite trend: The average CO
2
efflux
was higher at higher latitudes. This means that heterotrophic
respiration (from litter and soil organic matter decomposi-
tion) and/or autotrophic respiration (from roots) was greater
544 S. Ishizuka et al.
Figure 5. Relationship between SOC-CO
2
emission potential at 25
◦
C and cellulose content (left) and CMCase (right). Both cellulose contents
and CMCase are the sum per square meter at 15 cm depth.
in cooler climates than in warmer climates. We calculated the
annual CO
2
emission from soil organic carbon (SOC-CO
2
)by
equation (1) using the hourly soil temperature at 5 cm depth
at the site, parameter B in Table III, and CO
2
emission from
soil core incubation. The annual rate of SOC-CO
2
correlated
exponentially with the integrated soil temperature (data not
shown). In addition as the temperature dependency of SOC-
CO
2
emission is greater in cooler climates than in warmer
climates [17], the SOC-CO
2
in cooler climates is expected to
be smaller than the value estimated above. Although the esti-
mated annual amount of SOC-CO
2
was just an approximation,
the SOC-CO
2
in cooler climate is expected to be smaller than
that in warmer climates. Hence it is possible that the trend in
which the average CO
2
efflux was higher at higher latitudes is
caused by the high contribution of litter decomposition and/or
root respiration to the total CO
2
efflux from forest floor in the
cooler climates. Although we did not measure root mass or
respiration in the soil, it is unlikely that root respiration is
higher in cooler climates than in warmer climates, because
gross primary productivity controls the root respiration [15]
and gross primary production in cooler climates tends to be
low [2]. Consequently, because the accumulated mass of the
litter layer is greater in cooler climates than in warmer cli-
mates, it is plausible that the CO
2
emission from litter de-
composition, which is controlled by the quantity and quality
of litter and microbial activity rather than by the temperature,
contributed to the opposite trend in which the average CO
2
ef-
flux was higher at higher latitudes. Another possible explana-
tion for the trend in which the average CO
2
efflux was higher
at higher latitudes is the suppression of CO
2
flux in southern
Japan. Those sites with a relatively lower coefficient of deter-
mination in equation (1) tend to have a low temperature de-
pendency and they tend to distribute more southerly among
our experimental sites. For example, the value of parameter B
in equation (1) was low at KB2, TK, KZ and ST (Tab. III).
This low temperature dependency seems to depend on the fact
that in summer the CO
2
flux does not increase as much as
the increase estimated by soil temperature, because of the low
soil water content (Sakata, unpublished data) – a phenomenon
seen in Mediterranean forest [7, 15]. This variation in soil wa-
ter content among the sites, caused by the change in balance
Figure 6. Correlation between the easily decomposable fraction
(the sum of cool-water-soluble polysaccharides, hot-water-soluble
polysaccharides, hemicellulose, and cellulose) and CMCase activity.
of rainfall and evapotranspiration, could also contribute to the
opposite trend to some extent.
The quality of organic carbon is a crucial factor for deter-
mining CO
2
emission from the soil. The ratio of cellulose to
hemicellulose to lignin was 1:5:17 for 0–15 cm depth. The
low proportion of cellulose indicates that cellulose has already
been decomposed by microorganisms due to its labile charac-
teristics. This is consistent with our finding that CMCase activ-
ity correlates negatively with the amount of easily decompos-
able fractions (i.e. sum of cool-water-soluble polysaccharides
and hot-water- soluble polysaccharides, hemicellulose and cel-
lulose) (Fig. 6). Microorganisms seem to consume these frac-
tions actively. This also suggests that the residual amount of
easily decomposable fractions can be used as an inverse indi-
cator of the emission potential of SOC-CO
2
and that emission
of SOC-CO
2
is not controlled by the substrate availability of
the soil organic carbon.
Global warming is increasing soil temperature, which will
promote CO
2
emission from the soil surface by accelerat-
ing the decomposition of soil organic matter and litter. In the
warmer-climate area, however, the low concentration of eas-
ily decomposable organic carbon in the soil (e.g., HS and OK
CO
2
flux from soil surface in Japan 545
in Fig. 6) and the small amount of soil organic matter suggest
that increases in CO
2
emission will be limited despite soil tem-
perature increases. The hypothesis that increases in CO
2
flux
are limited by the rapid decay of easily decomposable organic
carbon is consistent with previous reports [18, 22]. In addi-
tion, it is important to identify the substrate that directly cor-
relates to potential of SOC-CO
2
emission, because the abun-
dance of that substrate helps us to predict how large the global
warming-related increase in CO
2
emission will be and how
long it will continue. We suggest the possible substrate is cel-
lulose and/or the sum of cool-water-soluble polysaccharides
and hot-water-soluble polysaccharides, hemicellulose and cel-
lulose in the soil. Then it is needed to determine the applicabil-
ity of the index to other latitude gradients and vegetation-soil
patterns.
The sites with lower integrated soil temperature had high
CO
2
flux at 15
◦
C (Fig. 3), which suggests that cool-climate
areas have high potential for CO
2
emission if the temperature
increases. In cool-climate areas, large stocks of easily decom-
posable organic carbon seem to be accumulated not only in
the soil but also in the organic layer. Since the increase in tem-
perature is projected to be greater at higher latitudes [8], the
effects of global warming on the CO
2
efflux from the forest
floor is a particularly serious concern in cooler climates, such
as found at high latitudes and at high altitudes. In contrast to
warmer-climate areas, CO
2
emission is expected to be high for
a considerable period in cool-climate areas if the soil temper-
ature increases from global warming.
The carbon concentration in the soil layer deeper than
15 cm was lower than that in the surface 15-cm soil layer. This
study did not take the deeper soil layer into account in evaluat-
ing the emission of SOC-CO
2
, although the soil carbon in the
deeper layer may be influenced by global warming in the long
term. Because the type of vegetation on the site has changed
over a long time, the carbon source and the characteristics in
the deeper layer might differ from those in the surface layer.
This discrepancy may make it difficult to estimate the influ-
ence of the global warming on the decomposition of the soil
carbon by simple characterization of soil organic matter. The
decomposition of carbon stocks in deeper soil layers should be
evaluated in the future.
5. CONCLUSION
The CO
2
flux from the forest floor within each forest
showed an exponential correlation with the soil tempera-
ture at 5 cm depth at 26 sites in Japan. The annual car-
bon flux ranged from 3.1 to 10.6 Mg C ha
−1
. The southern
Japanese forest showed lower CO
2
efflux than that the north-
ern forests, except for the southernmost subtropical forest. The
CO
2
emission potential derived from the decomposition of
soil organic carbon correlated positively with CMCase activ-
ity, and correlated negatively with cellulose content in the soil.
This suggests that emission of SOC-CO
2
is not controlled by
the substrate availability in Japanese forests. Our results also
suggest that the period in which the CO
2
flux from the for-
est floor would be elevated by global warming would vary
with respected to the amount of easily decomposable organic
carbon in the soil. The period of increasing CO
2
flux will be
somewhat longer in the cooler-climate areas than in warmer-
climate areas due to the large accumulation of easily decom-
posable organic carbon in the soil. This may make cooler-
climate regions more sensitive to CO
2
emissions from forest
floor that result from global warming.
Acknowledgements: This study was supported by the Ministry of
the Environment and Ministry of Agriculture and Forestry and Fish-
eries. We wish to thank Dr. K. Nambu for technical advice on soil
organic analysis and Ms. R. Takeuchi for her experimental assistance.
REFERENCES
[1] Bellamy P.H., Loveland P.J., Bradley R.I., Lark R.M., Kirk G.J.D.,
Carbon losses from all soils across England and Wales 1978–2003,
Nature 437 (2005) 245–248.
[2] Barnes B.V., Zak D.R., Denton S.R., Spurr S.H., Forest Ecology,
4th ed., John Wiley & Sons, Inc., New York, 1998, p. 774.
[3] Berg B., Ekbohm G., Litter mass-loss rates and decomposition pat-
terns in some needle and leaf litter types. Long-term decomposition
in a Scots pine forest, Can. J. Bot. 69 (1991) 1449–1456.
[4] Brink R., Dubach P., Lynch D., Measurement of carbohydrates in
soil hydrolyzates with anthrone, Soil Sci. 89 (1959) 157–166.
[5] Davidson E.A., Trumbore S.E., Amundson R., Soil warming and
organic carbon content, Nature 408 (2000) 789–790.
[6] Day P.R., Particle fractionation and particle-size analysis, in: Black
C.A., Evans D.D., Ensminger L.E., White J.L., Clark F.E. (Eds.),
Methods of Soil Analysis. Part 1 – Physical and Mineralogical
Properties, Including Statistics of Measurement and Sampling,
American Society of Agronomy, Inc., Madison, 1965, pp. 545–567.
[7] Epron D., Ngao J., Granier A., Interannual variation of soil respi-
ration in a beech forest ecosystem over a six-year study, Ann. For.
Sci. 61 (2004) 499–505.
[8] Folland C.K., Karl T.R., Christy J.R., Clarke R.A., Gruza G.V.,
Jouzel J., Mann M.E., Oerlemans J., Salinger M.J., Wang S.W.,
Observed climate variability and change, in: Houghton J.T., Ding
Y., Griggs D.J., Noguer M., van der Linden P.J., Dai X., Maskell K.,
Johnson C.A. (Eds.), Climate Change 2001: The Scientific Basis.
Contribution of Working Group I to the Third Assessment Report
of the Intergovernmental Panel on Climate Change, Cambridge
University Press, Cambridge and New York, 2001, 881 p.
[9] Giardina C.P., Ryan M.G., Evidence that decomposition rates of
organic carbon in mineral soil do not vary with temperature, Nature
404 (2000) 858–861.
[10] Gu L., Post W.M., King A.W., Fast labile carbon turnover obscures
sensitivity of heterotrophic respiration from soil to temperature:
A model analysis, Glob. Biogeochem. Cycles 18 (2004) GB1022,
doi:10.1029/2003GB002119.
[11] Hutchinson G.L., Mosier A.R., Improved soil cover method for field
measurement of nitrous oxide fluxes, Soil Sci. Soc. Am. J. 45 (1981)
311–316.
[12] IPCC, Technical Summary, in: Houghton J.T., Ding Y., Griggs D.J.,
Noguer M., van der Linden P.J., Dai X., Maskell K., Johnson C.A.
(Eds.), Climate Change 2001: The Scientific Basis, Contribution
of Working Group I to the Third Assessment Report of the
Intergovernmental Panel on Climate Change, Cambridge University
Press, Cambridge and New York, 2001, 881 p.
[13] Ishizuka S., Ishizuka K., Improvement of the method of enzyme
activity analysis for the forest soils, Jpn. J. Soil Sci. Plant Nutr. 67
(1996) 190–193.
546 S. Ishizuka et al.
[14] Ishizuka S., Tsuruta H., Murdiyarso D., An intensive field study on
CO
2
,CH
4
and N
2
O emissions and soil properties at four land-use
types in Sumatra, Indonesia, Glob. Biogeochem. Cycles 16 (2002)
1049, doi:10.1029/2001GB001614.
[15] Janssens I.A., Lankreijer H., Matteucci G., Kowalski A.S.,
Buchmann N., Epron D., Pilegaard K., Kutsch W., Longdoz B.,
Grünwald T., Montagnani L., Dore S., Rebmann C., Moors E.J.,
Grelle A., Rannik Ü., Morgenstern K., Oltchev S., Clement R.,
Gudmundsson J., Minerbi S., Berbigier P., Ibrom A., Moncrieff
J., Aubinet M., Bernhofer C., Jensen N.O., Vesala T., Granier A.,
Schulze E.D., Lindroth A., Dolman A.J., Jarvis P.G., Ceulemans
R., Valentini R., Productivity overshadows temperature in determin-
ing soil and ecosystem respiration across European forests, Glob.
Change Biol. 7 (2001) 269–278.
[16] Kirschbaum M.U.F., The temperature dependence of soil organic
matter decomposition, and the effect of global warming on soil or-
ganic C storage, Soil Biol. Biochem. 27 (1995) 753–760.
[17] Kirshbaum M.U.F., Will changes in soil organic carbon act as a pos-
itive or negative feedback on global warming? Biogeochemistry 48
(2000) 21–51.
[18] Melillo J.M., Steudler P.A., Aber J.D., Newkirk K., Lux H., Bowles
F.P., Catricala C., Magill A., Ahrens T., Morrisseau S., Soil warm-
ing and carbon-cycle feedbacks to the climate system, Science 298
(2002) 2173–2176.
[19] Miller G., Golder R., Miller E., Determination of pentoses, Anal.
Chem. 23 (1951) 903–905.
[20] Nambu K., Yonebayashi K., Role of dissolved organic matter in
translocation of nutrient cations from organic layer materials in
coniferous and broad leaf forests, Soil Sci. Plant Nutr. 45 (1999)
307–319.
[21] Pancholy S.K., Rice E.L., Soil enzymes in relation to old field suc-
cession: amylase, cellulase, invertase, dehydrogenase, and urease,
Soil Sci. Soc. Am. Proc. 37 (1973) 47–50.
[22] Rustad L., Matter of time on the prairie, Nature 413 (2001) 578–
579.
[23] Raich J.W., Schlesinger W.H., The global carbon dioxide flux in
soil respiration and its relationship to vegetation and climate, Tellus
44B (1992) 81–99.
[24] Sakata T., Ishizuka S., Takahashi M., A method for measuring
fluxes of greenhouse gases from forest soils, Bull. For. For. Prod.
Res. Inst. 392 (2004) 259–265.
[25] Schlesinger W.H., Carbon balance in terrestrial detritus, Ann. Rev.
Ecol. Syst. 8 (1977) 51–81.
[26] Schlesinger W.H., Andrews J.A., Soil respiration and the global car-
bon cycle, Biogeochemistry 48 (2000) 7–20.
[27] Sinsabaugh R.L., Antibus R.K., Linkins A.E., An enzymic approach
to the analysis of microbial activity during plant litter decomposi-
tion, Agric. Ecosyst. Environ. 34 (1991) 43–54.
[28] Somogyi M., Notes on sugar determination, J. Biol. Chem. 195
(1952) 19–23.
[29] Stevenson F., Gross chemical fractionation of organic matter, in:
Black C. (Ed.), Methods of Soil Analysis, Part 2, Chemical and
Microbiological Properties, American Society of Agronomy Inc.,
Madison, 1965, 1409–1421.
[30] Tabatabai M.A., Soil enzymes, in: Weaver R.W. et al. (Ed.),
Methods of Soil Analysis. Part 2 – Microbiological and
Biochemical Properties, Soil Science Society of America Inc.,
Madison, 1994, pp. 775–833.
[31] Trumbore S.E., Chadwick O.A., Amundson R., Rapid exchange be-
tween soil carbon and atmospheric carbon dioxide driven by tem-
perature change, Science 272 (1996) 393–396.
[32] Trumbore S.E., Age of soil organic matter and soil respiration: ra-
diocarbon constraints on belowground C dynamics, Ecol. Appl. 10
(2000) 399–411.
[33] Valentini R., Matteucci G., Dolman A.J., Schulze E D., Rebmann
C., Moors E.J., Granier A., Gross P., Jensen N.O., Pilegaard K.,
Lindroth A., Grelle A., Bernhofer C., Grunwald T., Aubinet M.,
Ceulemans R., Kowalski A.S., Vesala T., Rannik U., Berbigier
P., Loustau D., Gudmundsson J., Thorgeirsson H., Ibrom A.,
Morgenstern K., Clement R., Moncrieff J., Montagnani L., Minerbi
S., Jarvis P.G., Respiration as the main determinant of carbon bal-
ance in European forests, Nature 404 (2000) 861–865.
[34] Vance E.D., Brooks P.C., Jenkinson D.S., An extracted method for
measuring soil microbial biomass C, Soil Biol. Biochem. 19 (1987)
703–707.
To access this journal online:
www.edpsciences.org