Nonlinear Microwave Circuit Design phần 10 potx
Bạn đang xem bản rút gọn của tài liệu. Xem và tải ngay bản đầy đủ của tài liệu tại đây (517.75 KB, 44 trang )
NONLINEAR ANALYSIS, STABILITY AND BIFURCATIONS 349
loads at the relevant frequencies can be chosen so to satisfy Barkhausen’s criterion or
the instability criterion as defined in Section 5.2. If the stability factor is greater than 1,
then the large-signal state must be modified, for example, by increasing the amplitude of
the large-signal source, or the bias point, or the loads at harmonic frequencies, in order
to enhance the mixing properties of the active device in large-signal regime.
If the design is performed at two ports at different frequencies, the potential stability
of the reduced network may be caused by the frequency-converting (out of diagonal) terms
in the conversion matrix, which connect the input and the output of the network; if this is
the case, the potential instability vanishes for decreasing amplitude of the large periodic
signal at ω
0
, since no frequency conversion takes place for a small amplitude of the local
oscillator. The instability appears only for a sufficiently large amplitude of the periodic
large signal.
In the opposite case that instability must be avoided, the loads of the two-port
network must be chosen so that the circuit is stable for all perturbation frequencies
0 <ω
osc
< ∞, very much as in linear amplifiers. This approach is quite general, but
requires a modified formulation in the case that ω
osc
=
ω
0
2
, because of the coincidence
of upper and lower sidebands [6].
8.3 NONLINEAR ANALYSIS, STABILITY AND BIFURCATIONS
8.3.1 Stability and Bifurcations
In this paragraph, the parametric analysis of nonlinear circuits is introduced, which allows
the detection of bifurcations and the determination of the stable and unstable regions of
operations of the circuit.
In the previous paragraph, a criterion for the determination of the stability of a
nonlinear regime has been described. The reason why this criterion has been introduced
lies in the capability of the harmonic or spectral balance algorithm to yield a solution,
even if the solution itself is not stable. A basic assumption of harmonic balance algorithms
(see Section 1.3.2) is that the signal must be expanded in Fourier series, with one or more
fundamental frequencies. If the actual solution includes any additional real or complex
basic frequency, but this is not included in the expansion, the algorithm does not detect
it. The solution, if any, is only mathematical, being physically unstable. A time-domain
analysis on the other hand will not yield any unstable solution, always preferring the
stable one. Therefore, harmonic balance analysis always requires a stability verification,
typically of the Nykvist type. However, the possibility to find unstable solutions allows
the designer to get a complete picture of the behaviour of the circuit.
A particularly illuminating approach requires the tracking of a solution as a function
of a parameter of the circuit. In many cases, the value of a bias voltage or of an element
of the circuit may determine the behaviour of the circuit, whether stable or not. By
changing the value and checking the stability properties of the solution, the operating
regions of the circuit are found. It is particularly important to detect the values of the
parameter at which a stable solution becomes unstable, or vice versa. These particular
350 STABILITY AND INJECTION-LOCKED CIRCUITS
values are called bifurcations because two solutions are found after the bifurcation, one
of which is usually unstable.
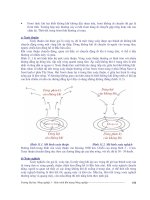
As an example, let us consider again the shunt oscillator in Figure 5.6 in Chapter 5,
which is repeated here in Figure 8.5. Let us consider the behaviour of the solution as a
function of the parameter G
tot
= G
s
+ G
d
, that is, of the total conductance; we will first
consider the linear solution.
Kirchhoff’s equation for the circuit is
1
L
·
v(t) ·t + G · v(t) +C ·
dv(t)
dt
= 0 (8.24)
The equation always has the trivial solution v
DC
(t) = 0; it also has the non-trivial solution:
v
osc
(t) = v
1
· e
(α+jω)·t
+ v
2
· e
(α−jω)·t
α =−
G
tot
2C
ω =
G
tot
2C
2
−
1
LC
if G
tot
< 2 ·
C
L
(8.25a)
v
osc
(t) = v
1
· e
−α
1
·t
+ v
2
· e
−α
2
·t
α
1
=−
G
tot
2C
+
G
tot
2C
2
−
1
LC
α
2
=−
G
tot
2C
−
G
tot
2C
2
−
1
LC
if G
tot
> 2 ·
C
L
(8.25b)
It easy to see that for G
tot
< 0 an oscillatory solution growing in time is present; in this
case, the DC solution is not stable, which is only mathematically possible. For positive
values of the total conductance G
tot
, a damped oscillatory solution or two exponentially
decaying solutions are present in the circuit, indicating the stability of the DC solution.
The values of the total conductance for which the nature of the solutions changes is
the origin (G
tot
= 0); an additional change takes place for G
tot
= 2 ·
C
L
, but no stable
solution is involved in the change, which is not observable in steady-state conditions.
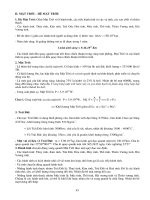
The root locus can be plotted as in Figure 8.6.
G
s
G
d
C
s
L
s
v
(
t
)
+
−
Figure 8.5 A parallel resonant circuit
NONLINEAR ANALYSIS, STABILITY AND BIFURCATIONS 351
j
w
G
tot
= 0
G
tot
= 0
G
tot
< 0
G
tot
< 0
G
tot
= 2
C
L
a
Figure 8.6 Root locus for the parallel resonant circuit in Figure 8.5
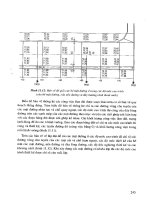
Correspondingly, the value of an electrical quantity in the circuit may be plotted as
a function of the parameter; for instance, let us a ssume that the amplitude of the oscillation
saturates to a finite value because of the nonlinearities of the circuit, so far neglected for
stability analysis. Therefore, a plot of the amplitude of the oscillating voltage in the
parallel resonant circuit after the oscillations have reached the equilibrium amplitude (see
Section 5.3) looks as shown in Figure 8.7.
For G
tot
> 0, eq. (8.24) has only one solution, which is the stable DC solution
with v
osc
(t) = 0. For G
tot
< 0, eq. (8.24) has two solutions, of which the DC one with
v
osc
(t) = 0 is only mathematical because it is unstable, while the other with v
osc
(t) > 0
is stable. The point G
tot
= 0 is a bifurcation point. In this case, the generation of a
new branch is caused by the sign change of the real part of the complex roots of the
perturbation equation (8.24), or in other words by the onset of an autonomous oscillation;
this is called a Hopf bifurcation. Other types of bifurcation are described below.
The circuit in Figure 8.5 becomes closer to real life if we consider it as the
linearisation of a circuit including an active device, exhibiting a negative differential
(small-signal) conductance in a given bias point range. By changing the bias, the total
conductance may change sign and quench the oscillations. Therefore, the parameter that
controls the bifurcation may be the bias voltage of the active device, for example, a
tunnel diode.
Another example of control parameter is the gate bias voltage of an FET oscillator
as described in Section 5.4, and shown in Figure 8.8.
The condition for the onset of the oscillation is
A(P
in
= 0) · β>1 (8.26)
352 STABILITY AND INJECTION-LOCKED CIRCUITS
v
osc
> 0
v
osc
= 0
v
osc
= 0
v
osc
G
tot
Figure 8.7 Amplitude of the oscillating voltage in the parallel resonant circuit in Figure 8.5
P
f
= b −
P
out
P
out
=
A
−
P
in
P
in
= P
f
b
A
Figure 8.8 An oscillator based on an amplifier and a feedback network
If condition (8.26) is satisfied, the amplitude of the oscillation grows until the oscillation
condition at equilibrium is fulfilled.
A(P
0
) · β = 1 (8.27)
The equilibrium is reached because the transistor has a gain compression for increas-
ing operating power (see Section 5.3). The small-signal gain of the amplifier is usually
NONLINEAR ANALYSIS, STABILITY AND BIFURCATIONS 353
controlled by the gate bias voltage, which therefore determines whether the condition
for the onset of the oscillations is fulfilled or not, and the equilibrium operating power
changes accordingly (Figure 8.9). The bifurcation diagram for the gate bias voltage is
shown in Figure 8.10. The gate bias voltage has the same qualitative behaviour as shown
in Figure 8.7.
Let us now treat the case in which the amplifier is biased near Class-B and the
transistor has a transconductance increase for increasing gate bias voltage; the amplifier
therefore exhibits a gain expansion at low input power, then a gain compression for
higher input power when the limiting nonlinearities (forward gate junction conduction,
breakdown, etc.) come into play (Figure 8.11).
This case lends itself to illustrating a different type of bifurcation; in the following,
reference is made to Figures 8.11 and 8.12. Let us start the analysis with a gate bias
A
A
1
b
V
gs
=−3.5 V
V
gs
=−3 V
V
gs
=−2.5 V
V
gs
=−2 V
V
gs
=−1.5 V
B
C
D
P
1
P
2
P
3
P
in
Figure 8.9 Power gain of an amplifier as a function of input power for different bias gate voltages,
compared to the inverse of the attenuation of the feedback network
A
B
C
D
P
in,0
−3.5 V −3 V −2.5 V −2 V −1.5 V
V
gs
P
3
P
2
P
1
Figure 8.10 Bifurcation diagram for a feedback oscillator with the gate bias voltage as a control
parameter; letters refer to points in Figure 8.9
354 STABILITY AND INJECTION-LOCKED CIRCUITS
1
b
BC
D
E
F
A
A
V
gs
= −2V
V
gs
= −1.5 V
V
gs
= −2.5 V
V
gs
= −3V
V
gs
= −3.5 V
P
1
P
2
P
3
P
4
P
5
P
in
Figure 8.11 Power gain of an amplifier with gain expansion as a function of input power for
different bias gate voltages, compared to the inverse of the attenuation of the feedback network
C
−3.5 V −3 V −2.5 V −2 V −1.5 V
V
gs
D
B
A
E
F
P
in,0
P
5
P
4
P
3
P
2
P
1
Figure 8.12 Bifurcation diagram for a feedback oscillator with the gate bias voltage as a control
parameter when the amplifier has gain expansion; letters refer to points in Figure 8.11
voltage V
gs
=−3.5 V; no oscillations are present in the circuit, which remains in the
DC state. Then, let us increase the gate bias voltage; the small-signal condition for the
onset of oscillation (8.26) is fulfilled for V
gs
=−2 V, corresponding to point A, where
also the equilibrium condition (8.27) is fulfilled. However, this equilibrium point is not
stable, as described in Section 5.3. After a transient, the other equilibrium point E, which
is reached is stable. If the gate bias voltage is further increased, the oscillation amplitude
increases reaching point F and beyond.
Let us now come back towards decreasing gate bias voltages while the circuit
is still oscillating. From point F, point E is first reached when V
gs
=−2 V. Then, a
further decrease of the gate bias voltage does not quench the oscillation, since a stable
NONLINEAR ANALYSIS, STABILITY AND BIFURCATIONS 355
equilibrium exists, that is, point D for V
gs
=−2.5 V. The circuit oscillates even though
the small-signal start-up condition is not fulfilled, since the oscillation had started at
higher gate bias voltages. Continuing along the path for decreasing leads the circuit to
point C for V
gs
=−3 V, where the oscillation is stopped. The path from point C to point
A through point B is only mathematical, since point B and all other points along the path
are unstable equilibrium points. The oscillator then exhibits hysteresis in its behaviour
when the gate bias voltage is swept from pinch-off towards open channel and vice versa.
The bifurcation point C is called a turning-point or direct-type bifurcation; the
bifurcation point A at which an unstable branch departs is a subcritical Hopf bifurcation,
while the Hopf bifurcation described above (see point A in Figure 8.10) that gives rise to
a stable oscillation is called supercritical. At the turning point C, coming from the point
D and continuing towards point B, a real Laplace parameter, solution of the stability
equation (8.21) becomes positive, causing the amplitude of the oscillating solution to
grow in time, reaching the stable branch with larger oscillation amplitude near point
Dagain.
Bifurcations may be encountered also when a parameter is changed in a periodic
large-signal steady state. A method for the determination of the stability of a periodic
steady state has been described in the previous paragraph, and a procedure for the design
of an instability has also been introduced; both are based on the conversion matrix. When
a parameter of the circuit changes in such a way that the circuit starts oscillating at a
frequency different from that of the large signal, a secondary Hopf bifurcation takes
place, either supercritical or subcritical. If the frequency of the instability is one half
that of the periodic steady state, the bifurcation is called a flip or indirect or period-
doubling bifurcation; this is normally encountered in regenerative frequency dividers (see
Section 6.4). A typical bifurcation diagram is shown in Figure 8.13, where the amplitude
of both the fundamental frequency and subharmonic frequency of order two are plotted
versus the input power of the frequency divider at fundamental frequency ω
0
.When
the input power is P
I
, the conditions for a subharmonic of order two with ω =
ω
0
2
to exist are fulfilled, and the two signals coexist within the circuit; the amplitude of the
output signal at fundamental frequency decreases because of the simultaneous presence of
another signal at one-half this frequency. If the subharmonic is not detected, the unstable
solution with only the fundamental-frequency signal is found; this is only a mathematical
solution, as said before. Similar plots are found for secondary Hopf bifurcations, where
the second branch represents a signal with a frequency different from the period-doubling
subharmonic. Turning points or direct-type bifurcations are also found in periodic regimes,
with similar characteristics as seen above for the stability of DC regimes. Other types of
bifurcations can be encountered in a nonlinear system [7], which are not described here,
as they are less common to be found in practical circuits.
It is not unusual that successive bifurcations are encountered along the branches of
a bifurcation diagram. This mechanism usually leads to chaotic behaviour of the circuit
for higher values of the controlling parameter. A chaotic system is not a system with
random solutions, strictly speaking: it is a system where two solutions starting from two
initial points lying very close to one another diverge from one another. It is possible to
identify the characteristics of a nonlinear system that leads to chaotic behaviour [8, 9];
356 STABILITY AND INJECTION-LOCKED CIRCUITS
P
out
P
out
(w
0
)
P
out
P
l
P
in
(w
0
)
w
0
2
Figure 8.13 Bifurcation diagram vs input power for a regenerative frequency divider; the unstable
branch is the dotted line, while the stable branches are the dashed lines
however, this is not the object of this description, as chaotic systems have not so far
found any established application in electronic systems.
Other examples of bifurcations are described below, in Section 8.4.
8.3.2 Nonlinear Algorithms for Stability Analysis
In this paragraph, the nonlinear algorithms for the analysis of nonlinear circuits with
autonomous oscillations and external excitation are described.
Circuits where an oscillation coexists with a forced periodic state are, in principle,
quite naturally analysed by means of time-domain algorithms. No special modification is
required in the formulation of the algorithm with respect to the analysis of autonomous
circuits; however, the considerations made both for the case of two-tone analysis and for
the case of oscillator analysis hold.
It is worth repeating, however, that the time-domain analysis always yields a sta-
ble solution, that is, the solution actually present in the circuit; moreover, the transient
behaviour is correctly found. This is important, especially in the cases in which the state
actually reached by the circuit is uncertain because of the presence of possible instabilities.
Harmonic or spectral balance is another viable method for this case. Formally, the
electrical quantities are expressed as in the case of a two-tone analysis (see Chapter 1),
with the first frequency being that of the external signal source ω
ext
and the second being
that of the oscillating signal ω
osc
; in this case, the second basis frequency is unknown and
must be added to the vector of the unknowns of the problem; however, the phase of the
oscillation is undetermined and can be set to zero (see Chapter 5). Therefore, the number
of unknowns is again equal to the number of equations, and the system can be solved by
a numerical procedure. The problem always has a trivial solution, where the amplitudes
of all phasors relative to the second basis frequency ω
osc
and of the intermodulation
NONLINEAR ANALYSIS, STABILITY AND BIFURCATIONS 357
frequencies n
ext
ω
ext
+ n
osc
ω
osc
are zero, corresponding to absence of oscillation. This
solution can be real or can be unstable and only mathematical. With the aid of the same
procedures as those described for oscillator analysis, the trivial solution can be avoided.
For example, a port of the circuit where non-zero amplitude of the signal is expected
to appear at the oscillation frequency is selected. Then, Kirchhoff’s equation at that port
and frequency can be replaced by the Kurokawa condition:
Y(ω
osc
) =
I(ω
osc
)
V(ω
osc
)
= 0 (8.28)
Alternatively, Kirchhoff’s equations at all nodes and frequencies can be rewritten as
I
L
(V
n
osc
) + I
NL
(V
n
osc
)
n
|V
n
osc
|
2
= 0 (8.29)
Both the approaches remove the trivial solution, being in fact extensions of the previously
described methods.
An alternative point of view that is an extension of that illustrated in Figure 5.23
in Section 5.5 is now described [10]. A probing voltage or current at frequency ω is intro-
duced at a single port of the nonlinear circuit driven by the large signal at frequency ω
0
(Figure 8.14). The nonlinear circuit is analysed by means of a non-autonomous, two-tone
harmonic or spectral balance algorithm. Frequency and amplitude of the probing signal
are swept within a suitable range; an oscillation is detected when the control quantity (the
probing current or voltage respectively) is zero, indicating that an autonomous oscillating
signal is present in the circuit and that the removal of the probing signal does not perturb
the circuit.
+
−
V
LO
(w
0
)
+
−
V
probe
(w)
Z
(w) = 0
Z
(
n
w) =∞
Z
(
k
w
0
) =∞
I
control
(w)
Z
L
Nonlinear circuit
+
−
V
LO
(w
0
)
+
+
−
−
I
probe
(w)
V
control
(w)
Y
(w) = 0
Y
(
n
w) =∞
Y
(
k
w
0
) =∞
Z
L
Nonlinear circuit
Figure 8.14 Voltage and current probes for instability detection
358 STABILITY AND INJECTION-LOCKED CIRCUITS
A filter ‘masks’ the presence of the probe at all other frequency components;
we remark that harmonics of the probing frequency ω canbepresent,sinceatwo-
tone harmonic or spectral balance analysis is performed, and arbitrary amplitude of the
probing tone is accounted for. As seen in the case of oscillators, both probing amplitude
and frequency are apriori unknown; they are found from the real and imaginary parts
of either of the following complex equations:
I
probe
(V
probe
,ω)= 0orV
probe
(I
probe
,ω) = 0 (8.30)
Quite naturally, the same problems in identifying a suitable starting point for easing
the convergence of the analysis are present in this case also.
Volterra analysis could be used for this type of analysis; however, the authors are
not aware of such an algorithm being proposed so far.
The methods described have been extensively used for the analysis of two-tone
mixed autonomous/non-autonomous circuits, and in particular, they have been used for the
determination of the bifurcation diagram of the circuits. To achieve this goal, continuation
methods are applied, in order to ‘follow’ the solution of the circuit as a parameter is
varied and to detect the qualitative changes in its behaviour at bifurcation points [11–13].
As stated above in Section 8.3.2, the harmonic balance method can also find unstable
solutions and is therefore ideal for a complete study of the behaviour of a circuit; however,
the stability of branches or solutions must be verified. In general, this is straightforwardly
done by application of Nykvist’s stability criterion as described above.
The analysis along a branch of the bifurcation diagram requires, in principle, simply
the repeated application of the methods described above, as the value of the parameter is
varied. However, problems arise both at turning points and at Hopf bifurcations. Referring
to Figure 8.12, the diagram is, in principle, computed by selecting the gate bias voltage
V
gs
as a parameter, and the input power to the FET as one of the problem unknowns
that identifies the branch. However, near the turning point C, the curve becomes multi-
valued, and numerical problems arise. When the turning point is approached, therefore,
it is advantageous to switch the role of the two axes in the plot, use the amplitude of a
given frequency component at a given port (e.g. the fundamental-frequency component at
the gate port, related to the input power) as a parameter and set the gate bias voltage as a
problem unknown. This requires a modification of the analysis algorithm, as sketched in
Section 5.5. The analysis then gets through the turning point, and the whole branch can be
followed. The approaching of the turning-point bifurcation can be detected by inspection
or automatically by monitoring the quantity
dP
out
dV
gs
, and setting a maximum value for it.
At the turning point, the derivative becomes infinite. The two quantities can be switched
back to the original role when the derivative becomes reasonably small again.
Another problem arises when a Hopf of a flip bifurcation is encountered along a
branch. Referring to Figure 8.13 for a frequency divider-by-two, the diagram is plotted by
starting from a low input power, where the solution is quasi-linear and no subharmonic
is present; the solution is a Fourier expansion on the basis frequency ω
0
. When the
input power P
I
is reached by stepping the input power, a second branch appears on the
INJECTION LOCKING 359
diagram, representing a frequency-dividing solution, with power at frequency ω
0
and also
at frequency
ω
0
2
; however, the previous type of solution is also present as a continuation
of the branch, but becomes unstable. Therefore, if the bifurcation is not detected on
the way, the stable branch is overlooked and a non-physical result is found. A natural
approach consists of monitoring the stability of the solution at the stepping values of the
parameter by checking Nykvist’s plot. After P
I
, the solution becomes unstable, indicating
that a bifurcation is present at a lower power (Figure 8.15).
The bifurcation can be accurately located, and the frequency of the new fre-
quency component approximately determined, by repeating Nykvist’s analysis in smaller
steps around P
I
, until a sufficient approximation is obtained. Then, the stable branch is
followed by an analysis with a basis frequency ω =
ω
0
2
, which includes the frequency-
divided component.
The bifurcation can be directly located in a way similar to what has been described
above, once the frequency of the new branch is known from a Nykvist’s plot. For a flip-
type bifurcation, an analysis based on the frequency ω =
ω
0
2
is performed, where the
amplitude of the frequency-divided component is set to a very small value and therefore
is no more an unknown, while the amplitude of the fundamental-frequency component at
the bifurcation, which is related to the input power P
I
at ω
0
, is unknown. In this way, the
bifurcation is located with a single analysis. If the bifurcation is a Hopf-type one, where
the frequency of the autonomous oscillation is not exactly known but only approximately
determined from Nykvist’s plot (Figure 8.15), the autonomous frequency is included in
the vector of the unknowns, while the phase of the relevant phasor is arbitrarily set to a
fixed value, for example, zero. The input power at the bifurcation and the autonomous
frequency are therefore simultaneously determined. Obviously, a good starting point must
be used for all these analyses, given the critical behaviour of the circuits.
8.4 INJECTION LOCKING
In this paragraph, some circuits using injection locking of self-oscillating signals for oscil-
lation synchronisation or for frequency multiplication or division are described.
Injection locking is a nonlinear mechanism that synchronises a free oscillation in a
circuit to an externally injected signal. In a linear circuit, signals at different frequencies
are independent and coexist in the same circuit without interaction. In a nonlinear circuit,
that is, in all practical active circuits, an injected signal interacts with the nonlinear active
device, locking the free oscillation frequency to that of the external signal, provided that
some conditions are fulfilled. In case the conditions are not fulfilled, either the two signals
coexist in the circuit or the injected one suppresses the free oscillations that disappear
altogether. In the following, the basic conditions for injection locking are given, and
an overview of the typical behaviour of an injected oscillator will be given, with some
applications.
Let us consider a generic oscillating circuit similar to that in Figure 5.13 of
Chapter 5, with an added injected signal (Figure 8.16) [14–17]. Let us assume that
360 STABILITY AND INJECTION-LOCKED CIRCUITS
300
330
0
30
60
90
120
150
180
210
240
270
0
2
4
6
8
300
330
0
30
60
90
120
150
180
210
240
270
0
2
4
6
8
Figure 8.15 Nykvist’s plots before (stable solution) and after (unstable solution) the bifurca-
tion point
eq. (5.60a) holds.
Y
s
+ Y
d
= Y
tot
(A
0
,ω
0
) = 0 (8.31)
The network oscillates at frequency ω
0
with an amplitude A
0
when no signal is injected,
that is, it is a free-running oscillator. If the frequency of the injected signal is close to that
INJECTION LOCKING 361
Y
S
Y
D
+
−
V
i
inj
(
t
)
Figure 8.16 An oscillating circuit with an injected signal
of the free-running oscillator, and therefore we assume that the amplitude and frequency
of the oscillation will be perturbed to a small extent:
A
∼
=
A
0
+ A s
∼
=
α +j(ω
0
+ ω) (8.32)
we can expand the total admittance in Taylor series as in eq. (5.62):
Y
tot
(A, s)
∼
=
Y
tot
(A
0
,jω
0
) +
∂Y
tot
(A, s)
∂A
A=A
0
s=jω
0
· A +
∂Y
tot
(A, s)
∂s
A=A
0
s=jω
0
· s +
(8.33)
Remembering eq. (8.31), Kirchhoff’s equation now reads as
I
inj
+
∂Y
tot
∂A
· A +
∂Y
tot
∂ω
· ω
· (A
0
+ A) = 0 (8.34)
where we have assumed steady state, where I
inj
is a complex phasor and where the
derivatives are computed at the free-running amplitude and frequency. Neglecting higher-
order terms,
I
inj
+
∂Y
tot
∂A
· A +
∂Y
tot
∂ω
· ω
· A
0
= 0 (8.35)
from which (see Appendix A.11) we can compute the maximum locking range:
|ω|
max
=
|I
inj
|
A
0
·
∂Y
∂A
∂Y
r
∂ω
·
∂Y
i
∂A
−
∂Y
i
∂ω
·
∂Y
r
∂A
(8.36)
This formula tells us some interesting information on the attitude of a circuit
to be locked and on the locking range. First of all, the locking range is proportional
to the amplitude of the injected signal, as intuition suggests. Then, it is apparent that
the denominator of eq. (8.36) is the same as in eq. (5.69). This term is related to the
stability of the free-running oscillator: the larger the amplitude of this term the more
stable the free-running oscillator; also, the narrower is its locking range, as intuition
suggests as well.
362 STABILITY AND INJECTION-LOCKED CIRCUITS
Similarly (see Appendix A.11), we can compute the maximum variation of the
amplitude of the oscillation in injection-locked operations:
|A|
max
=
|I
inj
|
A
0
·
∂Y
∂ω
∂Y
r
∂ω
·
∂Y
i
∂A
−
∂Y
i
∂ω
·
∂Y
r
∂A
(8.37)
From this expression, we see that the amplitude of the locked oscillation is proportional
to the relative amplitude of the locking signal; the sensitivity is inversely proportional
to the stability of the free-running oscillation, again as intuition suggests. Therefore,
with a suitable choice of the parameters, the injection-locked oscillator can behave as
an amplifier.
As an example, let us consider a simple parallel resonant circuit with an injected
signal (Figure 8.17).
The locking range is (eq. (5.96))
|ω|
max
∼
=
|I
inj
|
A
0
·
∂G
s
∂A
·
1
C ·
∂G
s
∂A
=
|I
inj
|
A
0
·
1
C
(8.38)
If we normalise the locking range to the free-running oscillation frequency, we get
|ω|
max
ω
0
∼
=
|I
inj
|
A
0
·
1
ω
0
C
(8.39)
The larger the tank the narrower the lockin g range. If we plot the relative amplitude of
the locking signal as a function of the normalised locking range, we get a plot as in
Figure 8.18 (in logarithmic scale), which is typical of the locking phenomenon.
From eq. (8.37), we compute the dependence of the amplitude on the input signal:
|A|
max
∼
=
|I
inj
|
A
0
· C ·
1
C ·
∂G
s
∂A
=
|I
inj
|
A
0
·
1
∂G
s
∂A
(8.40)
G
s
C
s
G
d
L
s
v
(
t
)
i
inj
(
t
)
+
−
Figure 8.17 A parallel resonant circuit with an injected signal
INJECTION LOCKING 363
0
−10
−20
−30
−40
−50
−60
−70
10
−1.5 −0.5 0 0.5 1 1.5 2−1−2
Figure 8.18 Relative amplitude of the locking signal as a function of the normalised locking
range (in logarithmic scale)
where the derivative of the conductance of the active device with respect to the amplitude
of the oscillation can be evaluated from the plot in Figure 5.16. This equation tells us that
the smaller the sensitivity of the negative conductance to the amplitude of the applied
signal the larger the sensitivity of the oscillation to the amplitude of the locking signal.
In fact, the plot in Figure 8.18 deserves a more detailed description. First of all,
it must be remarked that eq. (8.37) is valid for small variations of the amplitude and
frequency of oscillation with respect to the free-running values. Therefore, for large
values of the input signal, the calculations do not hold any more, and different phenomena
arise. Then, we consider the behaviour of the circuit in different regions of the plot in
Figure 8.19.
As stated above, for small amplitudes of the input signal the curve as in Figure 8.18
determines the boundary between locked operations and free-running oscillations super-
imposed to the input signal. This last operating mode has, in fact, a spectrum similar
to that of a mixer, since both the free-running frequency and the input signal frequency
coexist within the (nonlinear) circuit; however, the local oscillator frequency is generated
within the circuit itself, as a free-running oscillation, and no external local oscillator is
required. This circuit is usually called self-oscillating mixer. Within the locking range,
the oscillator behaves, in fact, as an amplifier if the parameters are suitably chosen; as
such, it is used for amplification or signal generation, especially at high frequency where
a powerful but noisy oscillating device (e.g. an IMPATT diode) is frequency locked by a
cleaner but smaller signal.
If the input signal is very large, however, it saturates the nonlinear device, and no
free-running or injection-locked oscillation takes place. The instability is suppressed by
364 STABILITY AND INJECTION-LOCKED CIRCUITS
0
−10
−20
−30
−40
−50
−60
−70
10
−1.5 −0.5 0 0.5 1 1.5 2−1−2
Frequency
locking
Self-oscillating mixerSelf-oscillating mixer
Suppression of free-running oscillations
Figure 8.19 Operating regions of an injection-locked oscillator/self-oscillating mixer
the large applied signal, and the circuit behaves as a single-tone nonlinear system. This
is true at all frequencies, provided that the input signal is large enough.
It must be said that the picture described so far is somewhat oversimplified. In fact,
transitions between the regions can show complicated behaviours, involving bifurcations
of different types [7], as those described above in Section 8.3.1; however, the general
behaviour is as described.
It is clear from what has been said that self-oscillating mixers and injection-locked
oscillators must be designed in different ways. The design of self-oscillating mixers must
be such as to minimise the influence of the input signal on the frequency of the free-
running oscillation, in order not to affect the converted frequency. This is obtained by
increasing the quality factor of the resonator; as an illustration, the locking range of a
simple parallel resonant circuit is shown in Figure 8.20. The free-running frequency is
1 GHz in both cases, but the capacitance is 10 pF in the case of the larger locking range
and C = 100 pF for the narrower locking range. In a practical application, the oscillation
frequency is stabilised by means of a DRO; a possible scheme including a series feedback
(see Chapter 5) is shown in Figure 8.21.
The transistor should be biased near Class-B in order that the input signal drives
the transistor itself in nonlinear behaviour, for efficient mixing. If suitably designed, such
a circuit can exhibit conversion gain, at the expenses of the bias supply, and minimise
the circuitry with respect to traditional mixers with external local oscillator. However,
frequency stability is somehow more problematic, as it is affected by pulling from the
input signal, even if stabilisation by means of a dielectric resonator does a lot to reduce
the problem.
INJECTION LOCKING 365
0
−10
−20
−30
−40
−50
−60
10
−1.5 −0.5 0 0.5 1 1.5 2−1−2
Figure 8.20 Relative amplitude of the locking signal as a function of the normalised locking
range (in logarithmic scale) for two different quality factors of the resonator
Z
s
Z
d
Z
f
In
Z
o
DR
Figure 8.21 A series-feedback scheme for a self-oscillating mixer based on a DRO
An interesting extension of the concepts described allows the design of a special
type of frequency multipliers and dividers that is based on the injection locking by
means of harmonics of the input signal and free-running oscillation. In particular, a
non-regenerative frequency divider is obtained by locking the second harmonic of the
free-running oscillator by means of the fundamental frequency of the input signal [18].
The general scheme looks somewhat similar to that of regenerative frequency dividers
(Figure 8.22).
However, the circuit oscillates at, or more precisely near,
ω
0
2
when the input signal
is not present or is very small. When the amplitude and frequency of the input signal are
366 STABILITY AND INJECTION-LOCKED CIRCUITS
Bandpass and
matching at w
0
Bandpass and
matching at w
0
/2
Z
f
In(w
0
)
Z
o
Figure 8.22 A qualitative scheme of a frequency divider-by-two based on a free-running oscillator
at
ω
2
0
−10
−20
−30
−40
−50
−60
−70
10
−1.5 −0.5 0 0.5 1 1.5 2−1−2
Injection-locked
frequency
division-by-two
Self-oscillating
subharmonic mixer
Self-oscillating
subharmonic mixer
Regenerative
frequency
division-by-two
Suppression of free-running oscillations
Figure 8.23 Operating regions of a non-regenerative frequency divider-by-two/self-oscillating
subharmonic mixer
such that the second harmonic of the free-running oscillator is locked by the input signal,
perfect division-by-two is performed by the circuit. The relevant operating regions are
shown in Figure 8.23.
If the frequency of the input signal is close to the second harmonic of the free-
running oscillation and the amplitude is rather large, the circuit behaves as a regenerative
frequency divider rather than as an injection-locked oscillator. The nonlinearity of the
active device acts as in regenerative frequency dividers (see Section 6.4). For even higher
amplitudes of the input signal and/or greater frequency difference, the free-running oscil-
lation is suppressed, and the circuit has a single-tone behaviour at ω
0
. If the amplitude
INJECTION LOCKING 367
of the input signal is small or moderate but its frequency lies outside of the locking
range, the circuit behaves as a self-oscillating subharmonic mixer (see Chapter 7). In this
case, the free-running oscillation frequency must be stabilised, for example, by means
of a dielectric resonator, in order to avoid frequency pulling by the injected signal. A
qualitative scheme is shown in Figure 8.24 for a series-feedback free-running oscillator.
Similar considerations are made for non-regenerative injection-locked frequency
multipliers: in this case, the second harmonic of the input signal locks the free-running
oscillation. A qualitative picture of the operating regions is given in Figure 8.25.
An interesting feature of the injection-locking frequency multiplier is the combina-
tion of output power supplied by the (presumably) noisy oscillator and frequency control
Bandpass and
matching at w
in
Bandpass and
matching at 2w
0
±w
in
Z
f
In(w
in
)
Z
o
Z
s
DR
Figure 8.24 A qualitative scheme of a self-oscillating subharmonic mixer
0
−10
−20
−30
−40
−50
−60
−70
10
−1.5 −0.5 0 0.5 1 1.5 2−1−2
Injection-locked
frequency
multiplication-by-two
Self-oscillating
subharmonic mixer
Self-oscillating
subharmonic mixer
Regenerative
frequency
multiplication-by-two
Suppression of free-running oscillations
Figure 8.25 Operating regions for a non-regenerative frequency multiplier-by-two/self-oscillating
harmonic mixer
368 STABILITY AND INJECTION-LOCKED CIRCUITS
Bandpass and
matching at w
0
Bandpass and
matching at 2w
0
Z
f
In(w
0
)
Z
o
Figure 8.26 A frequency multiplier-by-two based on a free-running oscillator at 2 ω
Bandpass and
matching at w
in
Bandpass and
matching at w
0
+2w
in
Z
f
In(w
in
)
Z
o
Z
s
DR
Figure 8.27 A qualitative scheme of a self-oscillating harmonic mixer
by means of a cleaner locking signal at lower frequency. A qualitative scheme is shown
in Figure 8.26.
Similarly, a self-oscillating harmonic mixer has a qualitative scheme as in Figure
8.27.
8.5 BIBLIOGRAPHY
[1] R. Grimshaw, Nonlinear Ordinary Differential Equations, CRC Press, Boca Raton (FL), USA,
1993.
[2] T.S. Parker, L.O. Chua, Practical Numerical Algorithms for Chaotic Systems, Springer-Verlag,
New York (NY), 1989.
[3] V. Rizzoli, A. Lipparini, ‘General stability analysis of periodic steady-state regimes in non-
linear microwave circuits’, IEEE Trans. Microwave Theory Tech., MTT-33(1), 30–37, 1985.
[4] F. Di Paolo, G. Leuzzi, ‘A design approach for sub-harmonic generation or suppression in
nonlinear circuits’, Proc. GAAS 2002, Milan (Italy), 2002.
[5] S.A. Maas, Microwave Mixers, Artech House, Norwood (MA), 1993.
[6] F. Di Paolo, G. Leuzzi, ‘Bifurcation synthesis by means of harmonic balance and conversion
matrix’, Proc. GAAS 2003 ,M
¨
unchen (Germany), 2003.
BIBLIOGRAPHY 369
[7] A. Su
´
arez, R. Qu
´
er
´
e, Stability Analysis of Nonlinear Circuits, Artech House, Norwood (MA),
2003.
[8] G. Chen, T. Ueta (Ed.), Chaos in Circuits and Systems, World Scientific, Singapore, 2002.
[9] L.O. Chua, ‘Dynamic nonlinear networks: state-of-the-art’, IEEE Trans. Circuits Syst., CAS-
27, pp. 1059–1087, 1980.
[10] A. Su
´
arez, J. Morales, R. Qu
´
er
´
e, ‘Synchronisation analysis of autonomous microwave circuits
using new global stability analysis tools’, IEEE Trans. Microwave Theory Tech., 46, 494 –504,
1998.
[11] V. Rizzoli, A. Neri, ‘Automatic detection of Hopf bifurcations on the solution path of a
parameterised nonlinear circuit’, IEEE Microwave Guided Wave Lett., 3(7), 219–221, 1993.
[12] V. Iglesias, A. Su
´
arez, J.L. Garcia, ‘New technique for the determination through commercial
software of the stable-operation parameter ranges in nonlinear microwave circuits’, IEEE
Microwave Guided Wave Lett., 8(12), 424–426, 1998.
[13] S. Mons, J Ch. Nallatamby, R. Qu
´
er
´
e, P. Savary, J. Obregon, ‘A unified approach for the
linear and nonlinear stability analysis of microwave circuits using commercially available
tools’, IEEE Trans. Microwave Theory Tech., MTT-47(12), 2403–2409, 1999.
[14] K. Kurokawa, ‘Some basic characteristics of broadband negative resistance oscillator circuits’,
Bell Syst. Tech. J., 48, 1937–1955, 1969.
[15] K. Kurokawa, ‘Injection locking of microwave solid-state oscillators’, Proc. IEEE, 61,
1386–1410, 1973.
[16] H.C. Chang, A.P. Yeh, R.A. York, ‘Analysis of oscillators with external feedback loop for
improved locking range and noise reduction’, IEEE Trans. Microwave Theory Tech., MTT-47,
1535–1543, 1999.
[17] F. Ram
´
ırez, E. de Cos, A. Su
´
arez, ‘Nonlinear analysis tools for the optimised design of
harmonic-injection dividers’, IEEE Trans. Microwave Theory Tech., 51(6), 1752– 1762, 2003.
[18] F. Ram
´
ırez, E. de Cos, A. Su
´
arez, ‘Analog frequency divider by variable order 6 to 9’, IEEE
MTT-S Int. Symp. Dig., 2002, pp. 127–130.
Appendix
A.1 TRANSFORMATION IN THE FOURIER DOMAIN
OF THE LINEAR DIFFERENTIAL EQUATION
C ·
dv(t)
dt
+ g ·v(t) +i
s
(t) = 0 (A.1)
By Fourier transforming the equation, we get
C ·
∞
−∞
dv(t)
dt
· e
−jωt
· dt +g ·
∞
−∞
v(t) ·e
−jωt
· dt +
∞
−∞
i
s
(t) · e
−jωt
· dt =
= C ·jω ·
∞
−∞
v(t) ·e
−jωt
· dt +g ·
∞
−∞
v(t) ·e
−jωt
· dt +
∞
−∞
i
s
(t) · e
−jωt
· dt =
= jωC · V(ω)+g · V(ω)+ I
s
(ω) = Y(ω)·V(ω)+ I
s
(ω) = 0
(A.2)
Nonlinear Microwave Circuit Design F. Giannini and G. Leuzzi
2004 John Wiley & Sons, Ltd ISBN: 0-470-84701-8
372 APPENDIX
A.2 TIME-FREQUENCY TRANSFORMATIONS
Time domain
Real-valued
‘signals’ or
‘impulse responses’
Continuous
Discrete
Periodic
Non-
periodic
Inverse
Fourier series
Fourier series
Discrete Fourier
transform (DFT)
Fourier transform
Properties of signals and systems
in the time domain and frequency domain
f
f
f
f
tt
t
t
Continuous
Discrete
Periodic Periodic Periodic
Non-
periodic
Non-
periodic
Non-
periodic
Frequency domain
Complex-valued, Hermitean
‘spectra’ or
‘transfer functions’
A.3 GENERALISED FOURIER TRANSFORMATION
FOR THE VOLTERRA SERIES EXPANSION
∞
−∞
y(t) · e
−jωt
· dt =···+
∞
−∞
t
−∞
t
−∞
h
2
(t −τ
1
,t − τ
2
) · x(τ
1
)
· x(τ
2
) · dτ
2
· dτ
1
· e
−jωt
· dt +···
APPENDIX 373
=···+
∞
−∞
t
−∞
t
−∞
h
2
(t −τ
1
,t − τ
2
) · x(τ
1
) · x(τ
2
) · e
−jω
1
(t−τ
1
)
· e
−jω
2
(t−τ
2
)
· e
−jω
1
τ
1
· e
−jω
2
τ
2
· e
jω
1
t
· e
jω
2
t
· dτ
2
· dτ
1
· e
−jωt
· dt +···
=···+
t
−∞
t
−∞
h
2
(t −τ
1
,t − τ
2
) · e
−j(ω
1
(t−τ
1
)+ω
2
(t−τ
2
))
· x(τ
1
)
· e
−jω
1
τ
1
· x(τ
2
) · e
−jω
2
τ
2
· dτ
2
· dτ
1
·
∞
−∞
e
−j(ω−ω
1
−ω
2
)t
· dt +···
=
H
n
(ω
1
, ,ω
n
) · X(ω
1
) ,X(ω
n
)
· δ(ω − ω
1
− ω
n
) · dω
n
dω
1
= Y(ω) (A.3)
A.4 DISCRETE FOURIER TRANSFORM AND INVERSE
DISCRETE FOURIER TRANSFORM FOR PERIODIC
SIGNALS
A periodic signal with period T can be expanded in Fourier series:
x(t) =
∞
n=−∞
X
n
· e
jnω
0
t
(A.4)
where the angular frequency ω
0
is
ω
0
=
2π
T
= 2π ·f
0
(A.5)
The coefficients of the Fourier series expansion are expressed as
X
n
=
1
T
T
0
x(t) · e
jnω
0
t
dt(A.6)
If the signal has a bandwidth limited to a maximum frequency f
max
= N ·f
0
=
N
2π
· ω
0
,
the series can be truncated as
x(t) =
N
n=−N
X
n
· e
jnω
0
t
(A.7)
and by using Nykvist’s sampling theorem, the coefficients are computed as
X
n
=
1
T
N
k=−N
x(t
k
) · e
jnω
0
t
k
with t
k
=
T
2N +1
· k, k =−N, ,N (A.8)