Báo cáo khoa học: "Spatial and seasonal variations in stem respiration of beech trees (Fagus sylvatica)" potx
Bạn đang xem bản rút gọn của tài liệu. Xem và tải ngay bản đầy đủ của tài liệu tại đây (472.29 KB, 12 trang )
É. Ceschia et al.Stem respiration in a beech forest
Original article
Spatial and seasonal variations in stem respiration of beech trees
(Fagus sylvatica)
Éric Ceschia
a*
, Claire Damesin
a
, Stéphanie Lebaube
b
, Jean-Yves Pontailler
a
and Éric Dufrêne
a
a
Université Paris XI, Laboratoire d’écophysiologie végétale, Bât. 362, 91405 Orsay, France
b
UMR INRA UHP, Écologie et Écophysiologie forestières, 54280 Champenoux, France
(Received 18 April 2002; accepted 19 June 2002)
Abstract – Stem respiration of adult beech (Fagus sylvatica L.) trees was measured in the field in eastern France at several levels in the crown
and along the stem. Strongvariations in respiration rates throughout the season and within the trees were mainly caused by gradients in stem tem
-
perature, growth rates and distribution of living cells. The higher respiration rates, were measured in the upper crown. During the non-growing
season, maintenance respiration ranged between 7.2 and 528 µmol m
–3
s
–1
at breast height and in the upper crown, respectively. Q
10
increased
along the stem from 1.3 at breast height to 2.0 in the upper crown. There was a linear relationship between [N] and the percentage of living cells
in the wood, but respiration increased strongly with [N]. Growth respiration accounted for 45–76% of annual stem respiration, and the growth
respiration coefficient was close to 0.2 g C respired g
–1
C fixed.
beech / stem and branch respiration / living cell / nitrogen concentration
Résumé – Variations spatiales et saisonnières de la respiration ligneuse chez le Hêtre (Fagus sylvatica). La respiration ligneuse a été me-
surée de façon continue sur des Hêtres (Fagus sylvatica L.) adultes dans une forêt de l’est de la France, à trois niveaux dans la couronne de bran-
ches en 1997 et à deux voire trois niveaux le long du tronc en 1998. Les fortes variations du taux de respiration observées au cours de la saison et
au sein de l’arbre étaient essentiellement causées par des gradients de température, de taux de croissance et de distribution des cellules vivantes.
Les plus fortes valeurs de respiration correspondaient au sommet de la couronne. Pendant la période de non-croissance, la respiration d’entretien
variait entre 7,2 et 528 µmol m
–3
s
–1
à 1,3 m et au sommet de la couronne, respectivement. Le Q
10
augmentait aussi le long du tronc de 1,3 à 2,0
pour ces mêmes positions. Il existait une relation linéaire entre la concentration en azote, [N], dans le bois et le pourcentage de cellules vivantes.
La respiration d’entretien augmentait fortement avec [N]. La respiration de croissance représentait 45 à 76 % de la respiration annuelle des
troncs, et le coût de synthèse du bois était de 0,2 g C respiré g
–1
C fixé dans le tissu.
hêtre / respiration ligneuse / cellule vivante / concentration en azote
1. INTRODUCTION
Interest in the carbon balance of forests has increased in
recent decades. Autotrophic respiration is a major component
in the annual carbon balance of forest ecosystems, and can
consume up to 60% of gross carbon assimilation [38].
Woody-tissue respiration alone annually consumes ca.
11–33% of total net daytime carbon assimilation [37]. More
-
over, since forest ecosystems are very finely balanced be
-
tween being a carbon source or a carbon sink [26], it has be
-
come crucial to improve the accuracy of models used for esti
-
mating forest carbon budgets, and thus to improve our
knowledge of stem respiration processes.
Although the biochemical pathways are similar, wood res
-
piration is generally separated into two components e.g. [2,
41]: growth respiration, which provides the energy needed to
synthesise new tissues, is a function of wood growth; and
maintenance respiration, which maintains existing living
Ann. For. Sci. 59 (2002) 801–812 801
© INRA, EDP Sciences, 2002
DOI: 10.1051/forest:2002078
* Correspondence and reprints
Tel.: +33 (0)4 73 62 44 25; fax: +33 (0)4 73 62 44 57; e-mail:
Current address: INRA-Agronomy Unit, 234 Avenue du Brézet, 63039 Clermont-Ferrand, France
cells, is usually a function of biomass [36], sapwood volume
[19], surface area [46] or nitrogen content [28]. This separa
-
tion in two components is necessary to understand how stand
development, climate and management affect forest carbon
cycling. A simple model can be used to calculate woody res
-
piration separated into those two components on a short time
scale or per annum [2, 42]. Thus estimates of the growth res
-
piration coefficient (r
G
) and biomass increments, of standing
biomass and maintenance respiration rate (r
M
), are required to
estimate stem respiration at stand level. Usually, r
G
and r
M
are
derived from measurements at breast height (1.3 m), but
some studies have shown that respiration varies with stem
and branch diameter or height [4, 5, 8, 18, 32, 40, 41, 49], or
with the woody organ (stem or branch) considered [5, 28, 32,
41, 49].
The factor by which maintenance respiration varied be
-
tween different locations in the trees differed greatly among
the different studies, and depended on the units in which res
-
piration was calculated. An almost 30-fold difference in
respiration rates along the stem on a wood mass base was re
-
ported in Yoda et al. [49] for different tree species, a 3- and
4.5-fold on a surface-area base and volume base in Ryan et al.
[40] for Pinus radiata, and a 10- to 40-fold on a surface-area
base for Abies amabilis in Sprugel [41].
There may be several causes for a spatial variation in total
stem respiration:
(1) Differences in wood composition [3] and in the amount
of wood produced along the stem will give differences in
growth respiration.
(2) The distribution of living cells within the stem can af-
fect maintenance respiration rates [45, 46].
(3) The transport and storage of carbohydrates in the stem
and in the branches can cause variations in respiration rates as
it was shown by Malkina et al. [29] and Lavigne [18].
(4) Sapflow could transport part of the CO
2
respired by the
stem [12, 23, 30, 33] and it could release it in the upper parts
of the stem. However, Edwards and Wullschleger [11] and
Ceschia [7] found little evidence of the effect of the sapflow
on stem respiration.
(5) Temperature is also an important factor that influences
the spatial variation of stem respiration. Stem temperature is
usually higher in the upper parts of the canopy, since the stem
is more exposed to sunlight and the temperature amplitude is
greater. Because of the smaller diameter of the organs, the
stem tissues also warm faster at the top than at the base of the
stem. Indeed, Q
10
, the factor expressing respiration increase
for a temperature increase of 10
o
C, can vary with height
along the stem [8] or with the organ in question, stem or
branch [28].
Very few models dealing with carbon budgets for an entire
ecosystem, take into account spatial variations in stem respi
-
ration and few attempts have been made to test the impact of
such variations on calculations of net carbon uptake at stand
level [45]. More information is also needed to be able to
choose the best unit to scale up stem or branch respiration to
stand level, because this unit can have a large impact on the
final results. Hitherto, the most common units have been sur
-
face area [18, 46] or sapwood volume [36], but sapwood fresh
mass [49] or sapwood dry mass and nitrogen content [28,
37–40] have also been used to express maintenance respira
-
tion. Sprugel et al. [43] suggested that sapwood volume was a
better calculation base, because respiration rates per unit vol
-
ume are rather constant within coniferous species. Knowl
-
edge of the distribution of living cells in the stem would make
it possible to choose the best unit (surface or volume) for ex
-
pressing stem maintenance respiration, and it would mini
-
mize errors when scaling up local measurements to stand
level [45].
Even if within-tree variability in respiration is large, it
should be borne in mind that between-tree variability can be
still larger, especially on a multi-aged forest. Indeed, temper
-
ature-corrected respiration, calculated on a surface-area base,
was found to vary among trees by a factor 10 to 40 [41]. In
Carey et al. [6], maintenance respiration, calculated on a sap
-
wood volume base, decreased with diameter at breast height
(DBH) and age; it was attributed to a decrease in the number
of living cells or to diffusion problems in older trees.
In the present paper, we measured stem respiration of a
temperate deciduous species, Fagus sylvatica L. Measure-
ments were performed almost continuously at three levels in
the crown of one tree during the growing season of 1997. In
1998, measurements were performed continuously at two dif-
ferent positions along the stem on four dominant or co-domi-
nant trees during the growing season and at a third level after
the growing season. The aims were (1) to quantify the vari-
ability of different parameters (percentage of living cells and
nitrogen concentration in the wood, stem temperature and
growth) and their influence on stem respiration throughout
the year, between trees and within trees; (2) to determine the
relative importance of maintenance and growth respiration
on an annual base and (3) to calculate the growth respiration
coefficient.
2. MATERIALS AND METHODS
2.1. Site description
The study site is situated in the State forest of Hesse, eastern
France (48
o
40’ N, 7
o
04’ E, elevation 305 m, area 0.63 ha, slope
< 2%), and is one site within the Euroflux project (FR02). Mean an
-
nual precipitation and air temperature are 820 mm and 9.7
o
C, re
-
spectively. The soil is a gleyic luvisol, according to the F.A.O.
classification. Beech (Fagus sylvatica L.) is the dominant tree spe
-
cies and other species are Betula pendula Roth, Carpinus betulus L.,
Fraxinus excelsior L., Larix decidua Mill., Prunus avium L. and
Quercus petraea (Matt.) Liebl. In 1997, most of the trees were 25 to
35-year-old and stand density was 4000 trees ha
–1
, with a mean
height of 13 m in 1997 and a diameter at breast height (DBH) of
72 mm. Leaf area index (LAI) was 5.6 in 1997 [14] and all beeches
showed leaf emergence at the end of April.
802 É. Ceschia et al.
2.2. Experimental set-up
Stem respiration measurements in Hesse started on one tree in
1997 (from May to December) and were extended to four trees in
1998 (from April to October). In the first year, three cuvettes were
installed on the main stem at a high level in the crown of a beech
tree. Its height and DBH were 15.5 m and 100 mm, respectively.
Permanent cuvettes, made of two halves of a glass cylinder, were in
-
stalled on the stem at 0.25 (upper crown), 1.5 (mid-crown) and 2.5
(low crown) m from the top of the tree. These positions corre
-
sponded to stem diameters of 2.5, 12.9 and 23.6 mm at the beginning
of the season. The length of the cuvettes ranged from 2.1 (upper
crown) to 4.5 cm (mid-crown and low crown).
In 1998, four dominant or co-dominant trees were selected
among beech trees that were already equipped with sapflow sensors
and band-dendrometers. Two cuvettes were installed on each tree:
one at breast height (diameter ranged from 108 to 143 mm) and one
at mid-stem (diameter ranged from 52 to 70 mm). This position usu
-
ally corresponded to the base of the crown. The cuvettes were 22 cm
long, made of two half-cylinders of transparent Acrylic resin and a
fan was used to mix the air inside the chambers.
In 1998, after growth had ceased (day of year (DOY) 245, see be
-
low), stem respiration was also measured at 0.8 m from the top of
the trees (upper stem) on which measurements were made at breast
height and at mid-stem, but using the same glass cuvettes (4.5 cm
long) as were used in the crown in 1997. The diameter of the organs
ranged from 5.3 to 16.8 mm.
The cuvettes were sealed to the stem with large PVC soft foam
and putty (Térostat-7, Téroson, Germany) that would allow the stem
to grow. Stem respiration measurements were performed automati-
cally using an infrared gas analyser (LI-6262, Li-COR, NE, U.S.A.)
operating as an open system. CO
2
evolution in all cuvettes was mea-
sured in sequence every 90 minutes. The cuvettes were covered with
aluminium foil to avoid CO
2
refixation by the bark. Airflow passing
continuously through the cuvettes was adjusted to prevent a CO
2
in
-
crease of more than 50 µmol mol
–1
inside the cuvettes. Airflow
(ranging between 0.05 and2Lmin
–1
) was measured with mass-flow
meters (AMW-43600V and AMW-3300, Honeywell, IL, U.S.A.)
before and after the cuvettes to check their air-tightness. The air
passing through the various cuvettes was selected using solenoid
valves controlled by a data logger (CR10X, Campbell Scientific,
Logan, U.S.A.), and directed through the analyser.
All data from the IRGA and the mass flow meters were recorded
and stored every minute by a data logger. Temperature measure
-
ments were averaged and stored every 30 minutes by the CR10X in
1997 and by a Deltalogger (Delta-T devices, Cambridge, U.K.) in
1998. The automatic gas-exchange system was installed between
April and November 1998. Technical problems prevented the use of
data between September and October 1998, for one cuvette installed
at breast height outside the growing season and for one of the
cuvettes installed at mid-stem.
In 1997, thermistors (10 kΩ at 25
o
C, Betatherm, Ireland) were
used to measure air temperature in the cuvettes, assuming that stem
temperature tracked air temperature very closely. In 1998, thermis
-
tors were inserted 2 mm under the bark to measure stem temperature
in the cuvette. The thermistors were installed at three levels in the
tree in 1998: at breast height, at mid-stem and where some extra
cuvettes were installed on the upper stem on DOY 245.
2.3. Diameter increment
In 1998, the diameter increment below the breast height and
mid-stem cuvettes was recorded hourly with an automatic
band-dendrometer (Megatron MM30, Allinges, France). In the
crown, the stem diameter increment was recorded monthly both
years, as the mean of two measurements at 90
o
to each other, made
with a digital calliper (resolution 0.01 mm), immediately above and
below each cuvette. Calculations of respiration on a stem volume or
surface-area base were corrected throughout the year for stem diam
-
eter increment.
2.4. Data analysis
Stem respiration measurements were fitted to the temperature
variations for each cuvette, using the following equation:
R = R
15
Q
10
((T – 15) / 10)
(1)
where R is stem respiration measured, R
15
is stem respiration esti
-
mated at 15
o
C, Q
10
is the relative increase in R for a temperature ele
-
vation of 10
o
C in air or wood temperature in the cuvette, and T is air
or wood temperature (
o
C) in the cuvette.
Statistical analyses were conducted with version 6.12 of the Sta
-
tistical Analysis System (SAS). A non-linear model procedure
PROC NLIN was used to estimate the parameters (R
15
and Q
10
)ofthe
exponential equation. For each cuvette, daily R
15
was averaged on
three days (running mean) and Q
10
was calculated on a one-day,
three-day and seven-day base.
2.5. Estimation of the different components
of stem respiration
Two methods were used to estimate the contributions of growth
and maintenance to the total respiration.
Method 1, or mature-tissue method [2]: this method assumes that
maintenance respiration (R
M
) at a reference temperature and for a
given volume or surface area of wood, is constant throughout the
year. The averaged maintenance respiration corrected for a tempera
-
ture of 15 ºC (R
M15
) was calculated for each cuvette from measure
-
ments made before and after the growing season. R
M
was
recalculated throughout the season using an averaged annual Q
10
for
each cuvette and the seasonal temperature variations. R
M
was then
subtracted from total respiration (R
T
) during the growing season for
each cuvette and measurement occasion: the difference representing
growth respiration (R
G
) was summed for the whole year. The slope
of the relationship between R
G
integrated over the year, and total
stem growth in the cuvettes, is the growth respiration coefficient
(r
G
).
Method 2, or periodic-growth method: R
G
was estimated daily by
subtracting estimated R
M
(see above) for each cuvette from R
T
.A
running mean over one week (3 days before and 3 days after the day
of measurement) was then used to recalculate R
G
and the stem
growth rate in order to eliminate the diurnal variations in stem
growth rate caused by water losses and recharge in the stem. The
slope of the relationship between R
G
and stem growth rate (corrected
for time-lag to give the best fit) gave an estimate of r
G
[1, 42]. Total
respiration should not be used to calculate r
G
since the part repre
-
sented by maintenance respiration in R
T
is changing with tempera
-
ture throughout the season. This method provided a relationship
between C fixed and C respired by growth respiration for each
cuvette, while Method 1 gave a single relationship for all cuvettes.
For both methods, we used a wood density value of 636 kg m
–3
[8], and we assumed that the carbon content of the woody tissues
Stem respiration in a beech forest 803
was0.49gC/gdrywood [31]. In June 1997, after a strong storm the
upper and lower cuvettes installed in the crown slightly moved from
their original location on the stem. Therefore, those two cuvettes
were disregarded when calculating the growth respiration coeffi
-
cient.
2.6. Living cells and nitrogen content analysis
Since we couldn’t take samples on the trees used for respiration
measurement in 1998, five trees having DBH similar to those used
for respiration measurements were chosen outside the experimental
site (less than 50 m from the measured trees). In September, after
growth had ceased and before leaf fall, two increment cores were
taken at breast height from the five trees. The first core was dried at
70
o
C for 48h, and milled before nitrogen analysis by means of a
Carlo Erba Elemental Analyser NA 1500 [17].
The length of the second core was equal to half the DBH of the
stem. The sample was immediately frozen in dry ice and kept at
–80
o
C. The frozen increment cores were sectioned in the xylem at 3
to 8 depths between 1 and 60 mm under the cambium by means of a
microtome. To ensure that at least one cell layer was intact, sections
were 70 µm thick. The sections were placed on a glass slide and
stained with a Comassie blue solution for 3 minutes [44]. They were
then rinsed, first with an identical solution, but without the stain, and
finally with water [44]. The sections were mounted on slides in Can
-
ada balsam. The Comassie blue stained only the proteins of the cyto-
plasm and made it possible to determine which cells were living.
On the same date, several branches in the upper canopy were also
sampled on the four trees for analysis of [N] and living cells. These
branches were regarded as stems since for beech trees it is often dif-
ficult to distinguish the branches from the stem in this location and
both are exposed to similar climatic conditions. The whole trans-
verse-section of the branches was used for analysis of living cells.
To estimate the amount of living cells in the periderm (including
cambium, phloem, parenchyma and collenchyma) at breast height,
the amount of living cells per volume of periderm for the branches
was multiplied by the volume of the periderm at breast height. It was
not possible to measure directly the amount of living cells in the
periderm at breast height since the cells were damaged by the core
sampler. The percentage area of live cells in each section was deter
-
mined by means of a computer image-analysis system (Image Tool,
University of Texas Health Science, San Antonio, TX, U.S.A.). To
calculate the total surface area of living cells at breast height, the
various sections in the xylem and the percentage of living cells in the
periderm were integrated over the cross-sectional area of the stem.
3. RESULTS
3.1. Stem growth
Stem diameter increment in the crown started at the end of
April in 1997 [22] and ceased approximately on 20 August
(DOY 232). In 1998, growth started ca. DOY 130, and ceased
at the end of August (ca. DOY 240), both in the middle and at
the base of the stem (figure 1b). Growth, which was very well
synchronised along the stem during this period, peaked for
the first time in early June (DOY 157), decreased until DOY
167 (corresponding to a cool period), and peaked a second
time on DOY 175. Thereafter, it slowly decreased until the
end of August, even if minor peaks occurred on DOY 212
and 236. The diameter increment was on average 3.9 mm
(SE = 0.4) at breast height, 4.9 mm (SE = 0.6) in the mid-stem
cuvettes and 4.4 mm (SE = 0.6) in the upper stem cuvettes
corresponding to annual relative diameter growth of 3.1, 8.1
and 33.5%, respectively.
804 É. Ceschia et al.
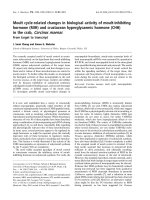
Figure 1. Seasonal and spatial variation in (a) stem respiration nor
-
malised to 15
o
C(R
15
) and calculated on a volume basis at breast
height (᭜, three to four cuvettes per point) and in the middle of the
stem (᭛, three cuvettes per point) in 1998 and at the base (᭹), middle
(᭺) and top (᭢) of the crown in 1997 of dominant 25-year-old beech
trees at Hesse; (b) averaged stem diameter increment at breast height
(᭜) and in the middle of the stem (᭛) in 1998. The error bars repre
-
sent the standard errors of the mean for the 1998 measurements and
are presented for each of the four dates for which the standard errors
were maximum for either the respiration rates or the diameter incre
-
ments at breast height or in the middle of the stem. For further details,
see text.
3.2. Stem temperature
Stem temperature at breast height and for the upper stem
location ranged from –13 and –12.8 °C, respectively, in No
-
vember 1998, to 29.7 and 38.3 °C in August 1998. The larg
-
est difference in temperature between the two levels was
recorded in January, and reached 15.7 °C. On a diurnal and
monthly average, temperature usually increased with height
along the stem. On a monthly base, the difference in tempera
-
ture between the cuvettes installed on the upper stem and at
breast height was always positive (between 0.2 °C in March
and 1.5 °C in June), except in April, when the difference was
close to –0.2 °C.
3.3. Stem respiration
The peak of respiration, corrected for temperature, oc
-
curred in the middle of the growing season (figure 1a). In
1997, respiration increased first for the upper crown cuvette,
but was rather well synchronised for the mid-crown and
lower crown positions and growth respiration ceased for all
cuvettes around DOY 270. In 1998, respiration increased
suddenly on DOY 126, both at breast height and at mid-stem.
This increase occurred four days before measurable growth
started (figures 1a and 1b). The peaks of respiration in the
mid-stem cuvette occurred on DOY 176 and 191, while at
breast height they occurred on DOY 191 and 204. Growth
and respiration were not synchronised, and the peak of respi-
ration at breast height occurred ca. 27 days after the first stem
growth peak compared with only 18 days for the mid-stem
cuvette.
Respiration estimated at 15
o
C(R
15
), calculated on a vol
-
ume base, generally increased with height on the stem or de
-
creased with increasing diameter. However, the lower crown
cuvette installed in 1997 had a slightly higher respiration rate
than the mid-crown cuvette on many occasions (figure 1a).
The respiration rate in the upper crown cuvette was far higher
than in the lower crown and mid-crown cuvettes throughout
the season. In 1998 (figure 1a), the maximum values aver
-
aged for the breast height and mid-stem cuvettes were 65.4
(SE = 11.0) and 181 µmol m
–3
s
–1
(SE = 33) respectively,
whereas in 1997, the maximum value for the upper crown
cuvette was above 4469 µmol m
–3
s
–1
(see table I). During the
non-growing season, the trend of increase in respiration rates
with increasing height or decreasing diameter remained, but
the respiration rate at breast height, specifically, increased
with increasing diameter (see figure 2a and table I). The val
-
ues of R
M15
before and after growth in 1998 were very similar,
7.0 (SE = 0.9) and 7.1 (SE = 1.6) µmol m
–3
s
–1
, respectively, at
breast height and 26.9 (SE = 3.0) and 32.6 (SE = 2.5) µmol
m
–3
s
–1
in the mid-stem cuvette. The variation in R
15
between
trees in 1998 was relatively small compared with variation
within trees. At breast height and at mid-stem, on a volume
basis, the larger factors of variation during the season be-
tween trees were 2.4 and 3.6, respectively.
Stem respiration in a beech forest 805
Table I. Spatial variation in stem respiration and Q
10
in the cuvettes during the season 1998 at breast height, mid-stem and for the upper stem of
dominant beech trees and at three positions within the crown (low, mid-crown and upper crown) during the season of 1997. The maximum an-
nual values of stem respiration (R
15MAX
) and the averaged maintenance respiration before and after growth, normalized to 15 ºC (R
M15
), were cal
-
culated on a volume (µmol m
–3
s
–1
) or surface (µmol m
–2
s
–1
) of stem base. Values in parenthesis are standard errors of the means.
Cuvette positions Year Diameter
(mm)
Height
(m)
R
15MAX
(µmol m
–3
s
–1
)
R
M15
(µmol m
–3
s
–1
)
R
15MAX
(µmol m
–2
s
–1
)
R
M15
(µmol m
–2
s
–1
)
Q
10
Breast height 1 1998 128 1.8 95.2 7.35 (0.34) 3.14 0.239 (0.010) 1.18 (0.03)
Breast height 2 1998 108 1.4 46.0 – 1.27 – 1.38 (0.046)
Breast height 3 1998 115 1.7 52.3 5.09 (0.11) 1.55 0.149 (0.003) 1.44 (0.05)
Breast height 4 1998 143 1.6 68.2 9.12 (0.49) 2.50 0.330 (0.018) 1.33 (0.05)
Mean Breast height 1998 124 (8) 1.6 (0.1) 65.4 (11.0) 7.18 (1.16) 2.12 (0.43) 0.239 (0.052) 1.33 (0.11)
Mid-stem 1 1998 60.8 11.0 141 30.2 (1.7) 2.25 0.479 (0.030) 1.28 (0.04)
Mid-stem 2 1998 51.6 10.4 248 33.5 (1.0) 3.35 0.449 (0.013) 1.47 (0.08)
Mid-stem 3 1998 56.5 11.6 156 27.5 (0.8) 2.36 0.406 (0.014) 1.52 (0.06)
Mean Mid-stem 1998 56.3 (0.3) 11.0 (0.3) 181 (33) 30.4 (1.8) 2.65 (0.35) 0.445 (0.021) 1.42 (0.11)
Upper stem 1 1998 13.6 15.0 – 547* – 2.30* 1.99*
Upper stem 2 1998 15.4 13.2 – 147* – 0.56* 2.11*
Upper stem 3 1998 15.2 14.7 – 236* – 0.90* 2.25*
Upper stem 4 1998 16.8 14.2 – 89.4* – 0.30* 1.79*
Mean Upper stem 1998 15.2 (0.7) 14.3 (0.3) – 255 (102) – 1.02 (0.44) 2.04 (0.08)
Low crown 1997 23.6 13 583 48.0 (3.2) 3.67 0.287 (0.019) 1.79 (0.03)
Mid-crown 1997 12.9 14 392 60.4 (3.6) 1.33 0.225 (0.013) 1.87 (0.05)
Upper crown 1997 2.5 15.3 4469 528 (56) 2.32 0.441 (0.039) 1.85 (0.07)
* Based on measurements made on DOY 245 only.
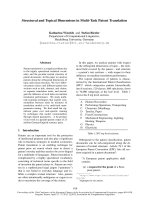
On a surface area base, the differences in R
15
between the
different levels along the stem were smaller than on a volume
base. There was less consistency in the variation of R
15
and
R
M15
along the stem in 1997 and 1998 than on a volume base
(figure 2b) since the respiration rate did not necessarily in
-
crease with height or decrease with diameter. Therefore,
maintenance respiration is more difficult to predict on a sur
-
face area base. At breast height, the factor of variation be
-
tween the trees was 39% higher when respiration was
calculated on a surface base than when it was calculated on a
volume base.
3.4. Q
10
calculations
As a rule, Q
10
tended to increase with the number of days
used to calculate it. In 1998, on a one-day, three-day and
seven-day calculation base, the averaged Q
10
was 1.29 (SE =
0.06), 1.33 (SE = 0.05) and 1.35 (SE = 0.06), respectively, for
cuvettes installed at breast height. Q
10
can be underestimated
when calculated with a short time-step and calculations over
a long period can also induce problems, if calculations are ap
-
plied to different physiological status of the wood. A
three-day period was found to be a good compromise. When
calculated with day-time values only, but for a three days
period, Q
10
was 1.43 instead of 1.33. The hysteresis com-
monly observed when respiration is plotted against tempera-
ture tends to overestimate Q
10
when it is calculated on a
diurnal base only. Introduction of a time-lag correction into
the calculations increased the estimate of Q
10
. However, as
the time-lag between respiration and temperature varied in-
consistently from 0 to 12 hours, and because this lag was not
predictable, our Q
10
estimates are presented without a correc-
tion for time-lag. There was no significant temperature-de-
pendence of the Q
10
at the top of the trees since the slope of
the linear relationship between Q
10
and stem temperature was
very small and not significant (data not shown).
Through the season, Q
10
values ranged from 1.0 to 1.85 at
breast height and from 1.08 to 2.25 at mid-stem. No clear sea
-
sonal variations were observed and most of the time Q
10
was
higher at mid-stem than at breast height (figure 3). The an
-
nual averaged Q
10
from 1998 and 1997 for each position
shows that Q
10
increased with height or decreased with in
-
creasing diameter (table I). The diameters, heights, peaks of
respiration rates, estimated at 15
o
C, and maintenance respi
-
ration rates estimated at 15
o
C, for the different cuvette posi
-
tions in 1997 and 1998 are also given in table I.
3.5. The growth and maintenance components
of stem respiration
Method 1: The relationships between total growth respira
-
tion and the amount of wood produced in six cuvettes during
1998 and in the mid-crown cuvette during 1997, are shown in
figure 4. The linear relationship (r
2
= 0.89, n = 7) shows that
the growth respiration coefficient was rather constant along
the stem. For1gofcarbon fixed in the new tissue, 0.23 g of
carbon was respired.
806 É. Ceschia et al.
Figure 2. Spatial variation in annual mean of maintenance respiration
estimated at 15
o
C(R
M15
) calculated on a volume (a) or a surface-area
base (b) as a function of stem diameter at Hesse in 1997 (᭺) and 1998
(᭹) at the top of the crown; in the middle of the stem (᭢) and at breast
height (). One cuvette per point.
Figure 3. Seasonal variation in averaged Q
10
of dominant or co-domi
-
nant 25-year-old beech trees at Hesse in 1998: at breast height (᭹,
three to four cuvettes per point) and at mid-stem (᭺, three cuvettes per
point). The error bars represent the maximum standard errors for both
locations.
The use of the mature-tissue method indicated that in
1998, 66.6% (SE = 1.3) of total stem respiration at breast
height was growth respiration, compared with 44.6% (SE =
4.5) at mid-stem (table II), in spite of a higher annual relative
diameter growth than at breast height (8.1%, SE = 0.5 and
3.1%, SE = 0.2, respectively). The relative growth for the up-
per stem was ca. 33.5% (SE = 3.8) in 1998. On average for
1997 and 1998, the percentage of total respiration repre-
sented by growth respiration (R
G
%) was 56.5% (SE = 4.8).
Method 2: The use of the periodic-growth method indi-
cated that on average for1gofcarbon fixed in new tissues,
0.20 g (SE = 0.04) of carbon was respired (figure 5). The r
2
of
the relationship between carbon fixed and carbon respired by
growth respiration, ranged between 0.57 and 0.85 (P = 0.05).
Growth respiration was estimated to be on average 64.9%
(SE = 7.8) of the total annual respiration in the cuvettes
(table II).
Both methods gave on average similar estimates of the
growth respiration coefficient, but the contribution of growth
respiration to total respiration differed. For Method 2 the av-
erages were calculated on mid-stem and breast height
cuvettes, whereas the averages for r
G
and R
G
%, respectively,
were 0.13 and 53.9% at breast height and 0.27 and 75.9% at
mid-stem. Both r
G
and R
G
% had higher values at mid-stem
than at breast height according to Method 2, but the differ-
ence was significant for r
G
only (t-test, P = 0.019).
3.6. Live cells and nitrogen analysis
In the xylem, all of the living cells were found in the rays
and down to the centre of the stem. The percentage of living
cells was rather stable in the xylem from the surface to the
centre of the stem (mean = 20.6, SE = 0.43). The total per
-
centage of living cells at breast height was very close to the
Stem respiration in a beech forest 807
Figure 4. Relationship obtained by Method 1 between carbon fixed in
the newly-formed tissue and carbon respired by growth respiration in
the lower and middle cuvettes in 1998 (᭹) and the middle cuvette in
the crown in 1997 (᭺). One cuvette per point; the solid line represents
the regression Y = 0.23 × X (the intercept was set to 0), r
2
= 0.89.
Table II. Spatial variation in total annual respiration (R
T
) and wood production in each cuvette and comparison between Methods 1 and 2 for the
percentage that represents growth respiration (R
G
%) in R
T
and comparison of the growth respiration coefficient (r
G
). The r
2
of the relationship
between C respired and C fixed for Method 2 is also presented for each cuvette. Values in parenthesis are standard errors of the means.
Cuvette positions Wood production
(10
3
mm
3
)
R
T
(mol) Method 1 Method 2
r
G
R
G
% r
G
r
2
R
G
%
Breast height 1 207 644 66.7 0.12 0.70 64.8
Breast height 3 155 438 69.2 0.18 0.67 63.1
Breast height 4 224 691 63.9 0.10 0.85 33.8
Mean Breast height 195 (21) 591 (63) 66.6 (1.3) 0.13 (0.02) 0.74 (0.05) 53.9 (10.1)
Mid-stem 1 164 128 0.23 33.7 0.31 0.67 92.8
Mid-stem 2 71 188 51.2 0.30 0.57 72.7
Mid-stem 3 101 146 49.1 0.19 0.85 62.1
Mean Mid-stem 112 (48) 154 (15) 44.6 (4.5) 0.27 (0.04) 0.69 (0.07) 75.9 (9.0)
Mid-crown 1.4 4 61.9 – – –
Figure 5. Relationship obtained by Method 2 between carbon fixed in
the newly-formed tissue and carbon respired by growth respiration in
one of the middle cuvettes in 1998. The solid line represents the re
-
gression Y = 0.19 × X + 0.008, r
2
= 0.85.
total percentage of living cells in the xylem (figures 6a and
6b), which demonstrates that the number of living cells in the
periderm is negligible in this location. The integration of the
sections at several depths over the entire stem section showed
that the mean percentage of living cells was close to 20.6%
(SE = 0.88), but decreased with DBH (figure 6b).
In the crown, the percentage of living cells in the xylem
decreased strongly with increase of stem diameter (fig
-
ure 6a), from 48% to 21% at 1.8 mm and 8.2 mm diameter,
respectively. The total percentage of living cells also
decreased with increase of stem diameter, from 60.3% to
32.7% for stem diameters of 2.2 and 11 mm, respectively
(figure 6b). Moreover, the proportion of xylem tissue com
-
pared to the other tissues strongly increased with stem diame
-
ter (figure 7). Pith thickness was constant and the percentage
of living cells in the pith was on average 45% lower than the
percentage of living cells in the xylem at the same diameter
(data not shown). The percentage of living cells in the
periderm was rather constant, averaging 55.6% (SE = 0.90).
808 É. Ceschia et al.
Figure 6. Percentage of living cells in the xylem (a), over the entire
section (b) and nitrogen concentration in the wood (c) as a function of
stem diameter for 25-year-old beech trees at Hesse in 1998; in the
crown (᭹) and at breast height (᭺). The solid line represents the re
-
gression for the breast height samples, Y = –0.066 × X + 24.5,
r
2
= 0.97.
Figure 7. Representation of the relative proportion of different tis
-
sues in the stem within the crown, as a function of their diameter for
25-year-old beech trees at Hesse in 1998.
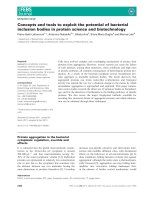
Figure 8. Percentage of living cells in the stem and simulated R
M15
as
a function of nitrogen concentration in the stem in the crown (᭹) and
at breast height (᭺) for 25-year-old beech trees at Hesse in 1998. The
solid line represents the regression for the percentage of living cells
(Y = 4.86 × X + 15.3, r
2
= 0.74). The dashed line represents the regres
-
sion for the simulated R
M15
(Y = –88.9 + 62.0 × e
(0.41 × X)
, r
2
= 0.68).
Corresponding to the decrease in living cells, the nitrogen
concentration decreased strongly with stem diameter in the
crown, from 7.5 mg N g
–1
DM to 3.3 mg N g
–1
DM for organs
with diameters close to 2 and 9 mm, respectively (figure 6c).
At breast height, there were very little changes in [N] with
changes in stem diameter and nitrogen concentration was
close to 1 mg N g
–1
. There was a linear relationship between
the total percentage of living cells in the stem and [N] (Y =
4.86 × [N] + 15.3, n =20andr
2
= 0.74), but the relationship
between simulated respiration (calculated from the relation
-
ship shown in figure 2a) on a volume base and nitrogen con
-
centration was not linear (figure 8). The model Y = –88.9 +
62.0 × e
(0.41 × [N])
was the best fit to the respiration data (n =41
and r
2
= 0.68), suggesting that respiration increases non-lin
-
early with the volume of living cells.
4. DISCUSSION
4.1. Seasonal variations in respiration
Total stem respiration varied throughout the year with
maximum rates during summer and minimum rates during
winter. These variations, corrected to 15 ºC, were related to
variations in diameter increment, but were not synchronised.
The time-lag between respiration and growth was not con-
stant, which implies that daily measurements are needed to
match the changes in growth and respiration through the sea-
son. This is necessary for estimating the growth respiration
coefficient by the periodic-growth method. In Stockfors and
Linder [46], it was noted that the lag between growth and res-
piration peaks varied between 10 and 20 days for Picea abies.
A possible explanation for this phenomenon is the lag be
-
tween diameter growth and increase in dry matter caused by a
delay in wall thickening and lignification [50]. Surprisingly,
respiration at mid-stem and breast height was not synchro
-
nised, whereas growth was. The lag between growth and res
-
piration was greater at breast height, perhaps because more
wall thickening is needed at breast height to support the entire
structure of the tree. A second hypothesis is that allocation of
assimilates translocated from the leaves in the crown went as
a first priority to closer woody organs for wall thickening.
4.2. Spatial variations in respiration
In accordance to previous studies [28, 32, 40, 41, 49], stem
respiration varied strongly within a tree in Hesse. The factor
of variation for respiration was higher when calculated on a
volume base than on a surface-area base. The stem respira
-
tion rates measured at breast height were similar to those re
-
ported in similar studies for conifers [21, 38] and broadleaved
trees [10, 15, 16]. Our measurements in the crown showed
respiration rates higher than those in Möller et al. [32] on
beech trees, but Yoda et al. [49] on broadleaved trees found
maintenance respiration rates similar to those in our study.
On a surface-area base, our measurements in the crown are
also similar to those reported on conifers [28, 40].
A principal factor responsible for the spatial variation of
woody total respiration was the difference in temperature be
-
tween the organs. Considering R
M15
and Q
10
values at breast
height and for the upper stem location, the differences in tem
-
perature would explain at most 68.5% of the spatial variation
in measured respiration rates during the non growing period.
Stockfors [45] showed that failure to consider temperature
differences within the stem could produce errors representing
about 58% of total annual stem respiration.
Even after total respiration was corrected for temperature
differences, respiration calculated on a volume base at the top
of the tree was greater than that at breast height. This is partly
caused by the higher relative growth of the stem in its upper
parts during the growing season. The measurements of spa
-
tial variability in R
M15
during the non-growing periods
showed that R
M
also increased with height along the stem.
The main reasons are that periderm had a higher percentage
of living cells than other tissues and that the proportion of the
periderm compared to the other tissues decreased when the
diameter of the organ increased. Moreover, the proportion of
living cells in the xylem and in the pith also decreased with
increasing diameter. In consequence, the total amount of cells
per unit surface or volume of stem decreased with increasing
diameter, corresponding to a decrease in the maintenance res-
piration rate. Since larger diameters usually corresponded to
older stems, our observations are globally in agreement with
Carey et al. [6], who showed that R
M
decreased with DBH and
age.
The percentage of living cells in the organs was much
higher for beech than for most of the other species studied. At
breast height, the percentage of living cells in the sapwood
was 5.0% for Pinus contorta, 5.7% for Picea engelmanii [36]
and only 0.1–0.5% for Picea abies [46] compared with about
22% for beech. Such a difference is explained by the much
bigger size and number or rays for beech compared to the co
-
nifers mentioned above. This is confirmed by our own obser
-
vations of the living tissues in Picea abies [7].
The distribution of the living cells in the stem was also
quite different from that found for Picea abies [7, 46]. In
Picea abies, 80% of the living cells were situated in the first
4 mm beneath the bark at breast height, and the percentage of
live cells decreased towards the centre of the stem [46]. For
Pinus contorta and Picea engelmanii more than 80% of the
living cells were also situated in the sapwood [36]. The dif
-
ference in distribution of the living cells within the stem in
different species could explain why some authors have found
that respiration was better correlated with wood surface [46]
or with volume [36]. For the beech trees we studied, volume
seems to be the most appropriate base for calculation of stem
maintenance respiration rates since an important proportion
of the living cells are situated in the xylem.
Stem respiration in a beech forest 809
As in our study, Bosc [5] found that in maritime pine
(Pinus pinaster Ait.), maintenance respiration increases
strongly with [N]. For beech, maintenance respiration in
-
creased according to an exponential relationship with [N].
Since the relationship between [N] and the percentage of liv
-
ing cells was linear for beech, respiration also increased in an
exponential relationship with the percentage of living cells.
For the smaller and younger organs, respiration increased
strongly, indicating that the living cells in these young organs
are probably more physiologically active than those in the
older ones. Bosc [5] showed that the combined effect of age
and tissue vitality could explain part of the differences in
maintenance respiration rates within the tree.
Nevertheless, branches and stems in the crown have a
much higher respiration rate on a volume or mass base than
does the stem at breast height [32, 49]. This fact is critical,
since the proportion of organs in the crown (stem and
branches) compared to the total amount of wood is large in
beech trees (11% in volume and 53% in area in [8]). Further
investigations concerning the variation in respiration rates
within the crown, especially for branches in the lower part of
the canopy, would be needed in order to assess the relation-
ships between R
M
, diameter and age of the organs.
4.3. Estimation of Q
10
Our value of Q
10
without correction for the time-lag at
breast height (Q
10
= 1.33 on average) is low compared with
most other values found in the literature, even if Lavigne and
Ryan [20] found Q
10
values between 1.0 and 1.7 for old aspen
trees. Other studies report Q
10
values of 1.2 to 3 for Pinus
banksiana [19], 1.5 to 3.2 for Chamaecyparis obtusa [34] and
1.9 to 2.6 for Picea abies [46].
Q
10
also varied within the trees, from 1.18 at breast height
to 2.25 in the crown. The response of respiration to changes
in temperature was faster for smaller-diameter organs. The
thicker bark and periderm could slow down the diffusion of
CO
2
through the stem and partly be responsible for this obser
-
vation [13]. However, the slower response of respiration to
changes in temperature measured 2 mm under the bark, is
also probably caused by the delay in warming of the internal
parts of the stem compared to the superficial parts. Stockfors
[45] and Derby and Gates [9] have observed gradients in tem
-
perature within the stem, of up to 21 °C. The greater the di
-
ameter, the longer it will take to reach a homogeneous
temperature, and in consequence, the time-lag between
changes in temperature and changes in respiration increases
with the diameter of the stem [5, 21].
In contrast to some other studies [27, 47], no Q
10
tempera
-
ture-dependence was found and no clear seasonal pattern in
Q
10
was observed. Stockfors and Linder [46] for Picea abies
and Paembonan et al. [34] for Chamaecyparis obtusa,ob
-
served a clear seasonal variation of Q
10
, but Linder and
Troeng [24, 25] did not find such variations in Pinus
sylvestris.
4.4. Separation of the total respiration
into its components
Continuous respiration measurements improve the accu
-
racy of the estimated components of stem respiration, since
respiration rates vary relatively fast. However, both methods
used to separate total respiration into its components lead to
rather similar results concerning the growth respiration coef
-
ficient (r
G
= 0.23 by Method 1 and 0.20 by Method 2), but not
for the percentage of growth respiration over total respiration
(56.5% by Method 1 and 64.9 by Method 2). These percent
-
ages are similar to those found by Ryan [36] and Stockfors
and Linder [46] in conifers (R
G
% ranged between 40 and 60%
of the total annual respiration). R
G
% was, however, higher at
mid-stem than at breast height by Method 2 (75.9% and
53.9% respectively), but lower by Method 1 (44.6 and 66.6%
respectively).
Our mean values of r
G
are rather consistent with similar
studies and are close to the theoretical value of 0.25 found by
Penning de Vries [35], but the r
G
values obtained at breast
height by Method 2 are among the smallest reported. Lavigne
and Ryan [20] estimated that the growth respiration coeffi
-
cient in Pinus banksiana and Picea mariana was between
0.24 and 0.39 and Wullschleger et al. [48] estimated r
G
to be
0.21 to 0.25 for Quercus alba saplings. Stockfors and Linder
[46] found r
G
values between 0.11 and 0.2, depending on the
methods used, but with the lower values for the mature-tissue
method. They suggested that the use of the mature-tissue
method can pose problems, since R
M
is assumed to be con-
stant through the year, whereas some studies have shown that
R
M
can acclimate to changes in temperature [25, 34] or varies
with [N] in the wood [28]. Moreover, similar regressions as
those obtained by Method 2 were made by using total respira
-
tion instead of growth respiration (which is the result of the
subtraction of maintenance respiration from total respiration)
and the slopes were similar to those obtained by Method 2.
This result indicates that Method 2 is not sensitive to errors in
estimates of maintenance respiration.
5. CONCLUSION
Annual growth respiration accounted for about 60% of to
-
tal respiration with a growth respiration coefficient close to
0.2. The distribution of the living cells in the stem tends to
show that for young beech trees, volume is a better base for
calculating stem maintenance respiration than is surface area.
Respiration rates varied within the tree by a factor up to
68-fold when calculated on a volume base. Most forest car
-
bon-cycle models that estimate stem respiration at stand level
assume that respiration rates, temperature and Q
10
are con
-
stant within the tree. Such assumptions can induce large er
-
rors of estimation for woody respiration at the tree and stand
level, if those parameters vary within the tree, as in our study.
More information is also needed concerning variations in
810 É. Ceschia et al.
branch respiration rates and bark CO
2
refixation, in order to
improve the stand-level calculations for respiration of woody
organs.
Acknowledgments: We thank people from the INRA team of
Nancy who provided assistance on the field and gave us information
and data on the Hesse site. We are also grateful to B. Saugier, J.G.K.
Flower-Ellis and S. Linder for critically reading this manuscript.
This study was supported by the European programme Euroflux
(ENV4-CT95-0078) coordinated by R. Valentini, the French
National Forest Service (ONF), and a multidisciplinary programme
on interactions between Man and Environment of CNRS:
“Environnement, Vie et Sociétés”.
REFERENCES
[1] Amthor J.S., The role of maintenance respiration in plant growth,
Plant Cell Environ. 7 (1984) 561–569.
[2] Amthor J.S., Respiration and Crop Productivity, Springer-Verlag,
New York, 1989, 215 p.
[3] Anttonen S., Manninen A M., Saranpää P., Kainulainen P.,
Lundmark T., Linder S., Vapaavuori E., Long-term nutrient optimisation af
-
fects the chemical composition of Norway spruce stem wood, in: Radoglou K.
(Ed.), Forest Research: A Challenge for an Integrated European Approach,
Volume II, 2001, pp. 643–648.
[4] Benecke U., Nordmeyer A.H., Carbon uptake and allocation by No-
thofagus solandri var. cliffortioides (Hook. f.) Poole and Pinus contorta Dou-
glas ex Loudon ssp. contorta at montane and subalpine altitudes, in: Waring
R.H. (Ed.), Carbon Uptake and Allocation in Subalpine Ecosystems as a Key
to Management, Forest Res. Lab., Oregon State Univ., Corvallis, OR, 1982,
pp. 9–21.
[5] Bosc A., Étude expérimentale du fonctionnement hydrique et carboné
des organes aériens du Pin maritime (Pinus pinaster Ait.) : intégration dans un
modèle Structure-Fonction appliqué à l’analyse de l’autonomie carbonée des
branches de la couronne d’un arbre adulte. Thesis of Université Victor Segalen
Bordeaux 2, 1999, 225 p.
[6] Carey E.V., Callaway R.M., DeLucia E.H., Stem respiration of ponde
-
rosa pines grown in contrasting climates: implications for global climate
change, Oecologia 111 (1997) 19–25.
[7] Ceschia É., Environmental effects on spatial and seasonal variations
of stem respiration in European beech and Norway spruce. Acta Universitatis
Agriculturae Sueciae (Silvestria) 219, 2001, 56 p.
[8] Damesin C., Ceschia É., Le Goff N., Ottorini J M., Dufrêne É., Stem
and branch respiration of beech: from tree measurements to estimations at the
stand level, New Phytol. 153 (2002) 159–172.
[9] Derby R.W., Gates D.M., The temperature of tree trunks-calculated
and observed, Amer. J. Bot. 53 (1966) 580–587.
[10] Edwards N.T., Hanson P.J., Stem respiration in a closed-canopy
upland oak forest, Tree Physiol. 16 (1996) 433–439.
[11] Edwards N.T., Wullschleger S.D., Carbon dioxide efflux rates from
stems of mature Quercus prinus L. and Acer rubrum L. trees do not appear to
be affected by sapflow rates, J. Sustainable Forestry 10 (2000) 125–131.
[12] Eklund L., Endogenous levels of oxygen, carbon dioxide and ethy
-
lene in stems of Norway spruce trees during one growing season, Trees 4
(1990) 150–154.
[13] Eklund L., Lavigne M.B., Restricted lateral gas movement in Pinus
strobus branches, Trees 10 (1995) 83–85.
[14] Granier A., Ceschia É., Damesin C., Dufrêne É., Epron D., Gross P.,
Lebaube S., Le Dantec V., Le Goff N., Lemoine D., Lucot É., Ottorini J M.,
Pontailler J Y., Saugier B., The carbon balance of a young beech forest,
Funct. Ecol. 14 (2000) 312–325.
[15] Kakubari Y., Diurnal and seasonal fluctuations in the bark respira
-
tion of standing Fagus sylvatica trees at Solling, West Germany, J. Jpn. For.
Soc. 70 (1988) 64–70.
[16] Kakubari Y., Diurnal and seasonal fluctuations in the bark respira
-
tion of standing Quercus acutissima trees in Nakaizu, in: Dreyer E., Aussenac
G., Dizengremel P., Favre J M., Garrec J.P., Le Tacon F., Martin F. (Eds.),
Forest Tree Physiology, Elsevier/INRA 46 suppl., 1989, pp. 529–531.
[17] Kirsten W.J., Hesselius G.U., Rapid, automatic, high capacity
Dumas determination of nitrogen, Microchem. J. 28 (1983) 529–547.
[18] Lavigne M.B., Stem growth and respiration of young balsam fir trees
in thinned and unthinned stands, Can. J. For. Res. 18 (1988) 483–489.
[19] Lavigne M.B., Comparing stem respiration and growth of jack pine
provenances from northern and southern locations, Tree Physiol. 16 (1996)
847–852.
[20] Lavigne M.B., Ryan M.G., Growth and maintenance respiration ra
-
tes of aspen, black spruce, and jack pine stems at northern and southern
BOREAS sites, Tree Physiol. 17 (1997) 543–551.
[21] Lavigne M.B., Franklin S.E., Hunt E.R. Jr, Estimating stem mainte
-
nance respiration rates of dissimilar balsam fir stands, Tree Physiol. 16 (1996)
687–695.
[22] Lebaube S., Le Goff N., Ottorini J M., Granier A., Carbon balance
and tree growth in a Fagus sylvatica stand, Ann. For. Sci. 5 (2000) 49–61.
[23] Levy P.E., Meir P., Allen S.J., Jarvis P.G., The effect of aqueous
transport of CO
2
in xylem sap on gas exchange in woody plants, Tree Physiol.
19 (1999) 53–58.
[24] Linder S., Troeng É., Photosynthesis and transpiration of 20-year-old
Scots pine, Ecol. Bull. (Stockholm) 32 (1980) 165–181.
[25] Linder S., Troeng É., The seasonal variation in stem and coarse root
respiration of a 20-year-old Scots Pine, Mitt. Forstl. Bundes-Versuchsanst.
Wien 142 (1981) 125–139.
[26] Lindroth A., Grelle A., Móren A S., Long term measurements of bo-
real forest carbon balance reveal large temperature sensitivity, Global Change
Biology 4 (1998) 443–450.
[27] Lloyd J., Taylor A., On the temperature dependence of soil respira-
tion, Funct. Ecol. 8 (1994) 315–323.
[28] Maier C.A., Zarnoch S.J., Dougherty P.M., Effects of temperature
and tissue nitrogen on dormant season stem and branch maintenance respira
-
tion in a young loblolly pine (Pinus taeda) plantation, Tree Physiol. 18 (1998)
11–20.
[29] Malkina I.S., Yakshina A.M., Tsel’niker Yu.L., Relationship bet
-
ween CO
2
evolution by the trunk and gas-exchange of the leaves in oak, Sov.
Plant Physiol. 32 (1985) 593–599.
[30] Martin T.A., Teskey R.O., Dougherty P.M., Movement of respirato
-
ry CO
2
in stems of loblolly pine (Pinus taeda L.) seedlings, Tree Physiol. 14
(1994) 481–495.
[31] Matthews G., The carbon content of trees. Forestry Commission,
Technical Paper 4, Forestry Commission, Edimburgh, 1993, 21 p.
[32] Möller C.M., Müller D., Nielsen J., Respiration in stem and branches
of beech. Det Forstlige Forsoegsvaesen i Danmark 21 (1954) 273–301.
[33] Negisi K., Bark respiration rate in stem segments detached from
young Pinus densiflora trees in relation to velocity of artificial sap flow, J. Jpn.
For. Soc. 61 (1979) 88–93.
[34] Paembonan S.A., Hagihara A., Hozumi K., Long-term measurement
of CO
2
release from the aboveground parts of a hinoki forest tree in relation to
air temperature, Tree Physiol. 8 (1991) 399–405.
[35] Penning de Vries F.W.T., Substrate utilisation and respiration in rela
-
tion to growth and maintenance in higher plants, Neth. J. Agric. Sci. 22 (1974)
40–44.
[36] Ryan M.G., Growth and maintenance respiration in stems of Pinus
contorta and Picea engelmannii, Can. J. For. Res. 20 (1990) 48–57.
[37] Ryan M.G., The effect of climate change on plant respiration, Ecol.
Appl. 1 (1991) 157–167.
[38] Ryan M.G., Linder S., Vose J.M., Hubbard R.M., Dark respiration of
pines, Ecol. Bull. (Copenhagen) 43 (1994) 50–63.
Stem respiration in a beech forest 811
[39] Ryan M.G., Gower S.T., Hubbard R.M., Waring R.H., Gholz H.L.,
Cropper W.P., Running S.W., Woody tissue maintenance respiration of four
conifers in contrasting climates, Oecologia 101 (1995) 133–140.
[40] Ryan M.G., Hubbard R.M., Pongracic S., Raison R.J., McMurtrie
R.E., Foliage, fine-root, woody-tissue and stand respiration in Pinus radiata in
relation to nitrogen status, Tree Physiol. 16 (1996) 333–343.
[41] Sprugel D.G., Components of woody-tissue respiration in young
Abies amabilis (Dougl.) Forbes trees, Trees 4 (1990) 88–98.
[42] Sprugel D.G., Benecke U., Measuring woody-tissue respiration and
photosynthesis, in: Lassoie J.P., Hinckley T.M. (Eds.), Methods and approa
-
ches in tree ecophysiology, CRC Press, Boca Raton, FL, 1991, pp. 329–355.
[43] Sprugel D.G., Ryan M.G., Brooks J.R., Vogt K.A., Martin T.A., Res
-
piration from the organ level to the stand, in: Smith W.K., Hinckley T.M.
(Eds.), Resource Physiology of Conifers: Acquisition, Allocation, and Utiliza
-
tion, Academic Press, New York, 1995, pp. 255–300.
[44] Stockfors J., Respiratory losses in Norway spruce. The effect of
growth and nutrition. (Paper III). Acta univ. agricult. suec. (Silvestria) 20,
1997.
[45] Stockfors J., Temperature variations and distribution of living cells
within tree stems: implications for stem respiration modelling and scale-up,
Tree Physiol. 20 (2000) 1057–1062.
[46] Stockfors J., Linder S., Effect of nitrogen on the seasonal course of
growth and maintenance respiration in stems of Norway spruce trees, Tree
Physiol. 18 (1998) 155–166.
[47] Tjoelker M.G., Oleksyn J., Reich P.B., Modelling respiration of ve
-
getation: evidence for a general temperature-dependent Q
10
, Global Change
Biology 7 (2001) 223–230.
[48] Wullschleger S.D., Norby R.J., Hanson P.J., Growth and mainte
-
nance respiration in stems of Quercus alba after four years of CO
2
enrichment,
Physiol. Plant. 93 (1995) 47–54.
[49] Yoda K., Shinozaki K., Ogawa H., Hozumi K., Kira T., Estimation of
the total amount of respiration in woody organs of trees and forest communi
-
ties, J. Biol. Osaka 16 (1965) 5–26.
[50] M., Annual ring formation on Norway spruce in mountain forest,
Med. Nor. Skogførs. Ves. 97 (1969) 165–184. In Norwegian with English
summary.
To access this journal online:
www.edpsciences.org
812 É. Ceschia et al.