Báo cáo khoa học: " Identification of PCR-based markers linked to wood splitting in Eucalyptus grandis" pdf
Bạn đang xem bản rút gọn của tài liệu. Xem và tải ngay bản đầy đủ của tài liệu tại đây (203.18 KB, 4 trang )
E. Barros et al.Wood splitting markers in E. grandis
Note
Identification of PCR-based markers linked to wood splitting
in Eucalyptus grandis
Eugenia Barros
a*
, Steve Verryn
b
and Marianne Hettasch
b
a
CSIR-Bio/Chemtek, P.O.Box 395, Pretoria 0001, South Africa
b
CSIR-Environmentek, P.O.Box 395, Pretoria 0001, South Africa
(Received 5 July 2001; accepted 17 April 2002)
Abstract – Wood splitting is a defect in eucalyptus which results in considerable losses when converting logs to solid wood products. Common
-
ly in forestry, molecularmarkers are identified through studying pedigrees from a single cross. This limits the application of these markers to that
population. Here we report the identification of putative molecular markers linked to wood splitting in an open-pollinated Eucalyptus grandis
population. Although the power to detect molecular markers in this population is low, the resultant markers are likely to be more robust and be
transferred to non-related populations. Bulked segregant analysis was used in the identification of markers from high and low splitting indivi-
duals that were selected by means of backward selection using Best Linear Prediction. The bulks were screened for differences using amplified
fragment length polymorphic and random amplified polymorphic DNA primers. Following regression analysis one putative sequence characte-
rized amplified region has been linked to splitting.
wood splitting / molecular markers / Eucalyptus grandis / BLP
Résumé – Identification de marqueurs PCR liés au défaut de fente du bois chez Eucalyptus grandis. La fente du bois est un défaut chez l’eu-
calyptus qui entraîne des pertes considérables lors de la transformation du bois en produits finis massifs. Classiquement chez les arbres fores-
tiers, les marqueurs moléculaires sont identifiés en étudiant les descendants d’un seul croisement. Ceci limite l’application de ces marqueurs à
cette seule population. Dans cette étude, nous avons cherché à identifier des marqueurs moléculaires liés vraisemblalement au défaut de fente du
bois dans une population d’Eucalyptus grandis issue de pollinisation libre. Bien que le pouvoir de détection de marqueurs moléculaires dans
cette population soit faible, il est probable que les marqueurs résultants soient plus robustes et transférables à des populations non apparentées.
Une analyse de ségrégation en mélange (BSA) a été utilisée pour l’identification de marqueurs à partir d’individus contrastés pour le défaut de
fente et choisis par sélection à rebours à l’aide de la BLP (Best Linear Prediction). Les deux lots ainsi constitués ont été examinés pour leur diffé
-
rence à l’aide de marqueurs ADN (AFLP et RAPD). À la suite d’une étude de régression, nous avons pu relier une SCAR putative au défaut de
fente du bois.
défaut de fente du bois / marqueurs moléculaires / Eucalyptus grandis / BLP
1. INTRODUCTION
Growing pressure to stop the harvesting of indigenous for
-
ests has resulted in an international shift towards plantation
grown hardwoods. To date only approximately 10% of the
world’s needs for hardwoods come from plantations. Euca
-
lyptus is an important plantation species and is the most
widely planted hardwood species in the tropical and subtropi
-
cal regions.
Eucalyptus grandis is the most extensively grown
eucalypt species in South Africa. This species boasts good
growth in most forestry areas. It is suitable for pulp wood pro
-
duction but its suitability for sawn timber production is lim
-
ited by its tendency to split. Wood splitting results in
significant losses when converting logs into solid wood prod
-
ucts. Currently wood splitting can only be assessed after fell
-
ing the trees from the age of 6 years onwards due to late
expression of the trait. The need for destructive sampling and
Ann. For. Sci. 59 (2002) 675–678 675
© INRA, EDP Sciences, 2002
DOI: 10.1051/forest:2002055
* Correspondence and reprints
Tel.: +2712 841 3221; fax: +2712 841 3651; e-mail:
the late expression of the trait are serious constraints in breed
-
ing programmes for sawn timber. Wood splitting is a herita
-
ble trait but is also under environmental influence. Narrow
sense heritablities of between 0.3 and 0.6 (Verryn, 2001, per
-
sonal communication) have been reported. It is assumed that
wood splitting is a polygenic trait.
At present conventional tree breeding techniques have
been successfully used to improve the quality of eucalypts
plantations to produce high quality logs. However, the avail
-
ability of molecular markers for wood splitting would be of
great advantage for any Eucalyptus sawn timber breeding
programme.
In forestry, marker development is generally based on a
limited number of crosses with the resultant markers being
only applied to a small number of trees. Due to the limited ap
-
plication and the high costs involved, marker-assisted selec
-
tion is not yet routinely applied in tree breeding programmes
[9]. In our research we explored the possibility of developing
more robust markers that could also be used on non-related
E. grandis populations.
The aim of our research was to use the tools provided by
molecular biology in combination with quantitative genetics
and statistics to develop a non-destructive and early screen-
ing method to identify E. grandis seedlings or young plants
that are low splitters.
2. MATERIALS AND METHODS
Two unrelated, open pollinated E. grandis trials were used in this
study. The first trial, called the development trial was used to iden-
tify putative molecular markers linked to splitting. This trial is an
open-pollinated population grown from local unimproved P
0
selec
-
tions from South African plantations. A total of 10 high splitting and
16 low splitting trees were selected from this trial by means of back
-
ward selection. Backward selection ranks individuals on their prog
-
enies’ performance. The backward selection was performed by
means of Best Linear Prediction (BLP). Theoretically the BLP gives
the best correlation between the true genetic value and the predictive
genetic value. This was done using the programme Matgen 5.6, a
BLP package for unbalanced index selection in tree breeding [5].
The second trial was used as a verification trial and the individu
-
als were selected by means of forward selection where individuals
are evaluated based on their own performance. A total of 21 high
splitting and 31 low splitting trees were selected from a total of
750 trees. The verification trial is an open-pollinated population that
has been established from seed imported from Florida, USA.
The trees were evaluated for splitting using a splitting score
which took into consideration the number, the length and width of
the cracks. The splitting scores were then corrected for the diameter
of the tree.
DNA was isolated from leaf material collected from each of the
78 trees belonging to the 2 trials following the modified protocol of
Rogers and Bendich [3]. Two molecular marker techniques were
used in the generation of DNA fingerprints for the identification of
polymorphisms. These were RAPDs (Random Amplified Polymor
-
phic DNA) [8] and AFLPs (Amplified Fragment Length Polymor
-
phism) [6]. All the resulting bands were scored on a scale ranging
from 0 to 4 according to the intensity of the bands. A score of 0 rep
-
resented the absence of a band and a score of 4 a very dark band.
In addition the bulked segregant analysis (BSA) [2, 7] technique
was used to identify markers linked to the gene/s coding for split
-
ting/non-splitting. This technique has proved to be very successful
in populations resulting from a single cross that segregate for the
trait of interest. We used the BSA technique on an open-pollinated
population, which is likely to be in linkage equilibrium. Linkage dis
-
equilibrium between marker alleles and QTL alleles, is however, a
prerequisite for marker detection, as unlinked markers and markers
in linkage equilibrium with QTL are expected to be randomly dis
-
tributed across bulks [1]. Only markers that are very tightly linked to
the QTL are likely to show linkage disequilibrium. The power of de
-
tection is drastically reduced by targeting only very closely linked
markers. High numbers of potential markers need to be analysed. If,
however, markers are found, these are likely to be more robust and
may be valid for more than just the population that was used to de
-
velop them. Another challenge is to find more than one marker
linked to splitting since we assume this trait to be polygenic.
Two DNA bulks/pools were initially made for each trial, one be
-
ing the high splitting bulk and the other the low splitting bulk. The
principle of DNA pooling/bulking is the grouping together of
informative individuals for a specific trait so that a particular
genomic region can be studied in a randomised genetic background
of unlinked loci [7]. The RAPD technique uses random 10-base
oligonucleotides as primer and the polymerase chain reaction (PCR)
to amplify specific DNA fragments. The RAPD primers were ob-
tained from UBC RAPD primer set. The RAPD primers that showed
polymorphisms between the bulks were then tested in the individu-
als making the bulks. The polymorphic bands were considered “pu-
tative markers” if they were present in 4 or more individuals of one
of the unbulked populations and absent in the other unbulked popu-
lation. In total 828 RAPD primers were tested in the first trial.
We attempted to convert the “putative” RAPD markers into
SCAR (sequence characterized amplified regions) markers. The
SCARs were derived by cloning and sequencing the 2 ends of the
amplified products of the RAPD marker. The sequence was then
used to design oligonucleotide primer pairs of 19–24mer that result
in the reproducible amplification of single loci when high annealing
temperatures are used. The AFLP technique uses genomic DNA di
-
gested with restriction enzymes as a PCR template. In this technique
the binding between short PCR primers and DNA restriction frag
-
ments is very specific. We used the Mse1/EcoR1 and Mlu1/Mse1 re
-
striction enzyme systems. The fingerprints generated were scored
for polymorphisms in the same way as the RAPD fingerprints.
The statistical analysis aimed at finding models that use the
scores of a limited number of fragments to predict wood splitting in
E. grandis. Using the data sets generated from the RAPD scores for
the development trial, a number of models were developed to predict
splitting using the statistical package SAS [4]. The data set which
was used for the development of the models consisted of over a
thousand fragments for each of the 26 trees of the first trial – this
corresponds to data generated from 91 RAPDs and 4 AFLPs. Step
-
wise (forward) regression was performed on the data set to identify
any set of fragments that were possibly linked to either high or low
splitting. The fragments that together described the variation in the
splitting index value were combined in a regression equation that
may be used to predict splitting.
Regression models were generated using the model development
trial data set and were tested on the verification trial data set. The
models that were developed were verified by entering the scores of
the fragments from the verification data set into the regression equa
-
tions. This resulted in the predicted values for wood splitting for the
676 E. Barros et al.
31 low and 21 high split trees. The predicted value was then com
-
pared to the observed value by means of a correlation coefficient.
Significant and high correlations may indicate linkage between the
DNA bands and wood splitting genes.
3. RESULTS
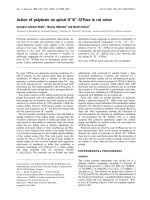
A total of 118 RAPD primers showed polymorphisms in
the first trial and were used to generate fingerprints of the
52 unbulked individuals that formed the verification trial.
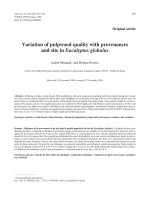
Figure 1 shows the RAPD fingerprint of the unbulked indi-
viduals of the development trial for RAPD A. Two RAPD
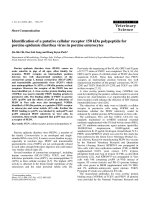
polymorphic bands were converted into SCARs. The SCAR
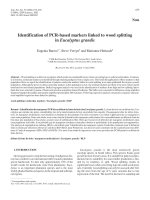
markers were verified by hybridisation with the correspond-
ing DIG-labelled RAPD bands. The results of the hybridisa-
tion showed that RAPD B putative marker was successfully
converted into a SCAR marker and was present in the indi-
viduals for which the RAPD “putative marker” was origi-
nally present (figure 2). The RAPD A putative marker did not
hybridise to the SCAR marker suggesting that the band
cloned was not the correct band (results not shown). Two
AFLP markers have also been converted into SCAR markers
and the data is being analysed statistically.
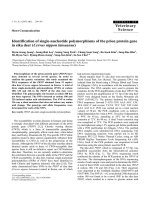
Many regression models have been tested. The best corre
-
lation that was obtained was around 0.4 (significant at the 5%
level). Some of the models gave no correlation between the
predicted and the observed splitting scores, whereas some
gave relatively weak but significant correlations. A perfect
match between the observed and the expected value would
give a correlation coefficient of 1.0. More models will be
tested to further improve the correlation. The correlation of
the predicted versus obtained splitting scores from the best
model is shown in figure 3.
4. DISCUSSION
Wood splitting seems to be a polygenic trait and it is there-
fore highly unlikely that a single DNA marker will be suffi-
cient to distinguish between high and low splitting trees. The
procedure of forward regression allows the development of
models that are based on several DNA fragments. This in
-
creases the chances of finding fragments that are linked to
more than one gene. A large number of fragments have to be
screened and a large number of models have to be tested to in
-
crease the chances of obtaining a useful model. Once a useful
Wood splitting markers in E. grandis 677
λ
λ
Figure 1. Amplification products using
RAPD A primer to identify markers
linked to splitting. The polymorphism
linked to splitting is marked by arrows.
First lane is λPstI marker and the other
lanes correspond to the 26 development
trial individuals. H means high splitters
and L means low splitters.
λ
PstI
SCAR L4
RAPD L4
SCAR L5
SCAR L8
SCAR L12
RAPD L5
RAPD L8
RAPD L12
SCAR L4
RAPD L4
SCAR L5
SCAR L8
SCAR L12
RAPD L5
RAPD L8
RAPD L12
Figure 2. Hybridization of the cloned
RAPD putative marker B (arrowed) to a
Southern Blot of 4 low splitting individ
-
uals (L4, L5, L8 and L12). First lane is
λPstI marker.
model is obtained with a reasonable correlation a splitting in-
dex will be generated that will be used in breeding
programmes. However the fact that the 2 trials are unrelated it
may to a certain extent explain our difficulty in obtaining
markers linked to splitting. Although ultimately we aimed at
identifying a wood splitting marker that would work in basi
-
cally all E. grandis material and would be linked to all the
genes that are involved in splitting this may be too ambitious.
The approach taken in this study using random populations
and BSA had a low power to detect marker-QTL association
compared to the traditional approaches which uses con
-
trolled-cross mapping populations. However the marker gen
-
eration in the traditional approach is limited to the mapping
population from which it was generated.
We have identified 2 other trials that are derived from the
development trial and will be used as verification trials. A
splitting index will then be generated for the development
trial to be used by breeders using progeny derived from this
original trial. We also need to identify a trial derived from the
verification trial that can be used to verify the markers identi
-
fied for this trial. Similarly a splitting index will be generated
to be used by breeders using progeny originated from this
trial. We are very confident that we will succeed in generat
-
ing a set of molecular markers that can be used to help euca
-
lyptus breeders to screen their tree material for low splitters.
REFERENCES
[1] Lynch M., Walsh B., Genetics and analysis of quantitative traits, Si
-
nauer Associates, Inc., Sunderland, USA, 1998.
[2] Michelmore R.W., Paran I., Kesseli R.V., Identification of markers lin
-
ked to disease resistance genes by bulked segregant analysis: A rapid method
to detect markers in specific genomic regions using segregating populations,
Proc. Natl. Acad. Sci. USA 88 (1991) 9828–9832.
[3] Rogers O.S., Bendich A.J., Extraction of DNA from plant tissues, in:
Gene Research Manual, 1986, pp. 1–6.
[4] SAS Institute Inc., SAS Users Guide: Basics (1985) 5th Edition. Cary,
NC, USA.
[5] Verryn S.D., Roux C.Z., A memory-friendly algorithmic strategy for
Best Linear Prediction (BLP), in: Tree Improvement for Sustainable Tropical
Forestry-Conference Proceeding, Dieters M.J., Matheson A.C., Nikles D.G.,
Harwood C.E., Walker S.M. (Eds.), Caloundra, Australia: Queensland Fores-
try Research Institute, 1996.
[6] Vos P., Hogers R., Bleeker M., Reijans M., van de Lee T., Hornes M.,
Frijters A., Pot J., Peleman J., Kuiper M., AFLP: a new technique for DNA fin
-
gerprinting, Nucleic Acids Res. 23 (1995) 4407–4414.
[7] Wang G.L., Paterson A.H., Assessment of DNA pooling strategies for
mapping of QTLs, Theor. Appl. Genet. 88 (1994) 355–361.
[8] Williams J., Kubelik A., Livak K., Rafalski J., Tingey S., DNA poly
-
morphisms amplified by arbitrary primers are useful as genetic markers, Nu
-
cleic Acids Res. 18 (1990) 6531–6535.
[9] Yanchuk A.D., The role and implications of biotechnological tools in
forestry, Unasylva. 52 (2001) 53–61.
To access this journal online:
www.edpsciences.org
678
E. Barros et al.
-1.5
-1
-0.5
0
0.5
1
1.5
-1.5 -1 -0.5 0 0.5 1 1.5
Observed Splitting Scores
Predicted Splitting Scores
High splitters
Low splitters
Figure 3. Scores predicted by a model versus observed splitting
scores. The trees falling into the first and third quadrants have pheno-
types which were predicted incorrectly.