Báo cáo toán học: "Modelling age- and density-related gas exchange of Picea abies canopies in the Fichtelgebirge, Germany" docx
Bạn đang xem bản rút gọn của tài liệu. Xem và tải ngay bản đầy đủ của tài liệu tại đây (299.23 KB, 15 trang )
Original article
Modelling age- and density-related gas exchange
of Picea abies canopies in the Fichtelgebirge, Germany
Eva Falge*, John D. Tenhunen, Ron Ryel, Martina Alsheimer and Barbara Köstner
Biometeorology, ESPM, Univ. of California, Berkeley, CA 94720, USA
(Received 22 July 1999; accepted 1 December 1999)
Abstract – Differences in canopy exchange of water and carbon dioxide that occur due to changes in tree structure and density in
montane Norway spruce stands of Central Germany were analyzed with a three dimensional microclimate and gas exchange model
STANDFLUX. The model was used to calculate forest radiation absorption, the net photosynthesis and transpiration of single trees,
and gas exchange of tree canopies. Model parameterizations were derived for six stands of
Picea abies (L.) Karst. differing in age
from 40 to 140 years and in density from 1680 to 320 trees per hectare. Parameterization included information on leaf area distribu-
tion from tree harvests, tree positions and tree sizes. Gas exchange was modelled using a single species-specific set of physiological
parameters and assuming no influence of soil water availability. For our humid montane stands, these simplifying assumptions
appeared to be acceptable. Comparisons of modelled daily tree transpiration with water use estimates from xylem sapflow measure-
ments provided a test of the model. Estimates for canopy transpiration rate derived from the model and via xylem sapflow measure-
ments agreed within ± 20%, especially at moderate to high air vapor pressure deficits. The results suggest that age and density
dependent changes in canopy structure (changes in clumping of needles) and their effect on light exposure of the average needle lead
to shifts in canopy conductance and determine tree canopy transpiration in these managed montane forests. Modelled canopy net
photosynthesis rates are presented, but have not yet been verified at the canopy level.
norway spruce / xylem sapflow / canopy transpiration / canopy light use efficiency / biosphere-atmosphere interactions
Résumé – Effet de l’âge et de la densité sur la modélisation des échanges gazeux dans la canopée de peuplements de
Picea
abies
(L) Karst. dans le Fichtelgebirge (Allemagne). Les différences d’échange d’eau et de dioxyde de carbone au niveau de la
canopée qui se produisent à la suite de changements dans la structure et la densité des arbres dans des peuplements d’Epicéa commun
en zone de montagne de l’Allemagne centrale, ont été analysées selon le modèle tridimensionnel de microclimat et d’échange gazeux
STANDFLUX. Le modèle a été utilisé pour calculer l’absorption du rayonnement par la forêt, le bilan photosynthétique net et la
transpiration d’arbres individuels, et les échanges gazeux au niveau de la canopée. La paramétrisation du modèle a été effectuée à
partir des mesures dans six peuplements de
Picea abies (L.) Karst. dont l’âge variait de 40 à 140 ans et la densité des peuplements de
1680 à 320 arbres par hectare. La paramétrisation incluait l’information sur la distribution de la surface foliaire à partir de l’exploita-
tion d’arbres, la position des arbres et leurs dimensions. Les échanges gazeux ont été modélisés en utilisant une série de paramètres
physiologiques spécifiques de l’espèce, et en supposant qu’il n’y avait aucune influence de la disponibilité en eau. Pour les peuple-
ments considérés en zone humide de montagne, ces hypothèses semblent acceptables. La comparaison de l’estimation par modélisa-
tion de la transpiration journalière avec l'estimation de l’eau absorbée par la mesure du flux de sève xylémique a permis de tester le
modèle. L’estimation du taux de transpiration par la canopée dérivé du modèle par la mesure du flux xylémique concorde à
± 20 %,
spécialement lorsque les déficits de pression de vapeur sont modérés ou élevés. Les résultats suggèrent que les changements dans la
structure de la canopée, dépendant de l’âge et la densité et leurs effets sur l’exposition à la lumière de l’aiguille moyenne conduisent
Ann. For. Sci. 57 (2000) 229–243 229
© INRA, EDP Sciences
* Correspondence and reprints
Tel. (49) 921.55.2576; Fax. (49) 921.55.2564; e-mail:
E. Falge et al.
230
1. INTRODUCTION
Long-term eddy covariance measurements over tem-
perate forests are now more commonly used to quantify
annual net ecosystem CO
2
exchange of different forest
types [4, 22, 64]. It is anticipated that flux measurement
networks will help clarify the role played by temperate
forests in the global carbon cycle [4]. However, large
variation and uncertainty exists in eddy-flux estimates
obtained under seemingly similar environmental condi-
tions. These problems may be due in part to the continu-
ous shifts in the footprint along with the heterogenous
nature of forest ecosystems. For a better interpretation of
eddy covariance signals, as well as whole ecosystem
response, it is important to improve our understanding of
natural variation in processes that occur within individ-
ual ecosystem compartments, e.g., to describe functional
heterogeneity that occurs in the vicinity of experimental
towers, to map structure within the footprint area of the
towers [3, 61], and to eventually associate specific mea-
surements of gas exchange with processes occurring at
specific locations [64].
Xylem sapflow methods provide a means of charac-
terizing local water use by the forest canopy [e.g., 16,
24, 34, 35, 40, 41, 48, 50]. Sapflow sensors were used in
six spruce stands of differing ages within a montane
catchment in the Lehstenbach watershed (Fichtelgebirge,
Germany) in order to examine time dependent changes
in tree canopy transpiration [1]. As stands age in these
montane forests, density decreases from several thou-
sand trees per hectare to only several hundred per
hectare, as a result of both management activities, and
natural self-thinning. Along with these structural
changes, tree canopy transpiration decreases to half of
the rate found in young stands even though stand total
leaf area remains high [1].
A three- dimensional gas exchange model (STAND-
FLUX; cf. [18]), which includes sub-models for light
interception and for gas exchange of individual branches
or leaves, was used to examine variation in tree canopy
gas exchange of the six Norway spruce canopies. The
model accounts for site-specific stand structure, and esti-
mates gas exchange for clusters of trees, each tree with
foliage distributed within vertical layers and horizontally
in a series of concentric cylinders. This study investi-
gates whether the observed differences in tree transpira-
tion result from physiological changes or due to altered
clumping of the foliage in the canopy. Associated
changes in canopy net photosynthesis and water use effi-
ciencies are also predicted, but these have not yet been
independently validated.
2. METHODS
2.1. Field research sites
Structural characteristics were determined for six
Norway spruce stands occurring in proximity in the
Fichtelgebirge in Northern Bavaria (Lehstenbach catch-
ment, latitude 50° 9' N, longitude 11° 52' E, c.a. 775 m
above sea level). The stands differed either in age and
structure, in exposition, or in soil characteristics
(Table I). In the following text, the 40 year-old stands
Weiden Brunnen, Schanze , and Schlöppner Brunnen
with low, medium, and high cumulative basal areas will
be referred to as “40LB”, “40MB”, and “40HB” respec-
tively, the older stands Süßer Schlag, Gemös, and
Coulissenhieb according to their age will be referred to
as “70”, “110”, and “140”. Tree density varied between
320 and 1680 trees per ha
-1
, average projected leaf area
index (LAI) determined via harvesting methods varied
between 5.3 and 7.9 m
2
m
-2
. Average tree height in the
stands is between c.a. 15 and 26 m. The soils are perme-
able brown earths and podsols on phyllite and gneiss.
During the period 1992 to 1994, the mean annual tem-
perature was 5.8 °C, the mean January temperature was
–1.0 °C, and the mean in July was 15.6 °C. Mean annual
precipitation during this period was 885 mm.
2.2. Observations of Sap flow
Investigations were carried out in 1994 and 1995 from
the middle of April to the middle of November (see
details in Alsheimer et al. [1]). In each stand, sapflow
installations were made on 10 trees except in the case of
the 140-year-old stand where 12 to 13 trees were exam-
ined. Two methods for measuring xylem sapflow were
used: dynamic thermal flowmeters constructed according
to Granier [23, 24] and the steady-state, null-balance
à un décalage dans la conductance de la canopée et déterminent la transpiration dans la canopée de l’arbre de ces forêts aménagées de
montagne. Les taux de photosynthèse nette modélisés de la canopée sont présentés, mais n'ont pas encore été validés au niveau des
mesures.
épicéa / modèle tridimentionnel STANDFLUX / flux de sève / transpiration de la canopée / efficience d'utilisation de la
lumière / interaction biosphère-atmosphère
Modelling of Picea abies
231
method of Cermák et al. [14, 15]; Kucera et al. [37]; and
Schulze et al. [62].
With the Granier methods applied in all stands, cylin-
drical heating and sensing elements were inserted into
the trunks at breast height, one above the other c.a.
15 cm apart, and the upper element was heated with con-
stant power. The temperature difference sensed between
the two elements was influenced by the sap flux density
in the vicinity of the heated element. Sap flux density
was estimated via calibration factors established by
Granier [23].
The steady-state, null-balance instrumentation was
used to obtain an additional estimate of water use by
individual trees within the 140 year-old stand. A con-
stant temperature difference of 3K was maintained
between a sapwood reference point and a heated stem
section. The mass flow of water through the xylem of the
heated area is proportional to the energy required in
heating.
Total sapflow per tree was obtained by multiplying
sap flux density by the cross-sectional area of sapwood
at the level of observation [1]. Sapwood area of sample
trees was estimated from regressions, relating CBH (cir-
cumference at breast height) to sapwood area determined
either with an increment borer, by computer tomography
[26, 27], or from stem disks of harvested trees. The up-
scaling of canopy fluxes from xylem sap flow measure-
ments was obtained by multiplying average flux densi-
ties (sapflow per sapwood area) of ten (for stand “140”
14) representative trees by total sapwood of the stand
and dividing by the ground surface area. The trees were
selected to best represent the CBH distribution of the
canopy, and, therefore, of varying CBH and sapwood
area, affecting their relative contribution to total canopy
fluxes.
2.3. Model description
2.3.1. Branch gas exchange model
Photosynthesis of needled branches was described
according to Farquhar et al. [21] and Harley and
Tenhunen [28]. Stomatal conductance was included
according to Ball et al. [5] as described in Falge et al.
[17]. Details of the application are described in
Appendix 1.
2.3.2. Gas exchange of individual trees and canopies
The model STANDFLUX [18] calculates water use
and CO
2
fixation of individual target trees surrounded by
trees of varying size and structure, considering species-
specific leaf physiology, three dimensional radiation
interception, and vertical microclimate gradients. One
tree consists of a series of concentric cylinders and verti-
cal layers. The resultant subsections are characterized by
homogeneous leaf and stem densities as well as leaf and
stem angles as derived from tree harvests. The light
interception submodel calculates direct beam and sky
diffuse radiation (PPFD) for each point of a cubic matrix
superimposed over the tree. Single tree transpiration in
STANDFLUX is calculated using a leaf area weighted
sum of the rate of water use in all subsections of the tree
(determined by multiplying the average transpiration rate
for all matrix points in the subsection by the leaf area of
the subsection and then summing subsections - see Falge
et al. [18]). Details of the light interception algorithms
and tree structural description are given in Ryel [57],
Ryel et al. [58], and Falge et al. [18].
The contribution of the tree classes - defined by tree
size - to canopy gas exchange is estimated from the fre-
quency of occurrence of the different classes in the
Table I. Stand characteristics as used in the model parameterization for six Norway spruce stands in the Lehstenbach catchment in
the Fichtelgebirge, Northern Bavaria. See also Alsheimer et al. (1998).
Site Weiden Brunnen Schanze Schlöppner Brunnen Süßer Schlag Gemös Coullisenhieb
“40LB” “40MB” “40HB” “70” “110” “140”
Stand age (years) 40 40 40 70 110 140
Exposition southwest northeast south southeast south southwest
Tree density (tree ha
-1
) 1010 1010 1680 500 450 320
Mean stand height (m) 16.1 17.8 14.7 24.1 25.7 25.2
Mean crown length (m) 10.0 7.7 6.4 11.5 13.8 11.4
Mean crown projection (m
2
) 10.3 7.2 7.7 18.6 18.8 22.0
Mean circumference at 60.0 66.4 50.5 108.7 107.6 115.2
breast height (cm) (±16.3) (±18.5) (±19.9) (±19.1) (±22.4) (±23.5)
Cumulative basal area (m
2
ha
-1
) 30.9 37.8 39.5 48.8 42.4 35.3
LAI (m
2
m
-2
) 5.3 7.1 6.5 7.9 7.6 6.5
Understory cover (%) 66 19 23 85 76 83
E. Falge et al.
232
canopy. With information on the (x, y) coordinates of the
trees in the stand, the gas exchange of a cluster of trees
with clumped leaf area similar to observation can be cal-
culated. Such clusters of trees were the subject of
sapflow observations as reported by Alsheimer et al. [1].
Thus, the model provides a good representation of the
actual experimental situation. For model parameteriza-
tion, structural information such as tree height, crown
length, crown projection area, distribution of leaf area
density (LAD), distribution of stem area density (SAD),
leaf angles, and stem angles in subsections are required.
2.4. Model parameterization
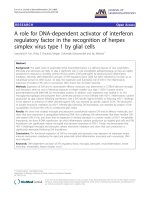
2.4.1. Canopy and individual tree structure
The positions of trees in each stand and their crown
projections are illustrated in figure 1. Shaded crowns
indicate those trees on which sapflow was measured.
The frequency distribution of tree circumferences at
breast height (CBH) was obtained at the six locations,
and found to be normally distributed (data not shown)
with the lowest mean of 50.5 at “40HB”
(table I) and
highest of 115 cm at “140”. Tree heights and crown
lengths were measured with a Suunto-Hypsometer (PM-
5/ 1520 PCP, 02920 Espoo, Finland). Crown projection
areas (CPA) were estimated from below the crown by
vertical sighting at eight locations around each tree. The
octagonal CPA were used to obtain circular approxima-
tions for the cylindrically modelled trees. Off-centered
trunks were re-centered within the resulting CPAs to
accommodate STANDFLUX. CBH was used to define
five tree size classes. A representative tree from each
class was harvested to estimate leaf surface and project-
ed stem area densities within the crowns
(table II). The
harvested trees were cut into one- meter sections. From
each section, a subset of sample branches were used to
determine bare and needled length of branches and nee-
dle mass as related to branch basal diameter. With the
Figure 1. Relative tree positions and crown projected areas of the trees at the research sites in the Fichtelgebirge, Germany. Circular
crown projections (CPA) were used to accommodate STANDFLUX; gray CPAs indicate the trees used for xylem sapflow measure-
ments.
Modelling of Picea abies
233
regressions obtained, the needle mass of remaining
branches was estimated from their basal diameters and
distributed along the tree according to mapped branch
insertion points. Analogously, the branch mass and
branch surface areas were determined.
Leaf area density (LAD) and stem area density (SAD)
for single crown volumes were calculated from the
respective absolute areas (leaf surface and stem projected
area, LSA and SAI) according to the dependencies on
CBH given in table II. The conversion used to obtain
effective leaf area for light interception from LSA is
given in Appendix 2. Horizontal and vertical changes in
LAD and SAD in model trees were not considered in this
application. Individual trees were constructed of two lay-
ers and two cylinders, but ten different tree size classes
in the canopy were used. Considering the actual range of
stand LAI encountered, simplification of the tree struc-
ture did not influence modelled water flux. Daily sums
of transpiration are not affected at average canopy LAI
above 5.3 (see sensitivity analysis in Falge et al. [18]),
while underestimation of daily sums of canopy net pho-
tosynthesis increases from zero at a canopy LAI of 5.3 to
10% at a canopy LAI of 8.0 (Falge et al. [18], their
figure 5).
2.4.2. Physiological parameterization
The physiological parameters for the Norway spruce
branch gas exchange model (PSN6) were determined
independently by means of cuvette gas exchange mea-
surements of branches with up to 3 needle age classes
[17] and were not adjusted in the process of examining
xylem sapflow data. No information was available for
needle gas exchange for trees of different age in the
Fichtelgebirge, but Falge et al. [17] showed that parame-
ters derived from 30-50 year-old spruce trees could be
transferred to a 120 year-old tree in Lägeren
(Switzerland), sufficiently reproducing measured gas
exchange rates. In this study, the gas exchange reaction
for needles of all stands and for the entire tree crowns
was described using a shade leaf parameterization deter-
mined appropriate for the Fichtelgebirge region with
high LAI (table III). The physiological capacity of
Norway spruce needles for electron transport, carboxyla-
tion, and dark respiration varies seasonally in agreement
with gas exchange observations from several other tree
species [10, 12, 47, 49]. We assumed that reduced soil
water availability did not affect stomatal conductance
during the summers 1994 and 1995 due to frequent rain
events.
2.4.3. Meteorological drivers
The measurement of radiation, air temperature above
and below the canopy, humidity, wind speed, CO
2
con-
centration, and atmospheric pressure for the modelling of
the Norway spruce canopies in the Fichtelgebirge was
described in Falge et al. [18]. The measurements were
obtained with a 30 meter high telescope mast [32], dur-
ing 1994 at “40LB”, and 1995 at “140” (figures 2 and 3).
Hourly means of the data stored at 10-minute intervals
were used for the simulations. The stands “40LB” and
“140” were immediately adjacent and the same meteoro-
logical conditions were used for both. For the sites
“40MB”, “40HB”, and “70”, temperature and vapor
pressure deficit of the air at the top of the canopy were
measured. Compared to “40LB” and “140”, the tempera-
tures at “40MB”, “40HB” and “70” were about 12%
lower; vapor pressure deficit of the air was on average
10% lower for “40HB” and “70”, and 20% lower for
“40MB”, the north-east facing site. For “110” no meteo-
rological measurements were conducted on the site and
inputs to the model were assumed the same as “40LB”
and “140”. Differences in soil surface temperatures and
canopy wind profiles were not considered in this model-
ling application. Although wind speed influences the
boundary layer conductance of leaves or branches, the
boundary layer conductance in coniferous forests is
approximately an order of magnitude greater than
Table II. Coefficients of a power function to calculate average needle surface area (LSA, m
2
tree
-1
) and average projected stem area
(SAI, m
2
tree
-1
) from the circumference at breast height (CBH, cm) for the four different age classes of Norway spruce stands, used
for the STANDFLUX parameterization of leaf and stem area densities.
Sites Number LSA =
a*CBH
b
SAI = a*CBH
b
of trees (LSA in m
2
tree
-1
, CBH in cm) (SAI in m
2
tree
-1
, CBH in cm)
nab r
2
abr
2
40-year-old 15 0.00116 2.81 0.93 0.000110 2.83 0.89
70-year-old 5 0.00514 2.39 0.68 0.000048 2.41 0.59
110-year-old 5 0.00520 2.39 0.83 0.000043 2.40 0.78
140-year-old 5 0.00685 2.35 0.95 0.000062 2.38 0.91
E. Falge et al.
234
stomatal conductance [33], and therefore effects of
changed wind profiles on canopy conductance are low.
2.5. Simulations
Simulations of canopy CO
2
and H
2
O exchange were
carried out for the periods May through September 1994
and April through October 1995. Since there is a time
lag between the onset of transpiration in the canopy and
measured flow of water in the trunk [e.g., 29], i.e., the
model represents leaf responses while sapflow is influ-
enced further by internal water storage, model validation
at the individual tree level involves comparing the inte-
grated daily sums of measured and estimated water use.
Stand level transpiration and net CO
2
fixation is estimat-
ed as the transpiration and net photosynthesis rate of the
mean individual tree in each size class multiplied by the
number of trees per ground area in the class, and then by
integrating over all classes. Although simulations for vir-
tual canopies showed high variation within a tree class
(Falge et al. [18], their
table V), calculations in the cur-
rent application were performed only for one tree per
class, namely that used for xylem sapflow measure-
ments. This approach allowed comparisons at single tree
level and reduced computer calculation time. While
stand transpiration rate represents water loss through the
tree crowns, net CO
2
fixation is calculated for needled
branch ends, e.g., maintenance or growth respiration for
the woody (bare) component of the canopy is not
included.
Table III. Constants and activation energies utilized to determine temperature and light dependent values of the photosynthesis
mdoel parameters for branches of Norway spruce in the Fichtelgebirge region. Parameters give seasonal variability of gas exchange
on a needle surface area. For definition of the parameters, and carboxylase kinetics see Falge et al. [17].
Parameter Values Units
Dark
E
a
(R
d
) May-June 63500 J mol
-1
Respiration July-Aug. 15 64500 J mol
-1
Aug. 16-Sept. 64000 J mol
-1
Oct April 64000 J mol
-1
f(R
d
)25
Electron
c(P
ml
) May-June 19.55 -
transport July-Aug. 15 19.20 -
capacity Aug. 16-Sept. 19.30 -
Oct April 19.35 -
∆H
a
(P
ml
) 55000 J mol
-1
∆H
d
(P
ml
) 215000 J mol
-1
∆S(P
ml
) 725 J K
-1
mol
-1
Carboxylase c(Vc
max
) May-June 34.50 -
capacity July-Aug. 15 34.25 -
Aug. 16-Sept. 34.30 -
Oct April 34.30 -
∆H
a
(Vc
max
) 77000 J mol
-1
∆H
d
(Vc
max
) 215000 J mol
-1
∆S(Vc
max
) 725 J K
-1
mol
-1
Carboxylase f(K
c
) 31.95 -
kinetics
E
a
(Kc) 65000 J mol
-1
f(K
o
) 19.61 -
E
a
(K
o
) 36000 J mol
-1
f(t) –3.9489 -
E
a
(t) –28990 J mol
-1
Light use α 0.015 mol CO
2
(mol photons)
-1
efficiency
Stomatal
g
min
0 mmol m
-2
s
-1
conductance g
fac
9.8 -
Modelling of Picea abies
235
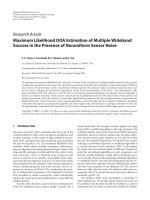
3. RESULTS
The daily integrated sums of model-estimated and
measured transpiration (liters per tree and day) of ten 40-
year-old individual trees at “40LB” and ten 140-year-old
individual trees at “140” are compared in figure 4 for the
study periods of 1994 and 1995. The different symbols
for the measurements at “140” indicate data originating
from the different xylem sap flow measurement systems
(“Granier” and “Cermák/Schulze”, see Methods). Fluxes
at “40LB” are much smaller than for “140”, as the trees
at “40LB” are much smaller and had less leaf area per
tree (52 m
2
per tree) than those at “140” (203 m
2
per
tree). The relationship between modelled daily tree tran-
spiration and measured daily xylem sap flow was linear
for most trees. However, the slope of the regression line
for individual trees at Weiden Brunnen varies between
0.4 and 1.7 (with r
2
between 0.67 and 0.90), at
Coulissenhieb between 0.6 and 3.2 (with r
2
between 0.74
and 0.89). Potential reasons for slopes differing from 1
are given in the discussion. Individual trees are not
equally representative for the canopy (see above,
Observation of Sap flow), but after weighted pooling of
the results from all trees, a relatively good agreement
between measured and modelled rates is found.
Figure 5 shows the comparison of modelled transpira-
tion rates and measured xylem sap flow rates at the
canopy level [1] for the six Norway spruce stands.
Changes in transpiration rate due to daily variation in
light, temperature and humidity are reproduced well by
STANDFLUX with r
2
for the comparison regression line
from 0.82 to 0.95, and slopes of the linear regression
between c.a. 0.84 to 1.01 (see table IV). Absolute devia-
tion of the model estimates of canopy transpiration from
estimates based on xylem sapflow measurements can
reach up to 0.5 mm per day (figure 6). However, espe-
cially when maximum daily water vapor saturation
Figure 2. Daily sums of daily photosynthetic photon flux den-
sity (
PPFD
integr.
), maximum saturation deficit of the air (D
max
),
maximum, minimum, and mean daily temperature above the
canopy (max. Ta, min. Ta, and mean Ta), atmospheric pres-
sure, CO
2
concentration and wind speed above the Weiden
Brunnen stand “40LB” from May until October 1994.
Figure 3. Daily sums of daily photosynthetic photon flux den-
sity (
PPFD
integr.
), maximum saturation deficit of the air (D
max
),
maximum, minimum, and mean daily temperature above the
canopy (max. Ta, min. Ta, and mean Ta), atmospheric pres-
sure, CO
2
concentration and wind speed above the
Coulissenhieb stand “140” from April until October 1995.
E. Falge et al.
236
deficit (D
max
) is above 8 hPa (solid symbols), the devia-
tion amounts to a maximum of c.a. ±20% of the transpi-
ration rate. At lower values for D
max
, relatively large per-
centual over- and under-estimates of daily water use may
occur (open symbols in figure 6), possibly due to lower
measurement accuracy at low sap flow rates. Deviations
appeared similar for both young and old stands, although
transpiration rates remain much lower in the 140-year
old stand.
Monthly sums of modelled canopy transpiration for
the two summer periods are compared with measure-
ments for the six Norway spruce stands in figure 7. A
better agreement is found than on a daily basis due to
error compensation of time integration. Observed and
modelled monthly transpiration sums change in the rela-
tionship to the maximum saturation deficit of the air
(D
max
) and the level of daily radiation input (indicated as
symbols in the lower panel of the figure). Monthly
canopy carbon gain calculated with STANDFLUX for
the six Norway spruce stands during the summer seasons
of 1994 and 1995 is illustrated in
figure 8. Whereas the
transpiration sums increase with increase in daily mean
temperature (not shown), D
max
, and daily radiation sum,
high temperatures in the summer months are predicted to
limit canopy carbon gain due to low photosynthetic
activity and increases in foliage dark respiration rates.
The trees of the oldest stand (“140”) used less water at
stand level, but are also predicted to be less efficient in
carbon gain.
Figure 4. Comparison of daily estimates of water use obtained
via xylem sap flow methods and from the canopy model for
transpiration of single trees at the Weiden Brunnen “40LB”
(
r
2
= 0.77) and Coulissenhieb “140” (r
2
= 0.64) sites during the
periods of 1994 and 1995 described in
figures 2 and 3.
Figure 5. Comparison of measured and modelled daily canopy
transpiration of the six Norway spruce canopies (see
table I for
stand descriptions) during the summer of 1994 (“40LB”,
“40HB”, and “140”) and 1995 (all sites). Coefficients of the
regression are given separately for the six stands in
table IV.
Table IV. Coefficients of a linear regression between modelled
and measured daily sums of transpiration for the six Norway
spruce stands in the Lehstenbach-catchment, for the vegetation
period 1994 and 1995 (“40LB”, “40HB”, and “140”) and 1995
(“40MB”, “70”, and “110”).
E
c, meas
= a * E
c,mod
+ b
(E
c
in mm d
-1
) abr
2
“40LB” (Weiden Brunnen) 0.837 0.053 0.94
“40MB”) (Schanze) 0.920 –0.101 0.93
“40HB” (Schlöppner Brunnen) 1.006 0.043 0.95
“70” (Süßer Schlag) 0.916 0.028 0.95
“110” (Gemös) 0.896 0.170 0.93
“140” (Coulissenhieb) 0.679 0.134 0.82
Modelling of Picea abies
237
4. DISCUSSION AND CONCLUSIONS
Gas exchange rates of the six Norway spruce canopies
were described with the three dimensional gas exchange
model STANDFLUX with one species-specific set of
physiological parameters neglecting effects of tree or
needle age (see below), and assuming no influence of
soil water availability at the selected research sites (con-
stant stomatal sensitivity to aboveground microclimate
factors). Estimates for canopy transpiration rate derived
from the model and via xylem sap flow measurements in
these managed montane Norway spruce forest agree
within ± 20%, especially at moderate to high air vapor
pressure deficits. Good agreement was found in the sea-
sonal patterns for water use obtained by both methods.
Leaf area index, or more specifically the three-
dimensional distribution of foliage density in a vegeta-
tion canopy, is a critical factor determining the average
light intensity to which foliage elements are exposed,
and therefore the degree to which foliage photosynthetic
capacity is utilized, i.e., the foliage distribution deter-
mines the gas exchange rate of the average needle in
these spruce stands. Since the physiological capacities of
all needles were considered to be the same in STAND-
FLUX, the large differences in modeled gas exchange
can only be ascribed to structural effects on foliage dis-
tribution (cf. figure 1) and the resulting influences on
light distribution. The results suggest strongly that age
and density dependent changes in canopy structure
(changes in clumping of needles) and their effect on light
exposure of the average needle lead to shifts in canopy
conductance and determine tree canopy transpiration in
these managed montane forests. Spruce stands 70-years-
old and older were characterized by fewer trees per
hectare, only 70 to 90% canopy closure, relatively high
leaf area indices (≥ 6.5), and high per tree leaf areas
Figure 6. Differences between the model estimates and sap
flow estimates of daily canopy transpiration of the 40-year-old
Norway spruce canopy Weiden Brunnen “40LB” (triangles)
and the 140-year-old Norway spruce canopy Coulissenhieb
“140” (circles) plotted versus canopy transpiration from sap
flow monitoring. Open symbols indicate days on which maxi-
mum daily water vapor saturation deficit was less than 8 hla,
solid symbols are for days with greater
D
max
. Negative values
describe an over-estimation of the measurements by the model.
The lines delimit the area corresponding to a measuring accura-
cy of ± 20%.
Figure 7. Monthly sums of modelled and measured canopy
transpiration based on square meter ground area for six
Norway spruce stands in the Lehstenbach catchment from May
to September 1994 and April to September 1995. Average
daily sums of photosynthetic photon flux density (PPFD, solid
diamond) and average daily maximum saturation deficit of the
air (
D
max
, open circles) as measured above “40LB” (1994) and
“140” (1995) are indicated in the lower panels of the figure.
E. Falge et al.
238
(between 158 and 203 m
2
per tree). Such trees had
denser foliage clumping on individual branches and
denser crowns, two factors leading to increased self-
shading. Thus, even on an individual tree basis, water
use was reduced due to a high degree of self-shading.
Decreased tree transpiration in the old stands was associ-
ated with a simultaneous decrease in sapwood area per
LAI or per hectare [1]. Not surprisingly, understory
cover (mainly Deschampsia flexuosa, Calamagrostis vil-
losa, and Vaccinium myrtillus) exceeded 75% in these
stands (see table I).
Silvicultural measures such as thinning will reduce
the leaf area of the stand but not the clumping of foliage
in the crown and self-shading. Spruce trees with their
strong apical control are less able to exploit the patchy
light distribution in forest canopies, and as trees age, the
ability to respond to light gaps decreases. Tree architec-
ture limits growing new leaves in areas with high light
availability [7, 51]. Due to these architectural restric-
tions, the older spruce crowns were less able to exploit
the available crown space in terms of light interception,
and as a result, transpiration and photosynthesis were
reduced compared to younger stands. Contrary to our
view, other authors [30, 55] have discussed decreased
hydraulic conductivity in older stands as the limiting fac-
tor of canopy gas exchange, whereas our results suggest-
ed an important influence of crown architecture.
Based on the modelling results as well as foliage
removal experiments on young spruce trees under con-
trolled conditions [8], it seems likely that foliage loss
that occurs in the Fichtelgebirge as a consequence of
acid deposition and Mg deficiency [63] may initially
lead to only small decreases in carbon gain at the tree
level, since the light climate of remaining needles may
be improved. Together with increased nitrogen availabil-
ity, increases in growth (as reported in Pretzsch [52]) are
potentially supported.
The parameter to which single tree gas exchange rate
is most sensitive is the leaf area assumed for the tree.
The leaf area included for model trees are derived from
their circumference using a function derived from the
leaf area of harvested trees
(table II). Difficulties in
determining this regression, the natural variability of the
leaf area of similar-sized trees, together with potential
errors in sap flow estimation (assumed radial homogene-
ity, heat storage in the trunk, etc.) are reflected in the
comparison of transpiration rates on a single tree basis
(figure 4). Furthermore, hydraulic limitations and daily
depletion of water stored in the trunk or branches may
add an additional restriction on actual water use and an
overestimation in the calculated estimate [36, 56, 60,
67]. Pooling daily results from all trees, a relatively good
agreement between measured and modelled daily rates is
found, indicating that up-scaled cuvette gas exchange
measurements at branch level and xylem sap flow mea-
surements deliver consistent data. For a discussion of
time lags in diurnal courses of sap flow and upscaled
cuvette data due to capacitances see Hinckley et al. [29].
All model applications in this study were carried out
under the assumption that the canopies were sufficiently
supplied with water at the Fichtelgebirge sites in 1994
and 1995. Strong decreases in stomatal conductance of
Norway spruce stands were found by Biron [9] when
large negative soil matrix potentials (–0.7 to –0.8 MPa)
occurred at 105 cm depth and soil water storage in the
profile was low (< 150 mm in the first 90 cm). Soil
matrix potentials at 35 cm depth at “40LB” decreased
after periods without rain in 1994 to values as low as
–0.6 MPa and in 1995 at 20 cm depth as low as –0.3
MPa. At “140”, soil matrix potentials more negative than
–0.8 MPa occurred occasionally at 20 cm depth during
1994, but potentials at 90 cm depth decreased only to
approximately –0.45 MPa. In 1995, soil matrix potential
at 20 cm depth decreased only to –0.6 MPa, and at 90 cm
depth was never more negative than –0.1 MPa. An
examination of the deviations between modeled and
measured daily canopy transpiration showed no correla-
tion with measured soil water potentials at 35 cm depth
Figure 8. Monthly sums of modelled canopy carbon gain based
on square meter ground area for six Norway spruce stands in
the Lehstenbach catchment from May to September 1994, and
April to September 1995. Carbon gain is obtained with the
exclusion of aboveground woody respiration as described in
the methods.
Modelling of Picea abies
239
at “140” and “40LB”. As soil water availablility decreas-
es, water potential in stem, branches and leaves as part of
the potential gradient from soil to the atmosphere is
expected to drop. In a recent publication, Bauerle et al.
[6] emphasize the utility of the cohesion theory in inter-
pretation of water potential gradients in trees. More gen-
erally, predawn water potential of leaves or needled
branch ends serve as an integrated measure for the water
status of the plant. Decreases in stomatal conductance of
Norway spruce branches have been reported along with
decreases in predawn water potential of branch ends to
–0.7 to –0.8 MPa [25, 40]. At our study sites in the
Fichtelgebirge, predawn water potential more negative
than –0.5 MPa was never recorded during 1994 and 1995
[1]. Thus, we conclude that the deviations between
model and measured estimates of transpiration were not
influenced by water stress phenomena.
Although a single leaf physiology was assumed in the
modelling and the results demonstrated a primary role
for changing tree structure in determining canopy gas
exchange, decreases in needle gas exchange in the
Fichtelgebirge are well documented in response to nee-
dle aging and the turnover of magnesium [39]. Older
needles can show a reduction of photosynthesis and con-
ductance of up to 50%. The shade needle parameteriza-
tion derived for 0-2 year-old needles applied in the
current study could mean that gas exchange rates in the
older stands is overestimated as leaf area accumulates in
older needle classes. Approximately 25% of the needles
at “140” are older than four years, while four-year-old
needles were seldom found at “40LB”. Alternatively,
occurrence of sun or high-light adapted needles in the
exposed outer crown could lead to compensating effects
[38] and a good average prediction of tree gas exchange.
The current study which helps clarify heterogeneity
for Norway spruce forest in the water flux contribution
from the tree canopy compartment with sap flow meth-
ods must be complemented by direct measurements of
evapotranspiration from the soil surface and understory.
The soil surface flux varies strongly with age due to dif-
ferences in stand density and radiation penetration
through the stand to the ground. The view obtained of
compensatory water loss from these compartments can
aid in deciding whether to consider the total flux of
water to the atmosphere from forest stands as a conserva-
tive process sensu Roberts [53]. Alternatively, shifts in
activity from the tree canopy layer to the ground surface
and understory could mean that total fluxes also change
due to altered characteristics in their regulation by the
organisms present.
Changes in total fluxes with alterations in stand struc-
ture seem even more likely for total CO
2
flux than for
evapotranspiration. Carbon dioxide exchange primarily
regulated by spruce needle physiology in young spruce
stands with a closed canopy will decrease with stand
aging, while CO
2
exchange by grasses invading gaps
will increase, as will the activity of microorganisms in
response to altered soil environment (warmer but possi-
bly drying in a different time dependent manner). The
CO
2
exchange of clear-cut areas and mature closed
forests provides estimates of the extremes that occur for
measured fluxes, it is important to increase our under-
standing of flux variation that occurs in intermediate
stages and with intermediate forest structures, as shown
for instance by Buchmann et al. [13]. Based on measure-
ments of needle gas exchange [17] and gas exchange of
branches without needles and trunks [42], we have
obtained a view on changing activity in carbon gain of
the tree canopy compartment with stand age for Norway
spruce as well as for water use. It should be possible to
verify these changes with a skillful application of eddy
covariance techniques above and below the canopy, such
that the difference is directly comparable to the output of
STANDFLUX. This must be complemented with sys-
tematic investigations of CO
2
exchange by the understo-
ry plants and soil compartment of the spruce forest
ecosystem.
Spruce forest density is a critical factor determining
forest/atmosphere exchange, but it is also a characteristic
easily determined by remote sensing. Furthermore, man-
aged spruce forest is a landscape element with wide dis-
tribution within Europe. Thus, the results from our study,
appropriately coupled to below canopy fluxes, may be
generalized over larger areas, e.g., in determining water
use of forested catchments. For such applications, we
must still determine the potential effect of additional fac-
tors such as soil water availability or variation in leaf
physiological parameters in response to gradients in tem-
perature, N-deposition, etc.
Importantly, it should be recognized that STAND-
FLUX is too costly in parameterization and computation
time to be used directly for landscape and regional
applications. Direct spatial application of the three-
dimensional model is necessary to achieve better under-
standing of fluxes from different sources in the vicinity
of a tower for eddy covariance measurements, but land-
scape level estimates of gas exchange will be better
achieved through use of homogeneous-layered models
describing vegetation light interception, canopy micro-
climate, and canopy gas exchange that have been in use
for several decades [e.g., 45, 43, 46, 54, 59, 66]. The
question that must be answered is how to correctly para-
meterize such models for the complex structural situa-
tion found in forest stands. We might expect the answer
to this question to be provided by combining information
from direct eddy covariance measurements which
E. Falge et al.
240
provide the ultimate calibration and test data sets and
from analyses and principles determined from models
such as STANDFLUX. By comparing the output of dif-
ferent types of models to measured flux data, “equivalent
descriptions” may be achieved [65] and the simpler lay-
ered models can then be used in designing strategies for
generalizing biological information for landscapes and
regions.
Acknowledgements: Financial support was provided
from the Bavarian Climate Research Programme
(BayFORKLIM), the Bundesministerium für Bildung,
Wissenschaft, Forschung und Technologie, Germany
(BEO 51-0339476A), and the EUROFLUX project
(ENV4-CT95-0078). We thank Dr. Uelo Niinemets for
helpful comments on an earlier version of the manu-
script.
Appendix 1
The branch gas exchange model PSN6
The model PSN6 is based on the enzyme kinetics of
ribulose-1,5-bisphosphate carboxylase-oxygenase
(RubisCO) describing net photosynthesis as a function of
internal CO
2
partial pressure [20, 21] and includes the
Ball et al. [5] empirical model of stomatal conductance.
Model parameterization is described in detail in Harley
and Tenhunen [28]. In the current study, an analytical
solution for leaf net photosynthesis, for stomatal conduc-
tance, and for leaf internal and leaf surface CO
2
concen-
tration was used (Baldocchi 1994). Four basic equations
were combined in a cubic equation for net photosynthe-
sis (np, in µmol m
-2
s
-2
) which is solved according to the
scheme of Bronstein and Semendjajew [11].
At low CO
2
pressure and light saturation, CO
2
fixa-
tion is limited by the potential rate of fixation by
RubisCO (w
c
), and at high CO
2
pressure, by the potential
rate of electron transport or the regeneration of ribulose-
1,5-bisphospate (RuBP) (w
j
). Thus net photosynthesis
(np) may be expressed as
(A.1)
where 0.5
.
r
d
is the dark respiration assumed to continue
in the light (mmol m-2 s-1), c
i
is leaf internal CO
2
partial
pressure and Γ* the CO
2
compensation point in the
absence of r
d
. Following Baldocchi [2], equation (A.1) is
solved for c
i
:
(A.2)
If w
c
<
w
j
, the coefficients a, b, d, and e are replaced by
Vc
max
(the maximum carboxylation volocity for the actu-
al temperature), K
c
(1 + O
2
/Ko) (considering oxygen
concentration, and Michaelis-Menten constants for car-
boxylation and oxygenation), Γ*, and 1, respectively. If
w
c
> w
j
, the coefficients a, b, d, and e correspond to 4 P
m
(the maximum electron transport rate at actual light and
temperature), 8 Γ*, Γ*, and 4.
Additional equations are needed to calculate leaf sur-
face CO
2
concentration c
s
, and leaf-internal CO
2
concen-
tration c
i
assuming molecular diffusion in the boundary
layer:
(A.3)
(A.4)
where c
a
is the CO
2
concentration of the air. The factor
1000 derives from balancing the differing units used for
np and the boundary layer conductance, g
a
, calculated as
described below, or the stomatal conductance, g
s
, both in
mmol m
-2
s
-1
. The factor 1.6 is the ratio of the diffusivi-
ties of water vapor and CO
2
in air [19].
Laminar flow in the boundary layer, which would
reduce the factor 1.6 in equation (A.3) to 1.3, was
neglected.
Stomatal conductance is calculated as:
(A.5)
where g
min
is the minimum conductance, h
s
is relative
humidity (as a decimal fraction), and g
fac
is an empirical-
ly determined constant. The factor 1000 adjusts for the
different units of g
s
and (np+0.5 r
d
).
For coniferous needles the calculation of g
a
according
to Nobel [44] was modified using so-called σ-factors of
Jarvis et al. [31], for definition and measurements see
Appendix 2). First, the thickness of the boundary layer
(dbl) is determined after Nobel [44], his equation (7):
(A.6)
with
w the width of leaf (in m), and u the wind speed on
the leaf surface (in m s
-1
). The temperature dependence
(temperature in °C) of dwv, the coefficient of diffusivity
dbl
=0.004
•
w
u
g
s
=
g
min
+
g
fac
•
1000
• np
+0.5
• r
d
• h
s
c
s
c
i
=
c
s
–
1.6
• np •
1000
g
s
c
s
=
c
a
–
1.6
• np •
1000
g
a
c
i
=
a • d
+
b • np
+0.5
• r
d
a
–
e • np
+0.5
• r
d
.
np
=1–
Γ *
c
i
•
min
w
c
,
w
j
–0.5
• r
d
Modelling of Picea abies
241
for water vapor (in m
2
s
-1
), is calculated according to
Nobel [44], his Appendix 2:
(A.7)
Calculation of the boundary layer conductance, g
a
in
mmol m
-2
s
-1
, (numerator as in Nobel [44], his Eqs. (8.3)
and (8.8) denominator according to Jarvis et al. [31])
with consideration of the clumping of the needles on the
branch gives:
(A.8)
with
P pressure of the air (in Pa), T
k
leaf temperature (in
K) and R the gas constant (8.31 J K
-1
mol
-1
).
Appendix 2
The definition and determination of
σ-factors
The σ-factors were used to estimate leaf boundary
layer conductance (Eq. A.8), as well as to convert LAD
(leaf area per volume crown section) for individual nee-
dles to the density for projected areas of intact twigs,
e.g., the effective leaf area for light interception:
(A.9)
where A
n
is the projected area of all needles laid out sep-
arately, A
t
is the projected area of the twig, and A
s
the
projected area of the intact twig. Measurements of A
s
, A
t
and A
n
were obtained with a Delta-T Image Analysis
System (Delta-T Devices LTD, Cambridge, England).
For the determination of the σ-factors for each meter
section of the harvested tree, three 2nd or 3rd order twigs
were randomly selected. The σ-factors reflect the mor-
phological light acclimation, and decrease with depth in
the canopy (data not shown).
REFERENCES
[1] Alsheimer M., Köstner B., Falge E.M., Tenhunen J.D.,
Temporal and spatial variation in transpiration of Norway
spruce stands within a forested catchment of the
Fichtelgebirge, Germany, Ann. Sci. For. 55 (1998) 103-123.
[2] Baldocchi D.D., An analytical solution for coupled leaf
photosynthesis and stomatal conductance models, Tree Physiol.
14 (1994) 1069-1079.
[3] Baldocchi D.D., Flux footprints within and over forest
canopies, Boundary Layer Meteorol. 85 (1997) 273-292.
[4] Baldocchi D.D., Valentini R., Running S., Oechel W.,
Dahlman R., Strategies for measuring and modelling carbon
dioxide and water vapour fluxes over terrestrial ecosystems,
Global Change Biol. 3 (1996) 159-168.
[5] Ball J.T., Woodrow I.E., Berry J.A., A model predicting
stomatal conductance and its contribution to the control of pho-
tosynthesis under different environmental conditions, in:
Binggins I.J. (Ed.), Progress in photosynthesis research,
Vol. IV.5, Martinus Nijhoff, Dordrecht, Netherlands, 1987, pp.
221-224.
[6] Bauerle W.L., Hinckley T.M., Cermák J., Kucera J.,
Bible K., The canopy water relations of old-growth Douglas-fir
trees, Trees 13 (1999) 211-217.
[7] Bell A.D., Dynamic morphology: a contribution to plant
population ecology, in: Dirzo R., Sarukhan J. (Eds.),
Perspectives on Plant Population Ecology, Sunderland, Mass:
Sinauer, 1984, pp. 48-65.
[8] Beyschlag W., Ryel R.J., Dietsch C., Shedding of older
needle age classes does not necessarily reduce photosynthetic
primary production of Norway Spruce. Analysis with a 3-
dimensional canopy photosynthesis model, Trees 9 (1995) 51-
59.
[9] Biron P., Le cycle de l’eau en forêt de moyenne mon-
tagne: Flux de sève et bilans hydriques stationnels (Bassin ver-
sant du Strengbach à Aubure-Hautes Vosges), Ph.D. Thesis,
Louis Pasteur Université, Strasbourg, France, 1994.
[10] Björkman O., Comparative studies on photosynthesis
in higher plants, Ann. Rev. Plant Physiol. 31 (1973) 491-543.
[11] Bronstein I.N., Semendjajew K.A., Taschenbuch der
Mathematik, 21./22. Aufl., Harri Deutsch, Thun und
Frankfurt/Main, Germany, 1987.
[12] Brooks J.R., Hinckley T.M., Ford E.D., Sprugel D.G.,
Foliage dark respiration in
Abies amabilis (Dougl.) Forbes:
variation within the canopy, Tree Physiol. 9 (1991) 325-338.
[13] Buchmann N., Hinckley T.M., Ehleringer J.R., Carbon
isotope dynamics in
Abies amabilis stands in the Cascades,
Can. J. For. Res. 28 (1998) 808-819.
[14] Cermák J., Deml M., Penka M., A new method of
sapflow determination in trees, Biol. Plant. (Praha) 15 (1973)
171-178.
[15] Cermák J., Kucera J., Penka, M., Improvement of the
method of sapflow determination in full-grown trees based on
heat balance with direct electric heating of xylem, Biol. Plant.
(Praha) 18 (1976) 105-110.
[16] Cienciala E., Kucera J., Ryan M.G., Lindroth A., Water
flux in boreal forest during two hydrologically contrasting
years; species specific regulation of canopy conductance and
transpiration, Ann. Sci. For. 55 (1998) 47-61.
[17] Falge E.M., Graber W., Siegwolf R., Tenhunen J.D., A
model of the gas exchange response of
Picea abies to habitat
conditions, Trees 10 (1996) 277-287.
[18] Falge E.M., Ryel R.J., Alsheimer M., Tenhunen J.D.,
Effects of stand structure and physiology on forest gas
σ
=
A
n
+
A
t
A
s
g
a
=
dwv
dbl
•
1000
•
P
R • T
k
1.67
•σ
0.43
dwv
=2.126
•
10
–5
+1.48
•
10
–7
• T
c
.
E. Falge et al.
242
exchange: A simulation study for Norway spruce, Trees 11
(1997) 436-448.
[19] Farquhar G.D., Sharkey, T.D., Stomatal conductance
and photosynthesis, Ann. Rev. Plant Physiol. 33 (1982) 317-
342.
[20] Farquhar G.D., Von Caemmerer S., Modelling of pho-
tosynthetic response to environment, in: Lange O.L., Nobel
P.S., Osmond C.B., Ziegler H. (Eds.), Encyclopedia of Plant
Physiology, Vol. 12B, Physiological Plant Ecology II, Water
Relations and Carbon Assimilation. Springer-Verlag, Berlin,
1982, pp. 549-587.
[21] Farquhar G.D., Von Caemmerer S., Berry, J.A., A bio-
chemical model of photosynthetic CO
2
assimilation in leaves of
C
3
species, Planta 149 (1980) 78-90.
[22] Goulden M.L., Munger J.W., Fan S M., Daube B.C.,
Wofsy S.C., Measurements of carbon sequestration by long-
term eddy covariance: methods and a critical evaluation of
accuracy, Global Change Biol. 3 (1996) 169-182.
[23] Granier A., Une nouvelle méthode pour la mesure du
flux de sève brute dans le tronc des arbres, Ann. Sci. For. 42
(1985) 81-88.
[24] Granier A., Evaluation of transpiration in a Douglas-fir
stand by means of sapflow measurements, Tree Physiol. 3
(1987) 309-320.
[25] Gross K., Pham-Nguyen T., Einfluß von langfristigem
konstanten Wassermangelstreß auf die Nettophotosynthese und
das Wachstum junger Fichten (
Picea abies [L.] Karst.) und
Douglasien (
Pseudotsuga menziesii [Mirb.] Franco) im
Freiland. Forstwiss. Cbl. 106 (1987) 7-26.
[26] Habermehl A., Hüttermann A., Lovas G., Ridder H
W., Computer Tomographie von Bäumen,
Biologie in unserer
Zeit
4 (1990) 193-200.
[27] Habermehl A., Ridder H W., Anwendungen der
mobilen Computer-Tomographie zur zerstörungsfreien
Untersuchung des Holzkörpers von stehenden Bäumen, Holz
Roh- Werkstoff 51 (1993) 1-6.
[28] Harley P.C., Tenhunen J.D., Modeling the photosyn-
thetic response of C
3
leaves to environmental factors, in: Boote
K.J., Loomis R.S. (Eds.) Modeling Crop Photosynthesis - from
Biochemistry to Canopy, ASA, Madison, Wisconsin, 1991,
pp. 17-39.
[29] Hinckley T.M., Sprugel D.G., Brooks J.R., Brown K.J.,
Martin T.A., Roberts D.A., Schaap W., Wang D., Scaling and
integration in trees, in: Peterson D.L., Parker V.T. (Eds.),
Ecological scale: theory and applications, Columbia University
Press, New York, 1998, pp. 309-337.
[30] Hubbard R.M., Bond B.J., Ryan M., Evidence that
hydraulic conductance limits photosynthesis in old
Pinus pon-
derosa
trees, Tree Physiol. 19 (1999) 165-172.
[31] Jarvis P.G., James G.B., Landsberg J.J., Coniferous
forest. in: Monteith J.L. (Ed.), Vegetation and Atmosphere,
Vol. 2, Case studies, Academic Press, London, 1976, pp. 171-
240.
[32] Joss U., Graber W., Profiles and simulated exchange of
H
2
O, O
3
, NO
2
between the atmosphere and the HartX Scots
pine plantation, Theor. App. Clim. 53 (1996) 157-172.
[33] Kelliher F.M., Leuning R., Schulze E D., Evaporation
and canopy characteristics of coniferous forests and grasslands,
Oecologia 95 (1993) 153-163.
[34] Köstner B., Schulze E D., Kelliher F.M., Hollinger
D.Y., Byers J.N., Hunt J.E., McSeveny T.M., Mesert R., Weir
P.L., Transpiration and canopy conductance in a pristine broad-
leaved forest of Nothofagus: an analysis of xylem sap flow and
eddy correlation measurements, Oecologia 91 (1992) 350-359.
[35] Köstner B., Biron P., Siegwolf R., Granier A.,
Estimates of water vapor flux and canopy conductance of Scots
pine at the tree level utilizing different sap flow methods,
Theor. Appl. Clim. 53 (1996) 105-114.
[36] Köstner B., Alsheimer M., Falge E.M., Geyer R.,
Tenhunen J.D., Relationships between canopy transpiration,
conductance, and tree capacitance of an old Norway spruce
(
Picea abies) stand, Ann. Sci. For. 55 (1998) 125-139.
[37] Kucera J., Cermák J., Penka M., Improved thermal
method of continual recording the transpiration flow rate
dynamics, Biol. Plant. (Praha) 19 (1977) 413-420.
[38] Kull O., Koppel A., Net photosynthetic response to
light intensity of shoots from different crown positions and age
in
Picea abies [L.] Karst., Scand. J. For. Res. 2 (1987) 157-
166.
[39] Lange O.L., Weikert R.M., Wedler M., Gebel J., Heber
U., Photosynthese und Nährstoffversorgung von Fichten aus
einem Waldschadensgebiet auf basenarmeme Untergrund,
Allg. Forst Zeitschr. 3 (1989) 55-64.
[40] Lu P., Biron P., Bréda N., Granier A., Water relations
of adult Norway spruce (
Picea abies [L.] Karst.) under soil
drought in the Vosges mountains: water potential, stomatal
conductance and transpiration, Ann. Sci. For. 52 (1995) 117-
129.
[41] Martin T.A., Brown K.J., Cermák J., Ceulemans R.,
Kucera J., Meinzer F.C., Rambold J.S., Sprugel D.G., Hinckley
T.M., Crown conductance and tree and stand transpiration in a
second-growth
Abies amabilis forest, Can. J. For. Res. 27
(1997) 797-808.
[42] Mirschkorsch C., Die Stamm- und Zweigrespiration
eines jungen Fichtenbestandes (
Picea abies [L.] Karst.) und die
Bedeutung für den CO
2
-Netto-Austausch, Diploma thesis,
University of Bayreuth, Bayreuth, Germany, 1996.
[43] Monteith J.L., Vegetation and the Atmosphere, Vol. 2,
Academic Press, New York, 1976.
[44] Nobel P.S., Biophysical Plant Physiology and Ecology,
W.H. Freeman and Company, San Francisco, 1983.
[45] Norman J.M., Radiation transfer in vegetation, in: de
Vries D.A., Afgan N.H. (Eds.), Heat and Mass Transfer in the
Biosphere, Scripta Book Co, Washington DC, 1975.
[46] Norman J.M., Interfacing leaf and canopy light inter-
ception models, in: Hesketh J.D., Jones J.W. (Eds.), Predicting
Photosynthesis for Ecosystem Models, CRC Press Inc, Boca
Raton, Florida, 1980.
[47] Öquist G., Brunes L., Hällgren J E., Gezelius K.,
Hallén M., Malmberg G., Effects of artificial frost hardening
and winter stress on net photosynthesis, photosynthetic electron
Modelling of Picea abies
243
transport and RuBP carboxylase activity in seedlings of Pinus
sylvestris
, Physiol. Plant. 48 (1980) 526-531.
[48] Oren R., Phillips N., Ewers B.E., Pataki D.E.,
Megonigal J.P., Sap-flux-scaled transpiration responses to
light, vapor pressure deficit, and leaf area reduction in a flood-
ed
Taxodium distichum forest, Tree Physiol. 19 (1997) 337-
347.
[49] Pereira J.S., Tenhunen J.D., Lange O.L., Beyschlag W.,
Meyer A., David M.M., Seasonal and diurnal patterns in leaf
gas exchange of
Eucalyptus globulus trees growing in Portugal,
Can. J. For. Res. 16 (1985) 177-184.
[50] Phillips N., Nagchaudhuri A., Oren R., Katul G., Time
constant for water transport in loblolly pine trees estimated
from time series of evaporative demand and stem sapflow,
Trees 11 (1997) 412-419.
[51] Pollard D.F.W., Logan K.T., The effect of light intensi-
ty, photoperiod, soil moisture potential, and temperature on
bud morphogenesis in Picea species, Can. J. For. Res. 7 (1977)
415-421.
[52] Pretzsch H., Growth trends of forests in Germany, in:
Spiecker H., Mielokäinen K., Köhl M., Skovsgaard J.P. (Eds.),
Growth trends in European forests, Springer Verlag,
Heidelberg, 1996, pp. 107-131.
[53] Roberts J., Forest transpiration: a conservative hydro-
logical process?, J. Hydrol. 66 (1983) 133-141.
[54] Ross J., Radiative transfer in plant communities, in:
Monteith J.L. (Ed.), Vegetation and the Atmosphere, Vol. 1,
Academic Press, New York, 1975.
[55] Ryan M.G., Yoder B.J., Hydraulic limits to tree height
and tree growth, BioScience 47 (1997) 235-242.
[56] Ryan M.G., Binkley D., Fownes J.H., Age-related
decline in forest productivity: pattern and process, Advances in
Ecological Research 27 (1997) 213-262.
[57] Ryel R.J., Light relations in tussock grasses as assessed
with a new three-dimensional canopy photosynthesis model.
Structure and function of foliage organization of a growth form
prevalent in environments characterized by stress, Ph.D.
Thesis, University of Würzburg, Würzburg, Germany, 1993.
[58] Ryel R.J., Beyschlag W., Caldwell M.M., 1993,
Foliage orientation and carbon gain in two tussock grasses as
assessed with a new whole-plant gas exchange model, Func.
Ecol. 7 (1993) 115-124.
[59] Sala A., Tenhunen J.D., Simulations of canopy net
photosynthesis and transpiration in
Quercus ilex L. under the
influence of seasonal drought, Agric. For. Meteorol. 78 (1996)
203-222.
[60] Schäfer K.V.R., Oren R., Tenhunen J.D., The effect of
tree height on sap flux-scaled canopy stomatal conductance in
Fagus sylvatica L. Submitted to Plant, Cell and Environ. 1999.
[61] Schmid H.P., Source areas for scalars and scalar fluxes,
Boundary Layer Meteorol. 67 (1994) 293-318.
[62] Schulze E D., Cermák J., Matyssek R., Penka M.,
Zimmermann R., Vasicek F., Gries W., Kucera J., Canopy
transpiration and water fluxes in the xylem of the trunk of
Larix and Picea trees - comparison of xylem flow, porometer
and cuvette measurements, Oecologia 66 (1985) 475-483.
[63] Schulze E D., Lange O.L., Oren R., Forest decline and
air pollution. A study of spruce (
Picea abies) on acid soils.
Ecological Studies Vol. 77, Springer Verlag, Berlin Heidelberg
New York, 1989, pp. 475.
[64] Tenhunen J.D., Valentini R., Köstner B., Zimmermann
R., Granier A., Variation in forest gas exchange at landscape to
continental scales, Ann. Sci. For. 55 (1998) 1-11.
[65] Tenhunen J.D., Ryel R.J., Joss U., Falge E., Geyer R.,
Penumbral and foliage distribution effects on
Pinus sylvestris
canopy water use and gross primary production, Theor. Appl.
Climatol. 1999, in press.
[66] Williams M., Rastetter E.B., Fernandes D.N., Goulden
M.L., Wofsy S.C., Shaver G.R., Melillo J.M., Munger J.W.,
Fan S M., Nadelhoffer K.J., Modelling the soil-plant-atmos-
phere continuum in a
Quercus-Acer stand at Harvard Forest:
the regulation of stomatal conductance by light, nitrogen and
soil/plant hydraulic properties, Plant Cell Environ. 19 (1996)
911-927.
[67] Yoder B.J., Ryan M.G., Waring R.H., Schoettle A.W.,
Kaufmann M.R., Evidence of reduced photosynthetic rates in
old trees, For. Sci. 40 (1994) 513-527.