Báo cáo khoa học: "Performance of young jack pine trees originating from two different branch angle traits under different intensities of competition" ppt
Bạn đang xem bản rút gọn của tài liệu. Xem và tải ngay bản đầy đủ của tài liệu tại đây (168.7 KB, 15 trang )
Original article
Performance of young jack pine trees originating
from two different branch angle traits
under different intensities of competition
Guy R. Larocque
*
Natural Resources Canada, Canadian Forest Service, Laurentian Forestry Centre, 1055 du P.E.P.S.,
P.O. Box 3800, Sainte-Foy, Quebec, Canada G1V4C7
(Received 16 June 1999; accepted 5 June 2000)
Abstract – The performance of young jack pine (Pinus banksiana Lamb.) trees, originating from seed orchard trees of two different
branch angle traits, was examined under different intensities of competition with morphological measures of crown development and
growth efficiency measures. Seedlings were planted under a split-plot design at five initial spacings – 0.5 m, 0.75 m, 1.0 m, 1.5 m
and 2.0 m –, three blocks, two branching characteristics and four replicates. Relative growth rate for diameter at breast height (dbh)
increased by nearly twofold from the closest to the largest spacing. Crown width, crown ratio, needle density ratio and leaf weight
ratio decreased significantly with decrease in spacing, which indicated that the efficiency of jack pine crowns to occupy their grow-
ing space and the proportion of photosynthesizing biomass relative to respiring biomass were negatively affected by competition.
Needle nitrogen concentration decreased with decrease in spacing and was significantly related to leaf weight ratio. Variation with
tree size in the ratios of dbh increment to needle biomass and to needle nitrogen content indicated that small trees produced stem-
wood per unit of photosynthetic tissue and per unit of nitrogen more efficiently than large trees in the absence of severe competition
and that this trend was gradually reversed as the intensity of competition increased. Branch angle trait did not constitute a significant
advantage for crown development and stem growth.
competition / growth efficiency measures / branch angle / nitrogen
Résumé
– Performance de jeunes pins gris issus de deux caractères différents d'angle des branches sous différentes intensités
de compétition.
Le développement de jeunes pins gris (Pinus banksiana Lamb.), issus d’arbres parents localisés dans un verger à
graines et différenciés par deux caractères d’angle des branches, a été analysé sous différentes intensités de compétition avec des
mesures morphologiques de développement des cimes et d’efficacité de croissance. Les semis ont été plantés selon un dispositif en
parcelles divises à cinq niveaux d’espacement (0,5 m, 0,75 m, 1,0 m, 1,5 m et 2,0 m), deux classes d’angle des branches, trois blocs
et quatre répétitions. Le taux relatif de croissance en diamètre à hauteur de poitrine (dhp) a presque doublé de l’espacement le plus
serré à l’espacement le plus large. La largeur de la cime, le rapport cime-hauteur et les rapports de densité et de masse des aiguilles
ont diminué de façon significative avec une diminution de l’espacement initial. Ces résultats indiquent que l’efficacité des couronnes
du pin gris à occuper leur espace de croissance et la proportion de tissu assurant la photosynthèse par rapport à la proportion de tissu
qui respire a été affectée négativement par la compétition. La concentration en azote des aiguilles, qui a diminué avec une réduction
de l’espacement, a été reliée de façon significative au rapport de masse des aiguilles. La variation, en fonction de la taille des arbres,
des rapports de croissance en diamètre sur la biomasse foliaire et le contenu en azote des aiguilles indique que, en l’absence de com-
pétition sévère, les petits arbres ont produit plus efficacement de la matière ligneuse par unité de tissu photosynthétique et d’azote
que les gros arbres et que cette tendance s’est inversée à mesure que l’espacement diminuait. L’angle de branchaison des arbres ne
s’est pas révélé présenter un avantage significatif pour le développement des cimes et la croissance des tiges.
compétition / mesures d'efficacité de croissance / angle des branches / azote
Ann. For. Sci. 57 (2000) 635–649 635
© INRA, EDP Sciences
*Correspondence and reprints
Tel. 418 648 5791; Fax. 418 648 5849; e-mail:
G.R. Larocque
636
1. INTRODUCTION
Jack pine (Pinus banksiana Lamb.) is harvested quite
intensively in the boreal forest mainly for the production
of pulp and paper. This probably explains why much
effort has been devoted to study the productivity of
seedlings and mature trees. For instance, several studies
examined the effect of interspecific competition caused
by shrubs and small lignified species on the growth of
seedlings that were regenerated artificially or naturally
following clearcutting or fire [e.g., 5, 32, 37, 40, 43, 61].
Other studies compared volume production under differ-
ent initial stand densities and site qualities and analyzed
the effect of thinning or fertilization treatments [e.g., 3,
20, 30, 34, 46, 52, 54]. Compared with other conifer
species that compose the boreal forest such as white
spruce (Picea glauca [Moench] Voss) or black spruce
(Picea mariana [Mill.] B.S.P.), jack pine has been found
to be very sensitive to competitive stress [3, 5, 33, 39,
40].
Much information still needs to be acquired on the
effect of competition at young ages for jack pine. In par-
ticular, there is a lack of information on the amplitude of
competition in young stands that are tall enough to avoid
above-ground competition from shrubs and small ligni-
fied species, but before self-thinning becomes too
severe. Experimental designs to study systematically
changes in growth, crown development and nutritional
status under a relatively wide range of initial densities
have seldom been used to analyze the development of
young jack pine trees.
Jack pine is characterized by a high degree of plastic-
ity [15]. Significant differences in growth patterns are
related to crown characteristics [2, 41]. In particular,
branch angle is characterized by a relatively high degree
of heritability and is closely related to wood quality [1,
35]. Differences in productivity can be expected among
provenances characterized by different branch angles
because this heritability trait influences the response of
trees to light competition or stocking [8, 9]. Despite the
fact that some studies suggested weak correlations
between branch angle and height growth traits for differ-
ent jack pine provenances [e.g., 1, 2, 35], they have not
determined if branch angle inheritance constitutes a sig-
nificant advantage for crown development and stem
growth as crowns interact under different intensities of
competition.
The objective of the present study was to evaluate the
sensitivity of young jack pine trees, which originated
from two branch angle traits, to various intensities of
intraspecific competition. Thus, it was possible to esti-
mate if branch angle trait resulted in a significant advan-
tage for wood production. The extent to which crowns
and foliage responded in terms of space occupancy and
efficiency to occupy growing space was examined.
2. MATERIALS AND METHODS
2.1. Study site
The study took place at the research forest of the
Petawawa National Forestry Institute (lat. 46°0' N; long.
77°26' W) on a site with a gentle slope that was clearcut
in the winter of 1982–1983. Soil samples collected
around the study site indicated that the material was
homogeneous and consisted mostly of very coarse sand.
A glyphosphate herbicide (Roundup) was applied in
1984 and 1985 to control the establishment of shrubs and
woody non-commercial species. As the presence of
shrubs and woody non-commercial species never
became a problem in subsequent years, no further exten-
sive control treatment was applied.
Seeds were collected in 1985 on jack pine trees locat-
ed at the Spoor Lake seed production site of the Ontario
Ministry of Natural Resources in the northeastern section
of Algonquin Park. To be used for seed sources for the
present study, trees had to be clear of any sign of insect
or disease damage and the form of their stem had to be
straight. Following this first selection, trees were classi-
fied into two major groups: (1) acute branch angle trees
with branch angles between 25° and 30° and wide
branch angle trees with branch angles between 60° and
70°. Seeds were extracted for 16 h at 57°C dry bulb and
35–38°C wet bulb. Prior to storage, their moisture con-
tent was reduced to 5–8% in a conditioner at 24°C dry
bulb and 17°C wet bulb for 16 h. Then, they were sown
in Hillson’s Spencer-Lemaire containers with a mixture
of peat and vermiculite (3:1) in a greenhouse. After ger-
mination, seedlings were grown in the greenhouse for 2
months.
Seedlings were planted early in the 1986 growing sea-
son. The experimental design consisted of a split-plot
design with three blocks, five spacings – 0.5 × 0.5 m,
0.75 × 0.75 m, 1.0 × 1.0 m, 1.5 × 1.5 m and 2.0 × 2.0 m–,
two branching characteristics – acute and wide branch
angles –, and four replicates. Each experimental unit
contained a sample plot with 25 trees surrounded by
three rows acting as a buffer zone. In 1990, branch angle,
which was defined as the angle between the trunk verti-
cal line and the lower part of the branch at the insertion
point of the branch, was measured on one branch select-
ed at random on the 1989 whorl of 1282 trees located
within two replicates of each combination of two blocks,
five spacings and two branching characteristics. Every
tree within all the sample plots was measured in diame-
ter at breast height (dbh) and height in the fall of 1990
and 1991.
Performance of young jack pine under competition
637
2.2. Data collection and analyses
An experimental unit within each block, spacing and
branch type was selected in 1990 and 1991 for destruc-
tive measurements. Within each sample plot selected,
three trees were selected by stratified random sampling
based on tree size distribution for detailed measure-
ments: dbh, total height, and crown length and width
(mean of two perpendicular measures). Then, trees were
cut at the root collar level, branches were separated from
the stems, and stems were cut off in small pieces for lab-
oratory analyses. The first step consisted in determining
the biomass of stems, branches and needles. Because of
the large amounts of material collected, a sub-sampling
procedure was adopted. First, the fresh mass of the entire
stem and of all the branches was determined. Then,
pieces from different sections of the stem and branches
from different sections of the crown representing about
20% of the tree were collected and needles were extract-
ed from branches. These samples were weighed and
oven-dried at 70°C until no change in mass was detect-
ed, which took between 2 and 3 days. The ratios of dry
to fresh mass for both the stems and branches and of
needles to branches that were determined for each tree
were multiplied by the total fresh mass to derive the total
dry mass.
The biomass samples that were dried were also used
for nutrient analyses at the individual tree level. For each
tree, the stem, branches and needles were ground sepa-
rately and thoroughly mixed, and subsamples were taken
for chemical analyses. Nitrogen content was determined
by the Kjeldahl procedure following the methodology
described by Kalra and Maynard [21].
2.3. Growth analyses
Morphological measures of crown development and
measures of performance or efficiency as described by
Brand [5], Hunt [18, 19] and Margolis and Brand [36]
were derived from the growth, crown and nutrient data
obtained during the two successive measurements and
harvests (table I). Morphological measures of crown
development were derived from absolute measures to
evaluate the ability of crowns to occupy their growing
space. Crown ratio (CR), which is also considered as a
measure of vigor, is related to the photosynthetic capaci-
ty of a tree [11, 59]. Crown shape ratio (CSR), also
known as the crown fullness ratio, provides a measure of
the ability of crowns to intercept solar radiation [23, 25,
48, 63]. According to Harper [17] and Kuuluvainen and
Pukkala [26], the rate of change in this ratio is closely
related to the intensity of self-thinning. Needle density
ratio (NDR) is similar in concept to leaf area index in
that it provides a measure of leafiness [18, 19]. However,
as the objective of the present study was to highlight the
effect of competition on individual trees, this ratio was
computed to derive a leafiness index based on the hori-
zontal area occupied by individual crowns. Leaf weight
ratio (LWR) is considered as an index of “productive
investment” by Hunt [19] as it estimates the proportion
of photosynthesizing biomass relative to respiring bio-
mass.
Traditionally, tree and stand growth have been quanti-
fied by deriving measures based on cumulative growth
or the rate of change in stem dimensions. These absolute
measures indicated that the growth of stems and crowns
and the amount of foliage decreased as the intensity of
competition increased. As they are a function of tree
size, these absolute measures simply provided a means
to evaluate the importance of competition, not to draw
inferences on its effect or to determine how individual
trees respond to competition, which are critical elements
to examine [16]. For these reasons, a measure of growth
efficiency or vigor such as relative growth rate (RGR)
(table I), which is considered as a measure of the pro-
ductive capacity of a plant [12], has been suggested as an
alternative to absolute measures that could provide an
adequate evaluation of the competitive status of trees and
stands [10, 13, 14, 49].
Measures of growth efficiency based upon crown
development and nutrient uptake rate were computed
using Hunt’s [18, 19] equations for unit leaf rate (ULR)
and specific utilization rate (SUR) (table I). However, as
the measure of efficiency based on crown development
used in the present study was based on needle biomass
instead of needle area, it will be designed as foliage pro-
ductive capacity (FPC). Based upon the methodology of
Waring et al. [64, 65] and Norgren [45], allometric equa-
tions were derived to estimate needle biomass and nitro-
gen content of single trees for the computation of FPC
and SUR.
For 1990 data, the following equations were derived:
Needle biomass (g) = 240.12447
× dbh × spacing (1)
R
2
= 0.95; SE
E
= 162.559
Tree nitrogen content (mg) =
4878.4539 × dbh × spacing (2)
R
2
= 0.96; SE
E
= 3145.993
For 1991 data, the following equations were derived:
Needle biomass (g) = 35.84339 × dbh
2
× spacing (3)
R
2
= 0.95; SE
E
= 161.99862
Tree nitrogen content (mg) =
919.95434 × dbh
2
× spacing (4)
R
2
= 0.95; SE
E
= 4026.763
G.R. Larocque
638
Based on the studies by Ford [13, 14], Perry [47] and
Larocque and Marshall [27, 29], RGR, FPC and SUR
were used to evaluate the competitive status of the stands
by examining their distribution with tree size. Perry [47]
and Larocque and Marshall [27] observed three different
relationships between RGR and tree sizes in Douglas-fir
(
Pseudotsuga menziesii (Mirb.) Franco) and red pine
(Pinus resinosa Ait.) stands, respectively: absence of
severe competition when the distribution of RGR with
tree size is negative, initiation of competition-induced
mortality when the distribution of RGR with tree size is
flat, and intense competition when RGR increases with
tree size. Similar patterns were also obtained by Schmitt
et al. [55] for
Impatiens capensis and by Cannell et al.[7]
for Sitka spruce (Picea sitchensis (Bong.) Carr.) and
lodgepole pine (
Pinus contorta Dougl.). Reed et al. [50]
concluded that the decrease in height RGR with increase
in tree height in young red pine stands indicated that
competition was not occurring among trees.
In the present study, it was examined if the distribu-
tions of FPC and SUR with tree size were similar to the
distribution of RGR. Both FPC and SUR, which are sim-
ilar in concept to RGR, were expected to provide better
indication of the competitive status of stands than RGR
because they allow a more direct examination of the
ability of plants to exploit resources.
2.4. Statistical analyses
As previously mentioned, the experimental design
consisted of a split-plot design. The following ANOVA
model was computed using the GLM procedure in
SAS [53]:
y
ijkl
= µ + β
i
+ τ
j
+ ϕ
k
+ βτ
ij
+ βϕ
ik
+ τϕ
jk
+ βτϕ
ijk
+ ρ(βτ)
lij
+ e
ijkl
(5)
where y represents the dependent variable, µ the overall
mean effect, β the block effect, τ the spacing effect, ϕ
the branching characteristic effect, ρ the subplot effect
within block and spacing, and e the residual error. The
following orthogonal contrasts were defined: 4 –1 –1 –1 –1
to compare the 0.5 m spacing against the 0.75, 1.0, 1.5
and 2.0 m spacings, 0 1 –1 0 0 to compare the 0.75 m
spacing against the 1.0 m spacing, 0 1 1 –1 –1 to com-
pare the 0.75 and 1.0 m spacings against the 1.5 and
2.0m spacings, and 0 0 0 1 –1 to compare the 1.5 m
spacing against the 2.0 m spacing.
Linear regression analysis was undertaken to evaluate
the degree of dependence of the needle density ratio on
crown shape ratio and of leaf weight ratio on crown ratio
and needle nitrogen concentration.
3. RESULTS
3.1. Branch angle
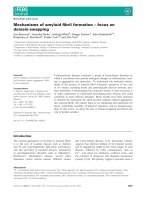
There was substantial variation in branch angles with-
in each branch angle type (figure 1). For acute branch
angle type, the majority of the trees had branch angles
between 50° and 65°. About 12% of the trees had branch
angles less than or equal to 45°. For wide branch angle
type, the majority of trees had branch angles between
50° and 70°, and about 10% of the trees had branch
angles equal to or greater than 75°. Even though the per-
centages of trees in both branch angle types overlapped
in the branch angle classes from 45° to 70°, the percent-
ages were higher for acute branch angle type in the
branch angle classes between 45° and 55° and higher for
wide branch angle type between 60° and 70°. Average
values were 55° ± 7.39 and 63° ± 8.60 for acute and
Table I. Summary of growth efficiency measures derived in
the present study. For the computation of crown shape ratio,
crown width is the average of two perpendicular measures at
the base of the crown.
W
2
and W
1
= diameter at breast height
(dbh) or stem height at ages
T
2
and T
1
; D
1
and D
2
= dbh at ages
T
2
and T
1
; F
2
and F
1
= needle biomass at ages T
2
and T
1
; N
2
and N
1
= tree nitrogen content at ages T
2
and T
1
.
Name Abbreviation Definition
Morphological measures of crown development
Crown ratio CR
Crown shape ratio CSR
Needle density ratio NDR
Leaf weight ratio LWR
Measures of growth efficiency
Relative growth rate RGR
Foliage productive capacity FPC
Specific utilization rate SUR
D
2
–D
1
T
2
–
T
1
ln
N
2
–ln
N
1
N
2
–
N
1
D
2
–D
1
T
2
–
T
1
ln
F
2
–ln
F
1
F
2
–
F
1
ln
W
2
–ln
W
1
T
2
–
T
1
Needle biomass
Totaltreebiomass
Needle biomass
Crownprojection
Crownwidth
Crownlength
Crownlength
Stemlength
wide branch angle types, respectively, and differed sig-
nificantly (P<0.01).
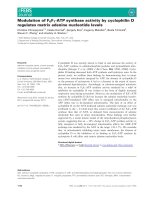
3.2. Stem growth
As far as cumulative growth in dbh and height was
concerned, branch angle type was not statistically signif-
icant in 1990 and 1991 (figure 2, table II). In 1990, aver-
age dbh did not vary significantly among the four largest
spacings. Only average dbh of the 0.5 m spacing was
significantly lower than the mean of the 0.75, 1.0 and
1.5 m spacings. More significant differences were
obtained in 1991: average dbh increased significantly
with increase in spacing up to the 1.5 m spacing irre-
spective of branch angle type. Cumulative height did not
differ significantly among spacings in both years.
Significant differences were obtained for dbh RGR
between the 0.5 m and the means of the 0.75, 1.0 and
1.5m spacings, and between the means of the 0.75 and
1.0m spacings and the means of the 1.5 and 2.0 m spac-
ings. The general trend was an increase in RGR with
increase in spacing. Even though height RGR of the
0.5 m spacing differed significantly from the average of
the 0.75, 1.0 and 1.5 m spacings, the difference was not
very pronounced compared with the differences obtained
for dbh RGR. Branch angle type was statistically signifi-
cant only for height RGR. However, when branch angle
types are compared for individual spacings, height RGR
of the wide branch angle type was only slightly greater
than that of the acute branch angle type.
3.3. Crown development
Differences among spacings were relatively more pro-
nounced for crown development parameters than for
stem development, particularly for crown width and the
needle density ratio (figure 3, table III). Significant dif-
ferences were obtained both in 1990 and 1991 for crown
width. The general trend was an increase in crown width
with increase in spacing. Both in 1990 and 1991,
not only the 0.5 m spacing differed significantly from the
mean of the 0.75, 1.0 and 1.5 m spacings, but also
the mean of the 0.75 and 1.0 m spacings differed from
the mean of the 1.5 and 2.0 m spacings. Even though the
same contrasts were significant in both years, differences
among spacings were greater in 1991 than in 1990
(figure 3). Crown overlap occurred only in 1991 within
the 0.5 m spacing. Branch angle type was not significant
for both years. For crown ratio in 1990, a significant dif-
ference was obtained only between the 0.5 m spacing
and the mean of the 0.75 m, 1.0 m and 1.5 m spacings. In
1991, significant differences were obtained among all
spacings, except between the 1.5 m and 2.0 m spacings.
Branch angle type was not significant for both years.
Significant differences were obtained in both years for
NDR (figure 3, table III). In 1990, the 0.5 m spacing was
significantly lower than the mean of the 0.75 m, 1.0 m
and 1.5 m spacings, as well as the mean of the 0.75 and
1.0 m spacings relative to the mean of the 1.5 m and
2.0 m spacings. Similarly to crown width and crown
ratio, differences among spacings accentuated the year
after such that only the 1.5 m and 2.0 m spacings did not
differ significantly. Differences among spacings for
LWR in 1990 were relatively less pronounced than those
for NDR, as only the 0.5 m spacing differed significantly
from the mean of the 0.75 m, 1.0 m and 1.5 m spacings
(figure 3, table III). In 1991, LWR decreased substantial-
ly and significant differences were obtained between the
0.5 m spacing and the mean of the 0.75m, 1.0m and
1.5m spacings and between the mean of the 0.75 m and
1.0 m spacings and the mean of the 1.5 m and 2.0 m
spacings.
The linear regression equations for NDR were highly
significant for both branch types, as 66% and 72% of the
variation in NDR were explained by the regression on
CSR, spacing and year, respectively (table IV). For both
equations, spacing made the greatest relative contribu-
tion to the regression: the greater the spacing, the greater
the NDR. The negative coefficients indicate that the den-
sity of needles decreased with increase in CSR and age.
Performance of young jack pine under competition
639
Figure 1. Proportions of trees in different acute and wide
branch angle classes, as measured within two replicates of each
combination of two blocks, five spacings and two branch angle
traits.
30 35 40 45 50 55 60 65 70 75 80 85 90 95
0
5
10
15
20
25
30
35
40
(%)
Branch angle class (deg.)
Acute branch angle type
Wide branch angle type
G.R. Larocque
640
1990 1991 1990 1991
0.0
0.5
1.0
1.5
2.0
2.5
3.0
3.5
4.0
Dbh (cm)
1990 1991 1990 1991
0.0
0.5
1.0
1.5
2.0
2.5
3.0
3.5
4.0
Height (m)
Acute Wide
0.00
0.05
0.10
0.15
0.20
0.25
0.30
0.35
0.40
0.45
0.50
Dbh RGR (cm year cm )
Acute Wide
0.00
0.05
0.10
0.15
0.20
0.25
0.30
Height RGR (m year m )
0.5 m 0.75 m 1.0 m 1.5 m 2.0 m
Branch angle type
Branch angle type
Acute
Wide
Branch angle type
Spacing
Acute
Wide
Branch angle type
-1
-1
-1
-1
Figure 2. Growth differences for cumulative dbh and height and RGR obtained from measurement of all the trees at the end of two
successive growing seasons. (Error bars represent standard deviations).
Table II. ANOVA p-values for cumulative growth and RGR for dbh and height.
Source of variation Dbh Height
1990 1991 1990 1991 Dbh RGR Height RGR
Spacing <0.01 <0.01 0.654 0.878 <0.01 0.044
Branch angle type 0.306 0.079 0.435 0.152 0.570 0.028
Spacing
× branch angle type 0.443 0.086 0.645 0.370 0.902 0.105
Contrasts
0.5 vs. 0.75, 1.0, 1.5 <0.01 <0.01 - - <0.01 <0.01
0.75 vs. 1.0 0.214 0.013 - - 0.144 0.494
0.75, 1.0 vs. 1.5, 2.0 0.143 0.007 - - <0.01 0.156
1.5 vs. 2.0 0.753 0.489 - - 0.145 0.382
Performance of young jack pine under competition
641
1990 1991 1990 1991
0.00
0.50
1.00
1.50
2.00
2.50
3.00
Crown width (m)
Acute
Wide
Branch angle type
Acute
Wide
Branch angle type
Spacing
1990 1991 1990 1991
0.00
0.10
0.20
0.30
0.40
0.50
0.60
0.70
0.80
0.90
1.00
Crown ratio
1990 1991 1990 1991
0.00
0.05
0.10
0.15
0.20
0.25
0.30
0.35
0.40
0.45
Leaf weight ratio
Acute
Wide
Branch angle type
1990 1991 1990 1991
0.000
0.005
0.010
0.015
0.020
0.025
0.030
0.035
0.040
0.045
0.050
0.055
Needle density ratio (gr cm )
0.5 m 0.75 m 1.0 m 1.5 m 2.0 m
Acute
Wide
Branch angle type
-2
Table III. ANOVA p-values for crown width and morphological measures of crown development.
Crown width Crown ratio Needle density Leaf weight
Source of variation ratio ratio
1990 1991 1990 1991 1990 1991 1990 1991
Spacing <0.01 <0.01 <0.01 <0.01 <0.01 <0.01 <0.01 <0.01
Branch angle type 0.145 0.244 0.617 0.716 0.186 0.725 0.150 0.912
Spacing
× branch angle type 0.541 0.446 0.628 0.265 0.527 0.092 0.802 0.433
Contrasts
0.5 vs. 0.75, 1.0, 1.5 <0.01 <0.01 <0.01 <0.01 <0.01 <0.01 <0.01 <0.01
0.75 vs. 1.0 0.281 0.326 0.792 <0.01 0.083 0.016 0.429 0.106
0.75, 1.0 vs. 1.5, 2.0 <0.01 <0.01 0.613 <0.01 0.049 <0.01 0.158 <0.01
1.5 vs. 2.0 0.546 0.646 0.992 0.59 0.272 0.934 0.740 0.704
Figure 3. Mean values for crown width, crown ratio, needle density ratio and leaf weight ratio for both branch angle types measured
on sample trees harvested at the end of two growing seasons. (Error bars represent standard deviations).
G.R. Larocque
642
Table IV. Coefficients and statistics for linear regression equations relating needle density ratio (NDR) to crown shape ratio (CSR),
spacing and year.
Branch angle type Intercept CSR Spacing Year R
2
SE
E
p
Acute 25.8121 –0.03754 0.01838 –0.01295 0.66 0.00597 <0.01
(–0.481)
a
(0.757) (–0.487)
Wide 16.0752 –0.04298 0.01870 –0.00806 0.72 0.00796 <0.01
(–0.668) (0.913) (–0.364)
a
Values within brackets are the beta coefficients.
R
2
, coefficient of determination; SE
E
, standard error of estimate; p, regression ANOVA p-values.
Acute
Wide
Branch angle type
Needles
Branches
Acute
Wide
Branch angle type
Acute
Wide
Branch angle type
1990 1991 1990 1991
0
2
4
6
8
10
12
14
16
18
[N] (mg/g)
1990 1991 1990 1991
0
1
2
3
4
5
6
7
[N] (mg/g)
1990 1991 1990 1991
0.0
0.5
1.0
1.5
2.0
2.5
3.0
3.5
4.0
[N] (mg/g)
0.5 m
0.75 m
1.0 m
1.5 m
2.0 m
Stems
Spacing
Figure 4. Mean nitrogen concentrations in needles, branches and stems for each branch type measured on sample trees harvested at
the end of two successive growing seasons (error bars represent standard deviations).
Performance of young jack pine under competition
643
However, the relative contribution of CSR was greater
for wide branch angle trees than for acute branch angle
trees.
3.4. Nutrients
Branch angle type was not significant for N concen-
trations in needles, branches and stems in both years
(table V). In 1990, significantly greater N concentrations
for needles and branches were obtained in the 1.5 m and
2.0 m spacings relative to the 0.75 m and 1.0 m spacings
(figure 4, table V). The same pattern was obtained for
needles in 1991. For stems, only the 0.5 m spacing dif-
fered significantly from the mean of the 0.75 m, 1.0 m
and 1.5 m spacings. In 1991, no significant difference
was obtained for branches and stems.
Highly significant regression equations of LWR as a
function of CR and needle N concentration were
obtained for both branch angle types (table VI). Crown
ratio made a much greater relative contribution than nee-
dle N concentration.
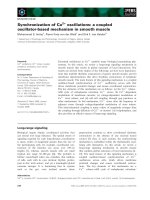
3.5. Growth efficiency variation with tree size
For conciseness, the distributions of dbh RGR, FPC
and SUR with dbh are illustrated only for wide branch
angle trees in block 1
(figures 5 and 6). Despite fluctua-
tions, RGR distribution was relatively flat for the 0.5 m
and 0.75 m spacings, while there was a pattern of
decrease in RGR with increase in dbh in the 1.0 m, 1.5 m
and 2.0 m spacings (figure 5). FPC and SUR decreased
with increase in dbh within the five spacings (figure 6).
However, the decrease was more pronounced within the
1.0 m, 1.5 m and 2.0 m spacings than within the 0.5 m
and 0.75 m spacings.
4. DISCUSSION
4.1. Branch angle
Even though both branch angle types originated from
trees with different branch angle characteristics and
showed significant differences in mean branch angle,
this heritability trait did not result in a significant advan-
tage for crown development and stem growth under
competition, as indicated by the lack of statistical signifi-
cance for stem growth and crown variables. Two reasons
may explain these results. Assuming that wide branch
angle trees could constitute a competitive advantage
because of greater crown spread, the increase in the
amount of solar radiation that needles could receive did
Table V. ANOVA p-values for nitrogen concentrations in needles, branches and stems.
Source of variation Needles Branches Stems
1990 1991 1990 1991 1990 1991
Spacing 0.017 <0.01 <0.01 0.103 0.054 0.811
Branch angle type 0.845 0.457 0.237 0.134 0.062 0.935
Spacing
× branch angle type 0.870 0.309 0.229 0.632 0.972 0.285
Contrasts
0.5 vs. 0.75, 1.0, 1.5 0.161 0.560 0.109 – 0.024 -
0.75 vs. 1.0 0.912 0.367 0.461 – 0.362 -
0.75, 1.0 vs. 1.5, 2.0 0.002 <0.01 <0.01 – 0.147 -
1.5 vs. 2.0 0.612 0.444 0.341 – 0.159 -
Table VI. Coefficients and statistics for linear regression equations relating leaf weight ratio (LWR) to crown ratio (CR) and needle
nitrogen concentration.
Branch angle type Crown ratio Needle N concentration R
2
SE
E
p
Acute 0.49834 –0.00904 0.97 0.0574 <0.01
(1.381)
a
(–0.4078)
Wide 0.4685 –0.00795 0.97 0.0519 <0.01
(1.3564) (–0.3793)
a
Values within brackets are the beta coefficients.
R
2
, coefficient of determination; SE
E
, standard error of estimate; p, regression ANOVA p-values.
G.R. Larocque
644
not necessarily result in increased net CO
2
assimilation,
even for trees that were not subject to branch interlock.
Although Stewart and Hoddinott [60] and Noland et al.
[44] have shown that jack pine needles are very sensitive
to light conditions, they also indicate that there is a
threshold level beyond which the increase in photon flux
density does not result in equivalent increase in net CO
2
assimilation. For trees that became subject to branch
interlock, increased internal shade resulting from a
greater horizontal spread of branches (figure 3) may
have reduced substantially the amount of light reaching
the interior of the crown close to the stem, irrespective of
branch angle. However, as the stands were still relatively
young, it is premature to ascertain that branch angle will
not become a competitive advantage later.
4.2. Growth and foliage nitrogen
Changes in the intensity of competitive stress
occurred rapidly in these young stands, as suggested by
the increased differences in cumulative dbh and crown
dimensions among spacings within one year. Dbh RGR
and the rate of change in crown width nearly doubled
from the closest to the largest spacings and crowns
receded by about 20% within the 0.5 m and 0.75 m spac-
ings. This relatively rapid change in competition is not
surprising. In studies dealing with the effect of interspe-
cific competition, it was found that the growth of jack
pine seedlings was highly sensitive to the presence of
both herbaceous and lignified pioneer species, and that
this sensitivity was more important in jack pine than in
other boreal species such as white pine (Pinus strobus L.)
and black and white spruces [5, 33, 39, 40]. Even though
height RGR of the 0.5 m spacing was statistically differ-
ent from the mean of the 0.75m, 1.0 m and 1.5 m spac-
ings, the lower RGR and little differences in cumulative
growth in both years are not biologically significant
compared with the changes obtained for dbh. The
absence of variation in height response under different
stand densities was also observed by Bella and
DeFranceschi [4], Smith [58] and Morris et al. [38].
Morris et al. [38] reported that it was probably due to the
fact that the apical meristems of jack pine are poor pho-
tosynthate sinks.
The significant differences among spacings for N con-
centrations in needles, branches and stems suggest that
belowground competition took place at this early stage
of stand development. When compared with standards
derived by Swan [62] for jack pine, needle N concentra-
tions in 1990 for the 0.5 m, 0.75 m and 1.0 m spacings
were within the range of low concentrations while the
1.5 m and 2.0 m spacings were within the range of criti-
cal concentrations. Concentrations in 1991 were within
Figure 5. Dbh RGR variation with dbh for wide branch angle
trees located in block 1.
Performance of young jack pine under competition
645
Figure 6. Variation in foliage productive capacity and specific utilization rate with dbh for wide branch angle trees located
in block 1.
G.R. Larocque
646
the range of critical concentrations for all spacings. In
fertilization trials in jack pine stands of approximately
the same age as the trees in this study, Calvert and
Armson [6] obtained significant differences in N concen-
trations for needles of the same magnitude found in this
study. In a similar study undertaken by Sheedy [56],
equivalent changes in diameter growth rate were related
to equivalent changes in nutrient concentrations.
4.3. Crown development
The results obtained for crown width indicate that the
reduction in light intensity that occurred before branches
began to interlock was sufficient to reduce the photosyn-
thetic rate of jack pine needles, particularly those located
in the inferior whorls of the crowns. In 1990, crown
width differed significantly among spacings. However,
there was no crown overlap, even in the closest spacings,
as the horizontal space occupied by individual crowns in
the 0.5 m and 0.75 m spacings was on average lower
than the area available for individual trees in these spac-
ings (figure 3). Also, significant reductions in crown
width were obtained in the 0.75 m and 1.0 m spacings
relative to the 1.5 m and 2.0 m spacings well before
crowns could overlap with their neighbors. Compared
with crown width, however, changes in crown ratio were
not substantial, which indicates that, as crown recession
took place relatively slowly, needles deep within the
canopy were able to photosynthesize under relatively
low light intensity. The results for crown width and
crown ratio appear contradictory because the former
ones suggest that light is a critical factor in young jack
pine stands while the latter ones do not. A full explana-
tion of these differences would require detailed physio-
logical measurements in various sections of jack pine
crowns in the same competitive conditions. However, it
may be hypothesized that jack pine needles are very sen-
sitive to small reductions in light intensity, even like
those occurring before crown closure takes place, but
that nevertheless they are able to photosynthesize under
low light intensity. This is supported by the findings of
Logan [31], Stewart and Hoddinott [60] and Noland etal.
[44] for jack pine seedlings. Logan [31] observed that
growth took place under 13% of full sunlight, and
Stewart and Hoddinott [60] and Noland et al. [44] mea-
sured net CO
2
assimilation under photon flux density as
low as 50 µmol m
–2
s
–1
. However, the last two studies
also indicated that the net CO
2
assimilation of jack pine
needles decreased sharply as light intensity was reduced.
For instance, Noland et al. [44] measured net CO
2
assim-
ilation rates as low as 2.5% for seedlings growing under
20% of full sunlight compared with seedlings under full
sunlight.
The increased differences among spacings for NDR
from 1990 to 1991 (table III, figure 3) indicate that the
efficiency of young jack pine crowns to occupy their aer-
ial growing space was negatively affected by competi-
tion and that the intensification of competition accentuat-
ed this trend. However, the reduction from 1990 to 1991
in each spacing was not entirely caused by competition,
as a decrease in NDR was also obtained in the largest
spacings. This occurred because crown width increased
while needle biomass decreased (figure 3). The closer
the spacing, the slower crown width increased, and the
greater needle mortality was. This can be explained by
the increase in shade within the crowns as they increased
in size [24, 47, 57]. As reported by Stewart and
Hoddinott [60] and Noland et al. [44], net CO
2
assimila-
tion rate in jack pine needles is very sensitive to small
reductions in light intensity. As crowns grew bigger,
needles inside the crowns closer to the stem probably
disappeared because the quantity of light was insuffi-
cient to maintain an adequate equilibrium between pho-
tosynthesis and respiration. The effect of self-shading
probably accentuated as spacing decreased because of
the presence of relatively close neighboring crowns. The
negative relationship between NDR and CSR agrees
with the findings of Kuuluvainen [24] for Norway spruce
(Picea abies (L.) Karst.) and of Larocque and Marshall
[28] for red pine and suggests that, despite the decrease
in NDR with the increase in competition, needles of trees
with narrow crowns within a given spacing occupied
their growing space more efficiently than trees with larg-
er crowns. This relationship was more critical for wide
branch angle trees probably because the crowns were
slightly larger in 1991 than the crowns of acute branch
angle trees.
Similarly to NDR, the decrease in LWR from 1990 to
1991 within each spacing was probably caused in part by
internal shading within crowns before branch interlock.
However, the accentuation of significant differences
among spacings from 1990 to 1991 indicates that compe-
tition affected dry matter allocation, as the proportion of
photosynthesizing tissue relative to the proportion
of respiring tissue decreased. The regression analysis of
LWR as a function of CR and needle N concentration
highlighted the importance of both above- and below-
ground competition. However, the greater Beta coeffi-
cients for crown ratio indicate that the intensity of crown
recession had a greater effect than needle nitrogen con-
centration on dry matter allocation, which suggests that
aboveground competition was more important than
belowground competition. Both branch types did not dif-
fer much in the relative contribution of crown ratio and
needle nitrogen concentration to dry matter accumula-
tion.
Performance of young jack pine under competition
647
4.4. Growth efficiency variation with tree size
The patterns of variation of dbh RGR with tree size,
that is, the relatively small decrease in the two closest
spacings and the sharp decrease in the three largest spac-
ings, are similar to two of the trends observed by Perry
[47] and Larocque and Marshall [27]: (1) decrease in
RGR with increase in tree size in the absence of severe
competition, and (2) relatively little variation in RGR
with tree size at the onset of severe competition. The
first trend characterizes the 1.0 m, 1.5 m and 2.0 m spac-
ings and the second one the 0.5 m and 0.75 m spacings.
However, contrary to the findings of Perry [47] for
Douglas-fir and Larocque and Marshall [27] for red pine,
the reversal of the trend as the intensity of competitive
stress increased was not obtained, which suggests that
jack pine responds slower than Douglas-fir and red pine
to changes in growth efficiency as the intensity of com-
petition increases. The patterns similar to RGR that were
obtained for FPC and SUR within every spacing imply
that small trees were more efficient producers of stem-
wood per unit of photosynthetic tissue and per unit of
nitrogen uptaken than large trees in the absence of severe
competition, and, therefore, support the hypothesis of
change in efficiency in relation to the use of resources by
trees under variable intensities of competition.
The decrease in dbh RGR with increase in tree size
indicates that small trees are more efficient producers of
stemwood than large trees in the absence of competition
[47]. According to Perry [47], when this occurs, large
trees with bigger crowns are less efficient to produce
stemwood than small trees because of their greater main-
tenance respiration needs associated with larger roots,
stems and branches, even though they have a greater
photosynthetic productivity. Kaufmann and Ryan [22]
and Roberts et al. [51] reached the same conclusion after
observing a decline in leaf area efficiency, which is simi-
lar in concept to FPC derived in the present study, with
increase in crown leaf area. The hypothesis of greater
respiration needs for larger trees is supported by the
study of Ryan [52] in which sapwood volume for three
subalpine conifers was estimated. Reed et al. [50] sug-
gested that canopy stratification may also explain the
occurrence of these patterns. In stands consisting of uni-
formly distributed young trees, there is little canopy
stratification and light conditions do not differ much
among trees. In these conditions, which occur in stands
before the onset of competition, trees with lower leaf
area are more efficient producers of stemwood. As
canopy stratification takes place when competition
begins, individual tree light conditions increasingly dif-
fer, which affects the pattern of leaf area distribution.
5. CONCLUSION
The results of this study highlighted the high sensitiv-
ity of young jack pine to competition. Crown develop-
ment was negatively affected by the presence of neigh-
boring crowns well before branch interlock, and
differences in crown recession rate, needle density ratio
and dry matter allocation among spacings increased sig-
nificantly within one year. However, differences in nee-
dle nitrogen concentration among spacings were relative-
ly less pronounced. Branch angle trait did not constitute
a significant advantage for crown development and stem
growth. The measures of growth efficiency based on
RGR and on the ratios of dbh increment to needle bio-
mass and nitrogen content can be used to evaluate the
competitive status of stands. In particular, the last two
ratios express the changes in efficiency in relation to the
photosynthetic component of the tree and nitrogen
uptake rate. Thus, they can be used as reliable tools to
study, in more depth, stand dynamics in the light of dif-
ferent levels of competitive stress.
Acknowledgements: The assistance of L. Clark,
B. Frederick, F. McBain, H. Markussen, E. Turcotte and
I. Miller, formerly of the Petawawa National Forestry
Institute, with field work and laboratory analysis is
greatly appreciated. Sincere thanks are also extended to
Drs. A.L. D’Aoust and G. Robitaille, Mr. R. Boutin and
Ms. M. Bernier-Cardou, of the Laurentian Forestry
Centre, and to Dr. J P. Carpentier, of the Quebec
Ministry of Natural Resources, for helpful comments in
the review of the manuscript and advice on statistical
analyses.
REFERENCES
[1] Adams G.W., Morgenstern E.K., Multiple-trait selection
in jack pine, Can. J. For. Res. 21 (1991) 439–445.
[2] Beaudoin R., Variabilité phénotypique et corrélations
juvéniles-adultes chez les pins gris de la provenance “Briand”,
Mémoire de recherche forestière n° 109, Direction de la
Recherche et du Développement, Ministère de l’Énergie et des
Ressources, Québec, 1993.
[3] Bella I.E., Spacing effects 20 years after planting three
conifers in Manitoba, Forest Management Note No. 39,
Northern Forestry Centre, Can. For. Serv., 1986.
[4] Bella I.E., DeFranceschi J.P., Spacing effects 15 years
after planting three conifers in Manitoba, Inf. Rep. NOR-X-
223, Northern Forest Research Centre, Can. For. Serv., 1980.
[5] Brand D.G., The establishment of boreal and sub-boreal
conifer plantations: an integrated analysis of environmental
conditions and seedling growth, For. Sci. 37 (1991) 68–100.
G.R. Larocque
648
[6] Calvert R.F., Armson K.A., The growth response of
young jack pine to nitrogen and phosphorus, Can. J. For. Res. 5
(1980) 529–538.
[7] Cannell M.G.R., Rothery P., Ford E.D., Competition
within stands of Picea sitchensis and Pinus contorta, Ann. Bot.
53(1984) 349–362.
[8] Ceulemans R., Stettler R.F., Hinckley T.M., Isebrands
J.G., Heilman, P.E., Crown architecture of
Populus clones as
determined by branch orientation and branch characteristics,
Tree Physiol. 7 (1990) 157–167.
[9] Colin F., Houllier F., Branchiness of Norway spruce in
northeastern France: predicting the main crown characteristics
from usual tree measurements, Ann. Sci. For. 49 (1992)
511–538.
[10] Erickson R.O., Modeling of plant growth, Annu. Rev.
Plant Physiol. 27 (1976) 407–434.
[11] Farrar R.M., Jr. 1984. Crown ratio used as a surrogate
for form in a volume equation for natural longleaf pine stems,
in: Shoulders, E., (Ed.), Proceedings of the Third Biennial
Southern Silvicultural Research Conference, Atlanta, GA,
November 7-8, 1984, Gen. Tech. Rep. SO-54, Southern For.
Exp. Stn., USDA Forest Service, New Orleans, Louisiana,
1984, pp. 429–435.
[12] Fitter A.H., Hay R.K.M., Environmental Physiology of
Plants, 2nd ed., Academic Press, Toronto, 1987.
[13] Ford E.D., An ecological basis for predicting the
growth and stability of plantation forests, in: Ford E.D.,
Malcolm D.C., Atterson J. (Eds.), The Ecology of Even-aged
Forest Plantations, Institute of Terrestrial Ecology, Cambridge,
United Kingdom, 1979, pp. 147–174.
[14] Ford E.D., The dynamics of plantation growth, in:
Bowen G.D., Nambiar E.K.S. (Eds.), Nutrition of Plantation
Forests, Academic Press, London, 1984, pp. 17–52.
[15] Gleeson S.K., Tilman D Plant allocation, growth rate
and successional status, Funct. Ecol. 8 (1994) 543–550.
[16] Goldberg D.E. 1990. Components of resource competi-
tion in plant communities, in: Grace J.B., Tilman D. (Eds.),
Perspectives on Plant Competition, Academic Press, New
York, pp. 27–49.
[17] Harper J.L., Population Biology of Plants, Academic
Press, London, 1977.
[18] Hunt R., Plant Growth Curves: the Functional
Approach to Plant Growth Analysis, Edward Arnold
(Publishers) Limited, London, 1982.
[19] Hunt R., Basic Growth Analysis, Unwin Hyman Ltd,
London, 1990.
[20] Janas P.S., Brand D.G., Comparative growth and
development of planted and natural stands of jack pine, For.
Chron. 64 (1988) 320–328.
[21] Kalra Y.P., Maynard D.C., Methods manual for forest
soil and plant analysis, Inf. Rep. NOR-X-319, Northern
Forestry Centre, Forestry Canada, 1991.
[22] Kaufmann M.R., Ryan M.G., Physiographic, stand, and
environmental effects on individual tree growth and growth
efficiency in subalpine forests, Tree Physiol. 2 (1986) 47–59.
[23] Kaufmann M.R., Watkins R.K., Characteristics of
high- and low-vigor lodgepole pine trees in old-growth stands,
Tree Physiol. 7 (1990) 239–246.
[24] Kuuluvainen T., Crown architecture and stemwood
production in Norway spruce (
Picea abies (L.) Karst.), Tree
Physiol. 4 (1988) 337–346.
[25] Kuuluvainen T. 1991. The effect of two growth forms
of Norway spruce on stand development and radiation intercep-
tion: a model analysis. Trees (Berl.) 5: 171–179.
[26] Kuuluvainen T., Pukkala T., Effect of crown shape and
tree distribution on the spatial distribution of shade, Agric. For.
Meteorol. 40 (1987) 215–231.
[27] Larocque G.R., Marshall P.L., Evaluating the impact of
competition using relative growth rate in red pine (
Pinus
resinosa
Ait.) stands, For. Ecol. Manag. 58 (1993) 65–83.
[28] Larocque G.R., Marshall P.L., Crown development in
red pine stands. I. Absolute and relative growth measures, Can.
J. For. Res. 24 (1994a) 762–774.
[29] Larocque G.R., Marshall P.L., Crown development in
red pine stands. II. Relationships with stem growth, Can. J. For.
Res. 24 (1994b) 775–784.
[30] LeBlanc P.A., Towill W.D. 1989. Can jack pine pro-
ductivity in north central Ontario be predicted using multiple
regression soil-site equations? Technical Report No.33,
Northwestern Ontario Forest Technology Development Unit,
Ontario Ministry of Natural Resources, Thunder Bay.
[31] Logan K.T., Growth of tree seedlings as affected by
light intensity. II. Red pine, white pine, jack pine and eastern
larch, Publication No. 1160. Department of Forestry of Canada,
1966.
[32] MacDonald G.B., Morris D.M., Marshall P.L.,
Assessing components of competition indices for young boreal
plantations, Can. J. For. Res. 20 (1990) 1060–1068.
[33] MacDonald G.B., Weetman G.F., Functional growth
analysis of conifer seedling responses to competing vegetation,
For. Chron. 69 (1993) 64–70.
[34] Magnussen S., Smith V.G., Yeatman C.W., Tree size,
biomass, and volume growth of twelve 34-year-old Ontario
jack pine provenances, Can. J. For. Res. 15 (1985) 1129–1136.
[35] Magnussen S., Yeatman C.W., Early testing of jack
pine. II. Variance and repeatability of stem and branch charac-
ters, Can. J. For. Res. 17 (1987) 460–465.
[36] Margolis H.A., Brand D.G., An ecophysiological basis
for understanding plantation establishment, Can. J. For. Res. 20
(1990) 375–390.
[37] Morris D.M., Forslund R.R., A field-oriented competi-
tion index for young jack pine plantations and a computerized
decision tool for vegetation management, New For. 5 (1991)
93–107.
[38] Morris D.M., Bowling C., Hills S.C., Growth and form
responses to pre-commercial thinning regimes in aerially seed-
ed jack pine stands: 5th year results, For. Chron. 70 (1994)
780–787.
[39] Morris D.M., MacDonald G.B., McClain K.M.,
Evaluation of morphological attributes as response variables
Performance of young jack pine under competition
649
to perennial competition for 4-year-old black spruce and jack
pine seedlings, Can. J. For. Res. 20 (1990) 1696–1703.
[40] Morris D.M., MacDonald G.B., Development of a
competition index for young conifer plantations established on
boreal mixedwood sites, For. Chron. 67 (1991) 403–410.
[41] Morris D.M., Parker W.H., Variable-quality form in
mature jack pine stands: quantification and relationship with
environmental factors, Can. J. For. Res. 22 (1992) 279–289.
[42] Morrison I.K., Foster N.W., Effect of nitrogen, phos-
phorus and magnesium fertilizers on growth of a semimature
jack pine forest, northwestern Ontario, For. Chron. 71 (1995)
422–425.
[43] Munson A.D., Timmer V.R., Soil nitrogen dynamics
and nutrition of pine following silvicultural treatments in bore-
al and Great Lakes-St. Lawrence plantations, For. Ecol.
Manag. 76 (1995) 169–179.
[44] Noland T.L., Mohammed G.H., Scott M., The depen-
dence of root growth potential on light level, photosynthetic
rate, and root starch content in jack pine seedlings, New For.
13 (1997) 105–119.
[45] Norgren O. Growth analysis of Scots pine and lodge-
pole pine seedlings, For. Ecol. Manag. 86 (1996) 15–26.
[46] Payandeh, B., Sutton R.F., Modeling early plantation
performance: identification of critical factors, Scand. J. For.
Res. 4 (1989) 75–86.
[47] Perry D.A., The competition process in forest stands,
in: Cannell M.G.R., Jackson J.E. (Eds.), Attributes of Trees as
Crop Plants, Institute of Terrestrial Ecology, Huntingdon,
England, 1985, pp. 481–506.
[48] Pöykkö V.T., Pulkkinen P.O., Characteristics of nor-
mal-crowned and pendula spruce (
Picea abies (L.) Karst.)
examined with reference to the definition of a crop tree ideo-
type, Tree Physiol. 7 (1990) 201–207.
[49] Radosevich S.R., Osteryoung K.,. Principles governing
plant-environment interactions, in: Walstad J.D., Kuck P.J.
(Eds.), Forest Vegetation Management for Conifer Production,
Wiley, New York, 1987, pp. 105–156.
[50] Reed D.D., Mroz G.D., Liechty H.O., Jones E.A.,
Cattelino P.J., Balster N.J., Zhang Y., Above- and below-
ground biomass of precompetitive red pine in northern
Michigan, Can. J. For. Res. 25 (1995) 1064–1069.
[51] Roberts S.D., Long J.N., Smith F.W., Canopy stratifi-
cation and leaf area efficiency: a conceptualization, For. Ecol.
Manage. 60 (1993) 143–156.
[52] Ryan M.G., Sapwood volume for three subalpine
conifers: predictive equations and ecological implications, Can.
J. For. Res. 19 (1989) 1397–1401.
[53] SAS Institute Inc., SAS/STAT
®
User’s Guide, Version
6, Fourth Edition, Vol. 2, SAS Institute Inc., Cary, NC, 1989.
[54] Schmidt M.G., Carmean W.H , Jack pine site quality
in relation to soil and topography in north central Ontario, Can.
J. For. Res. 18 (1987) 297–305.
[55] Schmitt J., Eccleston J., Ehrhardt D.W., Dominance
and suppression, size-dependent growth and self-thinning in a
natural
Impatiens capensis population. J. Ecol. 75 (1987)
651–665.
[56] Sheedy G., Essai de fertilisation dans une jeune planta-
tion de pin gris. Résultats de cinq ans, mémoire n
o
83, Service
de la recherche, Min. de l’Énergie et des Ressources, Gouv. du
Québec, 1982.
[57] Sheppard L.J., Ford E.D., Genetic and environmental
control of crown development in
Picea sitchensis and its rela-
tion to stem wood production, Tree Physiol. 1 (1986) 341–352.
[58] Smith C.R Precommercial thinning in jack pine with
particular reference to experiments in northeastern Ontario. In:
Smith C.R., Brown G. (Eds.), Jack Pine Symposium, 18-20
Oct. 1983, Timmins, Ont., COJFRC Symposium Proceedings
O-P-12, Great Lakes For. Res. Centre, Can. For. Serv., Sault
Ste. Marie, Ontario, 1984, pp. 122–130.
[59] Sprinz P.T., Burkhart H.E., Relationships between tree
crown, stem, and stand characteristics in unthinned loblolly
pine plantations, Can. J. For. Res. 17 (1987) 534–538.
[60] Stewart J.D., Hoddinott J., Photosynthetic acclimation
to elevated atmospheric carbon dioxide and UV irradiation in
Pinus banksiana, Physiol. Plant. 88 (1993) 493–500.
[61] St-Pierre H., Gagnon R., Bellefleur P., Régénération
après feu de l’épinette noire (
Picea mariana) et du pin gris
(
Pinus banksiana) dans la forêt boréale, Québec, Can. J. For.
Res. 22 (1992) 474–481.
[62] Swan H.S.D., Relationship between nutrient supply,
growth and nutrient concentrations in the foliage of black
spruce and jack pine. Woodlands Pap. No. 19, Pulp Pap. Res.
Inst. Can., Montréal, 1970.
[63] Wang Y.P., Jarvis P.G., Influence of crown structural
properties on PAR absorption, photosynthesis, and transpira-
tion in Sitka spruce: application of a model (MAESTRO), Tree
Physiol. 7 (1990) 297–316.
[64] Waring R.H., Thies W.G., Muscato D., Stem growth
per unit of leaf area: a measure of tree vigor, For. Sci. 26
(1980) 112–117.
[65] Waring R.H., Newman K., Bell J.,. Efficiency of tree
crowns and stemwood production at different canopy leaf den-
sities, Forestry 54 (1981) 129–137.