Báo cáo khoa học: "A generic model of forest canopy conductance dependent on climate, soil water availability and leaf area index" potx
Bạn đang xem bản rút gọn của tài liệu. Xem và tải ngay bản đầy đủ của tài liệu tại đây (153.97 KB, 11 trang )
Original article
A generic model of forest canopy conductance
dependent on climate, soil water availability
and leaf area index
André Granier
a,*
, Denis Loustau
b
and Nathalie Bréda
a
a
Institut National de la Recherche Agronomique, Unité d'Écophysiologie Forestière, 54280 Champenoux, France
b
Institut National de la Recherche Agronomique, Unité de Recherches Forestières, BP 45, 33611 Gazinet Cedex, France
(Received 2 June 2000; accepted 3 October 2000)
Abstract – This paper analyses the variation in tree canopy conductance for water vapour (g
c
) in order to derive a general expression,
including the effects of solar radiation (
R), vapour pressure deficit (D), leaf area index (LAI) and extractable soil water. Canopy con-
ductance was calculated from transpiration measured in 21 broadleaved and coniferous forest stands, under different climates: tem-
perate, mountain, tropical and boreal. Common features in the dependence of
g
c
on climate and on soil water content were exhibited.
When soil water was not limiting,
g
c
was shown to increase linearly with LAI in the range 0 to 6 m
2
m
–2
and reach a plateau value.
Besides the positive effect of increasing
R and the negative effect of increasing D on g
c
, it was surprisingly shown that a decrease in
extractable soil water induced a similar reduction in
g
c
in various tree species, equally in coniferous and in broadleaved. Based on these
findings, a general canopy conductance function is proposed.
canopy conductance / sap flow / transpiration / species comparison / leaf area index / water stress / model / synthesis
Résumé – Un modèle générique de conductance de couverts forestiers dépendant du climat, de la disponibilité en eau dans le
sol et de l’indice foliaire.
Ce travail réalise l'analyse des facteurs de variation de la conductance du couvert pour la vapeur d'eau (g
c
)
avec l'objectif d'en donner une expression générale, prenant en compte les effets du rayonnement global (
R), du déficit de saturation
de l'air (
D), de l'indice foliaire (LAI) et de la réserve hydrique extractible du sol. La conductance du couvert a été calculée à partir de
la transpiration mesurée dans 21 peuplements forestiers feuillus et résineux, sous différents types climatiques : tempéré, montagnard,
tropical et boréal. Ce travail a montré, pour ces divers peuplements, une dépendance similaire entre
g
c
et les facteurs climatiques, ainsi
qu'avec la réserve hydrique extractible du sol (
REW). En conditions hydriques non limitantes, on observe que g
c
augmente linéaire-
ment avec le
LAI entre 0 et 6 m
2
m
–2
, puis atteint un plateau. De façon surprenante, en dehors de l'effet positif sur g
c
de l'augmenta-
tion de
R, et l'effet négatif de celle de D, on montre que la diminution de REW a des conséquences similaires sur g
c
pour diverses
espèces forestières, aussi bien feuillues que résineuses. À partir de ces observations, un modèle général de conductance de couvert est
proposé ici.
conductance de couvert / flux de sève / transpiration / comparaison inter spécifique / indice foliaire / sécheresse / modèle /
synthèse
Ann. For. Sci. 57 (2000) 755–765 755
© INRA, EDP Sciences
* Correspondence and reprints
Tél. (33) 03 83 39 40 38; Fax. (33) 03 83 39 40 69; e-mail:
A. Granier et al.
756
1. INTRODUCTION
During the last decades, a large number of studies have
been conducted, quantifying forest transpiration and its
spatial and temporal variation, under various stand condi-
tions (age, species, site, climate), involving different
techniques. High time scale resolution (hour) data can be
obtained through sap flow measurements [28], which
have few requirements in term of fetch and stand topog-
raphy as compared with the common meteorological
methods. Sap flow has been shown to measure accurate-
ly stand transpiration [9, 10, 28], providing an adequate
sampling of sap flux accounting for variation in size, tree
representativeness, species and age can be performed.
Thus, sap flow is scaled most usually from individual
trees to the stand, using a scaling variable, that can be tree
circumference, sapwood area or leaf area [28].
When analysing stand transpiration, large temporal
and spatial variation is generally observed. The first
source of variation is due to climate because available
energy and atmospheric deficit in vapour pressure drive
the transpiration flux from vegetation to the atmosphere.
The second source is the biological regulation exerted
through canopy surface conductance, which is controlled
mainly by stand LAI, and stomatal conductance. In addi-
tion, atmospheric turbulence and stand structure deter-
mines the aerodynamic transfer between the canopy and
the atmosphere. However, it is widely recognized that the
stand structure has a weak influence on variation in forest
transpiration as compared to climatic factors and surface
(or canopy) conductance. Forests are found over a wide
range of climates and differ in many characteristics rele-
vant to stand transpiration and canopy conductance, e.g.
their phenology, leaf life span, drought response (avoid-
ance vs. tolerance), canopy structure, etc. Whether some
common pattern in canopy conductance emerge across
forests is a challenging question since forest ecosystems
must also satisfy common ecological constraints such as
water conservation or xylem cavitation risk [49]. The aim
was here to analyse the different sources of variation in
canopy conductance between forest stands covering a
wide range conditions, using a simple multivariate model,
and try to separate the influence of climate from the
intrinsic characteristics of stand.
Different approaches have been developed to model
transpiration of forest stands. The most mechanistic mod-
els of canopy transpiration are multilayered [25]. They
describe the canopy transpiration within horizontal ele-
mentary layers. The multilayered models must be used in
the case of a two-layer vegetation as for instance to
describe the functioning of an overstory-understory asso-
ciation [25]. Since the work of Jarvis and Mc Naughton
(1976, [23]), many authors made the assumption that the
whole canopy acts as a single layer for water exchange to
the atmosphere, even if it has been demonstrated that
multilayer models are more suitable for detailed physio-
logical functioning of the forest canopy [39].
The objectives of this paper are to: 1) compare canopy
conductance among a large range of forest stands, differ-
ing in species composition or in climatic and soil charac-
teristics; 2) evaluate the effect of leaf area index as a
possible source of variation in transpiration; 3) build a
generic model of forest stand transpiration independent of
tree species.
2. METHODS
2.1. Sites
Site characteristics and tree species used in the analy-
sis are listed in table I. This data set covers a wide range
of tree species, coniferous and broadleaved, under vari-
ous climate and site conditions, temperate, tropical and
boreal. In some stands, measurements were performed
during several years, allowing us to take into account the
inter-annual variation of climate (table I).
In some of these experiments, soil water content in the
root zone was measured and data were converted to rela-
tive extractable water (
REW, dimensionless), defined as:
(1)
where W is the soil water content in the root zone, W
m
is
the minimum soil water (i.e. lower limit of water avail-
ability), W
FC
is the soil water content at field capacity.
2.2. Calculation of canopy conductance
Canopy conductance for water vapour (g
c
, ms
–1
) was
calculated from transpiration measurements and from cli-
mate data using the rearranged Penman Monteith equa-
tion (see [18]):
(2)
where E (kg m
–2
s
–1
) is the stand transpiration,
λ
(Jkg
–1
)
is the latent heat of water vaporisation,
γ
(PaK
–1
) is the
psychometric constant, s (PaK
–1
) is the rate of change of
saturating vapour pressure with temperature, A (Wm
–2
) is
the available energy of the forest canopy,
ρ
(kgm
–3
) is the
density of dry air, c
p
(JK
–1
kg
–1
) is the specific heat of air,
D (Pa) is the vapour pressure deficit, and g
a
(ms
–1
) is the
g
c
=
g
a
E
λγ
sA
+
ρ
c
p
Dg
a
–
λ
Ts
+
γ
REW
=
W
–
W
m
W
FC
–
W
m
A model of forest canopy conductance
757
aerodynamic conductance. We calculated g
a
from Thom's
[48] equation. In closed stands, available energy was
assumed to be equal to the net radiation measured over
the canopy, minus heat storage in the air and in the above
ground biomass. In open stands (e.g. LAI < 3), where a
significant fraction of the radiative flux reaches the soil
surface, heat flux in the soil should not be neglected.
Nevertheless, in the absence of soil heat flux measure-
ment in most of the studied stands, this term was not
taken into account here. However, when LAI < 3.0 and
canopies did not occupy the entire ground area, canopies
likely did not absorb all the net radiation and actual tree
canopy conductance would be underestimated.
In some experiments, E was directly measured above
the stand (Bowen ratio or eddy covariance technique),
while in other studies transpiration was estimated from
sapflow measurements. In most of our experiments pre-
sented here, the continuous heating technique was used
[8], performed on 5 to 10 trees according to stand hetero-
geneity [28]. For computing g
c
from transpiration and cli-
matic variables, some precautions were taken:
• periods during rainfall and for the 2 hours following
rainfall were excluded in order to avoid the discrepan-
cy between evaporation and tree transpiration,
• when either global radiation, vapour pressure deficit,
or stand transpiration were too low (< 5% of the max-
imum value), data were also eliminated, because of the
large relative uncertainties in computing
g
c
from equa-
tion 2 under these conditions.
Typically, discarded data correspond to early morning
and late afternoon periods. Furthermore, when D is low
during the early morning, dew is quite likely to occur and
affects tree transpiration and its measurement.
Excluding these data has only limited consequences on
calibrating the g
c
functions, because they represent peri-
ods of low transpiration rates. Modelling stand transpira-
tion under conditions of maximum transpiration rates, i.e.
when both D and g
c
are high (and therefore the product
g
c
.
D is high), is more crucial.
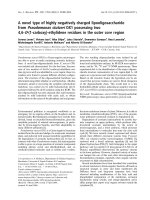
A time lag between sapflow and canopy transpiration
has been often reported, even when the vapour flux above
a stand was directly measured [11] or when it was esti-
mated by a model [5, 15]. This phenomenon is due to
water exchanges between tissues and the transpiration
stream within the trees [23]. This capacitance effect was
often reported in coniferous species [18, 22, 30, 31, 45],
the time lag being typically in the range of 1 to 2 h, while
it is much less important in broadleaved species (30min
in oak, 60min in poplar [15, 21]). Water exchanges can
be described with RC-analogue models [20, 31]. For an
accurate calculation of canopy conductance, it is there-
fore necessary to take into account this time lag in order
to improve the synchronism between sapflow and climat-
ic demand. When this time lag is not taken into account,
this would change the relationship between calculated
g
c
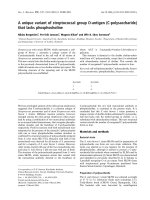
and the climatic variables changes (e.g., figure 1).
Furthermore, excluding the time lag results in an increase
of the scatter of data: in this example, correlation coeffi-
Table I. Main characteristics of the sites. Methods used for fluxes measurements are sap flow (SF), eddy covariance (EC) or energy
balance (EB).
Species Site Age Height Temp Rain LAI m
2
Method Project / reference /
(yr) (m) (°C) (mm) (m
–2
) SF/EC remarks
Quercus petraea Champenoux (France) 35 15 9.6 740 6.0 SF control [2, 3]
Q. petraea Champenoux (France) 35 15 9.6 740 3.3 SF thinned [2, 3]
Q. rubra Ede (The Netherlands) 17.4 4.9 EB [38]
Fagus sylvatica Hesse (France) 30 14 9.2 820 5.7 SF/EC EUROFLUX
F. sylvatica Aubure (France) 120 22.5 6.0 1500 5.7 SF REKLIP
F. sylvatica Kiel (Germany) 100 29 8.1 697 4.5 EB [19]
Abies bornmulleriana Champenoux (France) 25 11 9.6 740 8.9 SF plantation
Picea abies Champenoux (France) 21 11 9.6 740 9.5 SF plantation
P. abies Aubure (France) 30 13 6.0 1500 6.1 SF REKLIP
Pinus sylvestris Hartheim (Germany) 35 12 9.8 667 2.9 SF/EC HartX [27]
Pinus pinaster Losse (France) 37 20.3 13.5 900 2.5 SF/EC HAPEX-MOBILHY [14]
P. pinaster Le Bray (France) 18 12 13.5 900 2.7 SF EUROFLUX
Tropical rainforest Paracou (French Guiana) 33 25.8 2900 8.6 SF natural forest [16]
Simarouba amara Paracou (French Guiana) 5 4.7 25.8 2900 3.5 SF plantation [17]
Goupia glabra Paracou (French Guiana) 11 15 25.8 2900 4.3 SF plantation [16]
Eperua falcata Paracou (French Guiana) 11 10 25.8 2900 10.8 SF plantation
Pinus banksiana Old Jack Pine (SA, Canada) 75-90 12.7 0.1 390 2.2 SF/EC BOREAS [44]
A. Granier et al.
758
cients equalled to 0.32 with no time lag, vs. 0.67 with a
1 h time lag.
2.3. The canopy conductance sub-model
Jarvis and Steward [23, 47] proposed a multiplicative-
type function to relate the variation of g
c
to the environ-
mental factors. This approach is now widely used [6, 7,
12, 15, 18, 38]. The following model, derived from Jarvis
and Steward [23, 47] was used here:
g
c
= g
cmax
⋅ f
1
(R,D) ⋅ f
2
(LAI) ⋅ f
3
(I
s
) ⋅ f
4
(t) (3)
where g
cmax
(ms
–1
) is the maximum g
c
, reduced by the
following functions f
i
varying between 0 and 1 of: both
global radiation (R) and air vapour pressure deficit (D)
measured above the stand; leaf area index (LAI); a vari-
able quantifying water stress intensity (Is); air tempera-
ture (t). No interaction between the variables was
assumed here. According to the studies, the variable used
for water stress is either soil water deficit or leaf water
potential (see Sect. 3.3 below).
Validation can be performed in several ways: parame-
terise canopy conductance function parameters from one
year's data set, and compare estimated to measured g
c
and
transpiration for other years [47], compare model para-
meters obtained on even days to those on odd days with-
in the same set of data [7], compare measured to comput-
ed stomatal conductances, derived from calculated
canopy conductance and from
LAI [18].
In order to check if the response of one tree species
could be extrapolated to other site and climate conditions,
Granier et al. [13] compared measured tree transpiration
in an old mountain beech forest (Aubure forest) to tran-
spiration estimated from canopy conductance which was
calibrated in another beech stand growing under plain
conditions (Hesse forest, see table I).
Equation 3 was parameterised for each stand. First,
coefficients of f
1
(R,D) were fitted under non-limiting
Figure 1. Effect of accounting
for the time lag between sapflow
and vapour pressure deficit (
D)
on the estimate of canopy con-
ductance in
Pinus pinaster.
A model of forest canopy conductance
759
temperature and soil water, in stands with high LAI (>6).
Then, each other f
i
function was separately parame-
terised.
In order to compare the stands, we calculated a stan-
dardised canopy conductance (g
c
*), corresponding to the
following set of variables: global radiation = 500 Wm
–2
,
D=1kPa, Relative Extractable Water =1, and no limiting
air temperature (i.e. in the range 18–30°C).
3. RESULTS
3.1. Effects of radiation, vpd and temperature
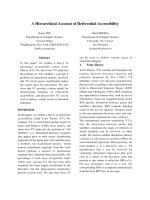
An example of the variation of canopy conductance in
beech (Fagus sylvatica) as a function of global radiation
and vapour pressure deficit is shown in figure 2. As for
stomatal conductance, canopy conductance increases
when incident radiation increases, and decreases when
vapour pressure deficit increases. We used Lohammar-
type equations for describing the combined effects of
both variables, expressed as follow:
Model 1: (4)
Model 2: (5)
Fitting of the parameters in equations (4) and (5) (and in
the further functions) was based on the minimum sum of
squares using the Gauss-Marquardt algorithm. In contrast
to stomatal conductance, those functions do not show a
saturation at high values of
R. The parameter R
0
varies
according to the species between 50 and 300 Wm
–2
, with-
out any clear relation to leaf area index. Nevertheless, the
highest R
0
coefficients are found in the coniferous stands.
Figure 2 shows a large scattering of g
c
within the low-
est radiation class (0 to 200 Wm
–2
). This scatter is the
result of both the rapid increase of g
c
with R, but also to
the large uncertainty in calculating canopy conductance
at low values of transpiration, such as during early morn-
ing or late afternoon.
Parameterisation of g
c
needs to take into account, if
possible, the effect of water exchange between tissues
and sap flow, provoking a time lag between transpiration
and sap flow. The procedure to test this capacitance effect
was the following: we introduced increasing time lags (0,
0.5, 1.0, 1.5 and 2.0 h) in the calculation of g
c
, sapflow
lagging behind climatic variables. At each step, the func-
tion f
1
was fitted, and the regression coefficients were
g
c
=
g
cmax
R
R
+
R
0
1
1+
b ⋅ D
⋅
g
c
=
g
cmax
R
R
+
R
0
a
–
b
ln
D
Figure 2. Canopy conductance (g
c
) in a
beech forest (
Fagus sylvatica) calculat-
ed from sapflow measurements as a
function of vapour pressure deficit (
D).
Data are sorted according to radiation.
Euroflux experiment, Hesse forest 1998
(France).
A. Granier et al.
760
compared. The time lag was assumed to correspond to the
highest r
2
obtained. We checked if this procedure was
correct by comparing this estimated time lag to the
observed time lag between water flux measured above the
stand and scaled up sap flow in a Scots pine forest [11];
the same value was obtained, equal to 90 min. For our
sample species (table I), it varied between 0 and 1.5 h,
depending on tree species. We found that water stress
increased the time lag in some tree species like Pinus
pinaster or Picea abies (data not shown). In experiments
where water supply varied during the season, we there-
fore applied this procedure to each soil water content
class.
Because radiation and vapour pressure deficit are cor-
related (r
2
ranging from 0.2 to 0.4), the coefficients R
0
, a,
and b are also correlated.
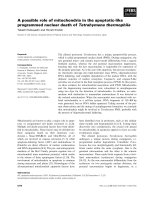
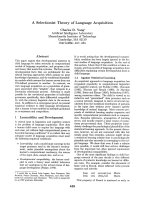
The variation of canopy conductance vs. D, under high
global radiation, R=700 Wm
–2
(figure 3), showed a sim-
ilar pattern in all studied stands. The negative effect of
increasing D on g
c
was accurately modelled with func-
tions 4 or 5. Coefficients of determination for models 1
and 2 were in general close, but model 2 often gave
slightly better fits than model 1. Besides this common
feature, some of the studied species were found to be
more sensitive to D. Two examples are Quercus petraea,
for both the control and thinned stands, and Simarouba
amara (tropical). In other tree species (Abies bornmulle-
riana, temperate, and Eperua falcata, tropical), sensitivi-
ty of g
c
to D was lower than the average response.
According to the tree species, the relative variation of g
c
,
when D passed from 1 to 2 kPa, ranged from –20% to
–60%. As reported by Oren et al. [37], g
c
sensitivity to D
is well correlated with g
cmax
. Fitting the coefficient b to a
of equation (4) gave: b = 0.253 a (r
2
= 0.92, see insert of
figure 3).
Absolute values of
g
c
differed markedly among the
stands. Canopy conductance appears to be higher in sites
where LAI is high (upper curves with closed symbols in
figure 3, LAI being in the range of 5.7 to 10.8), than in
low LAI stands.
When pooling all the stands where LAI > 5.7, the fol-
lowing function was obtained:
(r
2
= 0.76). (6)
In most of the data sets that we used here, when the
response of g
c
to both R and D was extracted, no signifi-
cant relationship between g
c
residuals and air temperature
was pointed out. This probably results from: i) the high
correlation between air temperature and D (r
2
> 0.5), ii)
the narrow range of temperatures, because most of the
observations were performed during summer.
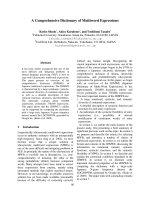
3.2. LAI
Figure 4 shows the relationship between standardised
canopy conductance g
c
* and LAI in 20 stands. For LAI <
6, g
c
* linearly increased to a value of 1.33 cms
–1
. With
LAI larger than 6.0, canopy conductance did not
increased further.
The following function was fitted on this data set:
LAI ≥ 6f
1
(LAI) = 1 [7]
LAI < 6 f
1
(LAI) = LAI / 6 .
3.3. Water stress
Many studies have demonstrated the negative effect of
soil water depletion on canopy conductance. Variation of
g
c
can be related either to predawn water potential as in
[32], to soil water reserve or soil water deficit [18], or to
relative extractable water in the soil (REW) as in [15]. We
preferred to use the latter variable for extensive studies
and for modelling purposes, because:
– predawn water potential, even if it a physiological
indicator of tree water status, and therefore has a more
causal significance, is not often available in field stud-
ies;
– soil water reserve is very site dependent, ranging from
ca. 50 to 200 mm, according to rooting depth, soil
properties, etc., while
REW is varying between 0 and
1, whatever the site;
– both predawn water potential and REW are strongly
related [4].
Figure 5 illustrates the relationship between g
c
and REW
in five coniferous and broadleaved stands. For all these
species, g
c
/g
cmax
progressively decreases when REW
varies from 1 to 0, this decrease being more pronounced
when REW drops below 0.4, as previously reported [12].
When pooling all the data, the following relationship was
obtained:
(
r
2
= 0.77) [8]
in which p
1
= 1.154 and p
2
= 3.0195.
f
2
I
s
=
p
1
+
p
2
⋅ REW
–
p
1
+
p
2
⋅ REW
2
–2.8
p
1
⋅ p
2
⋅ REW
1/2
1.4
g
c
=4.047
R
R
+100
1
1 +2.0615
D
A model of forest canopy conductance
761
Figure 3. Canopy conductance of various forest stands as a function of vapour pressure deficit, for a global radiation of 700 Wm
–2
,
under non-limiting soil water. Closed symbols correspond to stands with a high
LAI (≥5.7), open symbols or lines are for stands with
a lower
LAI (<5.7). The value of LAI is indicated in the legend. For Pinus pinaster + understorey: data of [7]. Insert, the relationship
between the coefficients a and b of the model 3 (see text).
A. Granier et al.
762
4. DISCUSSION
In contrast to grasslands, g
c
generally controls forest
transpiration [26] because it is at least one order of mag-
nitude lower than g
a
. This is less true in poorly ventilated
canopies such as in tropical rainforests [34, 40], in some
dense deciduous plantations [21] or during early morning
hours when windspeed (and therefore g
a
) is still low [33].
In most of the studies we reported here, the decoupling
coefficient Ω, as defined by McNaughton and Jarvis [36],
ranged between 0.1 and 0.2, demonstrating a strong cou-
pling between the canopies and the atmosphere. Thus, the
simplified model of transpiration proposed by
McNaughton and Black [35], derived from the Penman-
Monteith equation, is applicable in most forest types. In
this simplified model, transpiration is proportional to D,
g
c
and LAI.
The dependence of g
c
on D, expressed as the slope of
g
c
vs. ln(D) (= coefficient b of equation (4)), relative to
the intercept (= coefficient a) was found to be similar
between the forest stands reported here. A few exceptions
were noted. Two species demonstrated a slightly higher
sensitivity to atmospheric drought i.e.
Quercus petraea
and Simarouba amara, two light demanding tree species.
Finally, two species showed lower sensitivity, i.e. Abies
bornmulleriana
and Eperua falcata, both shade tolerant
and high LAI species. The common response of g
c
to D
(in 13 of the 17 species in table I) contrasts strongly with
leaf level measurements of stomatal conductance. Larger
differential stomatal sensitivity between species to air
vapour pressure deficit has been often reported, among
conifer species (e.g. in Sandford and Jarvis [42]). Our
observation probably results from the averaged response
of a whole canopy, resulting from the mixing of leaves of
different physiological properties (sun vs. shade, leaves
of different ages in coniferous species, etc.), submitted to
differing environmental conditions [29].
Figure 4. Standardised canopy con-
ductance
g
c
* (R = 500 Wm
–2
, D = 1
kPa) as a function of
LAI in 20 forest
stands. Same data as for figure 3. Other
values are coming from [19] and [38].
Data in the dotted circle are for the 3
pine stands (
Pinus pinaster and P.
sylvestris
).
A model of forest canopy conductance
763
The effect of air temperature on g
c
, although being less
investigated, seems to play an important role in the regu-
lation of stomatal and hence canopy conductance. In
Scots pine, Gash et al. [7] calibrated a parabolic function
with an optimum between 15 and 20°C. In beech, Granier
et al. [13] found in spring a decrease in g
c
when air tem-
perature dropped below 15°C. On the opposite, no tem-
perature effect was detected for oaks, neither in spring
nor in summer. Our attempts to derive the function f
3
in
equation (3) were not successful, and there are not
enough data yet available to derive a general relationship.
Probably, different species could show a different sensi-
tivity to temperature and different optima, tropical
species probably being more sensitive to temperature
than temperate and boreal species. Furthermore, Gash et
al. [7] calibrated different functions relating the depen-
dence of g
c
to temperature in a same tree species (Pinus
pinaster) growing in two sites.
A close similarity in transpiration of different forests
was also reported by Granier et al. [13] in two beech
stands, differing in both age (30 vs. 120 years old), and
growing conditions (plain vs. mountain). Moreover, in
this work, a comparison with the data from Herbst [19] on
the same species also showed very close g
c
function.
These 3 stands were characterised by similar values of
LAI (5.5 to 6.0).
Canopy conductance is nearly proportional to LAI
between 0 to 6, as previously shown by Granier and
Bréda [15], in which different temperate oak stands were
compared. Similar results have been noted within the
same stand during leaf expansion [15]. Compared to
forests, low vegetation like crops and grasslands, exhibit
a different response to increasing LAI, with g
c
and tran-
spiration saturating at a much lower LAI threshold (about
3 to 4) [43]. The saturation of forest transpiration at LAI
higher than 6.0 can be explained by the important shad-
ing of low canopy strata by the upper levels when LAI
increases. For LAIs less than 6, leaf area index is therefore
a key factor for explaining between-stand variation in
transpiration. Nevertheless, two tree species, Pinus
pinaster and P. Sylvestris (figure 4, dotted circle), were
distinguished from the average g
c
*(LAI) relationship,
Figure 5. Variation of relative canopy
conductance (
g
c
/g
cmax
), as a function of
relative extractable water in the soil
(
REW) in 5 forest stands: oak (Quercus
petraea
, LAI = 6.0), beech (Fagus sylvati-
ca
, LAI = 5.8), fir (Abies bornmulleriana,
LAI = 8.9), spruce (Picea abies, LAI = 6.1)
and pine (
Pinus pinaster, LAI = 2.7). In
oak, beech, spruce and pine,
g
c
is related to
modelled
g
cmax
. In fir, g
c
is related to g
cmax
measured in a well-watered plot. A unique
relationship was drawn.
A. Granier et al.
764
probably due to their clumped crown structure and, there-
fore, to their different radiation absorbing properties.
Similarity in response of various forest types to climate
has been previously highlighted by Shuttleworth [46]
who compared time courses of canopy conductance of
various temperate and tropical forests (see his figure 10,
p. 146). He found an average value of 1 cms
–1
for most
species. Under similar high radiation conditions, this cor-
responds to the value of g
c
that was observed here when
D equals about 1.5 kPa in forest stands with high LAI
(≥ 6).
The effect of soil water deficit on
g
c
was rather sur-
prising. A very similar response was noted in five very
different species (figure 5). For instance, Pinus pinaster
is a drought avoider [1], whereas Quercus petraea is a
drought tolerater [2]. The threshold 0.4 for REW, beyond
which canopy conductance is linearly reduced, was pre-
viously reported in a large spectrum of tree species and
soil types [12].
In conclusion, this work demonstrated that a generic
model of canopy conductance could be proposed, as
much for broadleaved as coniferous forest stands, even if
physiological differences are often observed at the leaf
level. This probably results from the canopy approach
that buffers the response of individual leaves forming the
canopy. For instance in the Amazonian forest, the canopy
layers behave differentially [40, 41], the lower layers
being less ventilated and therefore less coupled to the
atmosphere than the upper levels. Nevertheless, the
whole canopy response to both R and D is not very dif-
ferent from that of any other canopies [46].
We also showed that tree transpiration in open stands
is reduced when decreasing LAI. Nevertheless, the total
evapotranspiration is not proportionally reduced, since
stand opening increases the available energy reaching the
understorey vegetation and therefore increases its transpi-
ration rate.
REFERENCES
[1] Aussenac G., Granier A., Quelques résultats de cinétique
journalière du potentiel de sève chez les arbres forestiers, Ann.
Sci. For. 35 (1978) 19–32.
[2] Bréda N., Cochard H., Dreyer E., Granier A., Water
transfer in a mature oak stand (Quercus petraea): seasonal evo-
lution and effects of a severe drought, Can. J. For. Res. 23
(1993) 1136–1143.
[3] Bréda N., Cochard H., Dreyer E., Granier A., Field com-
parison of transpiration, stomatal conductance and vulnerability
to cavitation of
Quercus petraea and Quercus robur under
water stress, Ann. Sci. For. 50 (1993) 571–582.
[4] Bréda N., Granier A., Barataud F., Moyne C., Soil water
dynamics in an oak stand. I. Soil moisture, water potentials and
water uptake by roots, Plant and Soil 172 (1995) 17–27.
[5] Cienciala E., Lindroth A., Cermak J., Hallgren J.E.,
Kucera J., Assessment of transpiration estimates for
Picea abies
trees during a growing season, Trees - Structure and Function 6
(1992) 121–127.
[6] Dolman A.J., van Den Burg G.J., Stomatal behaviour in
an oak canopy, Agric. For. Meteorol. 43 (1988) 99–108.
[7] Gash J.H.C., Shuttleworth W.J., Lloyd C.R., André J.C.,
Goutorbe J.P., Gelpe J., Micrometeorological measurements in
Les Landes forest during HAPEX-MOBILHY, Agric. For.
Meteorol. 43 (1989) 131–147.
[8] Granier A., Une nouvelle méthode pour la mesure du flux
de sève brute dans le tronc des arbres, Ann. Sci. For. 42 (1985)
193–200.
[9] Granier A., Evaluation of transpiration in a Douglas-fir
stand by means of sap flow measurements, Tree Physiol. 3
(1987) 309–320.
[10] Granier A., Biron P., Bréda N., Pontailler J Y., Saugier
B., Transpiration of trees and forest stands: short and long-term
monitoring using sapflow methods, Global Change Biology
(1996) 265–274.
[11] Granier A., Biron P., Köstner B., Gay L.W., Najjar G.,
Comparisons of xylem sap flow and water vapour flux at the
stand level and derivation of canopy conductance for Scots pine,
Theor. Appl. Climat. 53 (1996) 115–122.
[12] Granier A., Bréda N., Biron, P., Villette S., A lumped
water balance model to evaluate duration and intensity of
drought constraints in forest stands, Ecol. Modelling 116 (1999)
269–283.
[13] Granier A., Biron P., Lemoine D., Water balance, tran-
spiration and canopy conductance in two beech stands, Agric.
For. Meteorol. 100 (2000) 291–308.
[14] Granier A., Bobay V., Gash J.H.C., Gelpe J., Saugier B.,
Shuttleworth W.J., Vapour flux density and transpiration rate
comparisons in a stand of Maritime Pine (
Pinus pinaster Ait.) in
Les Landes forest, Agric. For. Meteorol. 51 (1990) 309–319.
[15] Granier A., Bréda N., Modelling canopy conductance
and stand transpiration of an oak forest from sap flow measure-
ments, Ann. Sci. For. 53 (1996) 537–546.
[16] Granier A., Huc R., Barigah S.T., Transpiration of nat-
ural rain forest and its dependence on climatic factors, Agric.
For. Meteorol. 78 (1996) 19–29.
[17] Granier A., Huc R., Colin F., Transpiration and stomatal
conductance of two rain forest species growing in plantations
(
Simarouba amara and Goupia glabra) in French Guyana, Ann.
Sci. For. 49 (1992) 17–24
[18] Granier A., Loustau D., Measuring and modelling the
transpiration of a maritime pine canopy from sap-flow data,
Agric. For. Meteorol. 71 (1994) 61–81.
[19] Herbst M., Stomatal behaviour in a beech canopy: An
analysis of Bowen ratio measurements compared with porome-
ter data, Plant Cell Environ. 18 (1995) 1010–1018.
[20] Herzog K.M., Häsler R., Thum R., Diurnal changes in
the radius of a subalpine Norway spruce stem: their relation to
A model of forest canopy conductance
765
the sap flow and their use to estimate transpiration, Trees -
Structure and Function, 10 (1995) 94–101.
[21] Hinckley T.M., Brooks J.R., Cermark J., Ceulemans R.,
Kucera J., Meinzer F.C., Roberts D.A., Water flux in a hybrid
poplar stand, Tree Physiol. 14 (1994) 1005–1018.
[22] Jarvis P.G., Water Transfer in Plants, in: de Vries D.A.
and Afgan N.G. (Eds.), Heat and Mass Transfer in the Plant
Environment, Part 1, Scripta Book Co., Washington D.C., 1975,
pp. 369–374.
[23] Jarvis P.G., The interpretation of the variations in leaf
water potential and stomatal conductance found in canopies in
the field. Phil. Trans. R. Soc. Lond. ser. B 273 (1976) 593–610.
[24] Jarvis P.G., McNaughton K.G., Stomatal control of
transpiration: scaling up from leaf to region. Advances in eco-
logical Research, Academic Press, London 15 (1986) 1–49.
[25] Kelliher F.M., Black T.A., Price D.T., Estimating the
effects of undestory removal from a Douglas-fir forest using a
two-layer canopy evapotranspiration model, Water Resour. Res.
22 (1986) 1891–99.
[26] Kelliher F.M., Leuning, R., Schulze, E.D Evaporation
and canopy characteristics of coniferous forests and grasslands
- Review, Oecologia 95 (1993) 153–163.
[27] Köstner B., Biron P., Siegwolf R., Granier A Estimates
of water vapor flux and canopy conductance of Scots pine at the
tree level utilizing different xylem sap flow methods, Theor.
Appl. Climat. 53 (1996) 105–113.
[28] Köstner B., Granier A., Cermák J., Sap flow measure-
ments in forest stands - methods and uncertainties, Ann. Sci.
For. 55 (1998) 13–27.
[29] Leverenz J.W., Deans J.D, Ford E.D., Jarvis P.G., Milne
R., Whitehead D., Systematic spatial variation of stomatal con-
ductance in a Sitka spruce plantation, J. Appl. Ecol. 19 (1982)
835–851.
[30] Loustau D., Berbigier P., Roumagnac P., Ferreira M.I.,
Pereira J.S., Arruda-Pacheco C., David J.S., Tavares R.,
Transpiration of a 64-year-old maritime pine stand in Portugal.
I: Seasonal course of water flux through maritime pine.
Oecologia 107 (1996) 33–42
[31] Loustau D., Domec J.C., Bosc A., Interpreting the vari-
ation in xylem sap flux density within the trunk of maritime pine
(
Pinus pinaster Ait.): application of a model for calculating
water flows at tree and stand levels, Ann. Sci. For. 55 (1998)
29–46.
[32] Lu P., Bréda N., Biron P., Granier A., Water relations of
adult Norway spruce trees under soil drought in the Vosges
montains: water potential, stomatal conductance and transpira-
tion, Ann. Sci. For. 52 (1995) 117–129.
[33] Martin T.A., Brown K.J., Hinckley T.M., Kucera J.,
Meinzer F.C., Sprugel D.G., Control of transpiration in a 220-
year-old
Abies amabilis forest, For. Ecol. Manage (in press).
[34] Meinzer F.C., Goldstein G., Holbrook N.M., Jackson P.,
Cavelier J., Stomatal and environmental control of transpiration
in a lowland tropical forest tree, Plant Cell Environ. 16 (1993)
428–436.
[35] Naughton K.G., Black T.A., Evapotranspiration from a
forest: A micrometeorological study, Water Resour. Res. 9
(1973) 1579–1590.
[36] Naughton K.G., Jarvis P.G., Predicting the effects of
vegetation changes on transpiration and evaporation, in:
Kozlowski T.T (Ed.), Water deficits and plant growth, Vol. VII,
Academic Press, New York, 1983, pp. 1–47.
[37] Oren R., Sperry J.S., Katul G.G., Pataki D.E., Ewers
B.E., Phillips N., Schäfer K.V.R., Survey and synthesis of intra-
and interspecific variation in stomatal sensitivity to vapour pres-
sure deficit, Plant Cell Environ. 22 (1999) 1515–1526.
[38] Ogink-Hendriks M.J., Modelling surface conductance
and transpiration of an oak forest in the Netherlands, Agric. For.
Meteorol. 74 (1995) 99–118.
[39] Raupach M.R., Finnigan J.J., “Single layer models of
evaporation from plant canopies are incorrect but useful, where-
as multilayer models are correct but useless”: discuss. Aust. J.
Plant Physiol. 15 (1988) 705–16.
[40] Roberts J., Cabral O.M.R, Aguiar L. de F., Stomatal and
boundary-layer conductances in Amazonian terra firme rain for-
est, J. Appl. Ecol. 27 (1990) 336–353.
[41] Roberts J., Cabral O.M.R., Fisch G., Molion L.C.B,
Moore C.J., Shuttleworth W.J., Transpiration from an
Amazonian rainforest calculated from stomatal conductance
measurements, Agric. For. Meteorol. 65 (1993) 175–196.
[42] Sandford A.P., Jarvis P.G., Stomatal responses to
humidity in selected conifers, Tree Physiol. 2 (1986) 89–103.
[43] Saugier B., The evapotranspiration of grasslands and
crops, C. R. Acad. Agric. Fr. 82 (1996) 133–153.
[44] Saugier B., Granier A., Pontailler J Y., Dufrêne E.,
Baldocchi D.D., Transpiration of a boreal pine forest measured
by branch bags, sapflow and micrometeorological methods,
Tree Physiol. 17 (1996) 511–519.
[45] Schulze E.D., Cermak J., Matyssek R., Penka M.,
Zimmermann R., Vasicek F., Gries W., Kucera J., Canopy tran-
spiration and water fluxes in the xylem of the trunk of
Larix and
Picea trees: a comparison of xylem flow, porometer and cuvette
measurements, Oecologia 66 (1985) 475–483.
[46] Shuttleworth W.J., Micrometeorology of temperate and
tropical forest, Phil. Trans. R. Soc. Lond., ser. B 324 (1989)
299-334.
[47] Stewart J.B., Modelling surface conductance of pine
forest, Agric. For. Meteorol. 43 (1988) 19–35.
[48] Thom A.S., Momentum, mass and heat exchange of
plant communities, in: Monteith J.L. (Ed.), Vegetation and the
atmosphere, Vol. 1, Academic Press, London, 1975.
[49] Whitehead D., Regulation of stomatal conductance and
transpiration in forest canopies, Tree Physiol. 18 (1998)
633–644.