ielts academic writing task 1
Bạn đang xem bản rút gọn của tài liệu. Xem và tải ngay bản đầy đủ của tài liệu tại đây (195.51 KB, 13 trang )
IELTS Academic Writing Task 1
The IELTS Writing Test should start at 11.45am, after the Reading Test. There
are 2 parts to the Writing Test, and you have a total of 60 minutes to complete
them.
You should spend 20 minutes doing IELTS Writing Task 1. You must write 150
words or more. You will have to describe a graph, chart, table, diagram or map.
The good news is that you can quickly learn how to write a Task 1 essay. I'll
make sure you know exactly what to do in the exam.
We'll work on these areas:
• How to structure a good Task 1 essay.
• How to decide what information to include in your description.
• The words, phrases and grammatical structures for describing graphs,
charts, tables, diagrams and maps.
By using the right techniques, you can write the kind of essay that examiners like.
IELTS Writing Task 1: avoiding common mistakes
Here's some advice to help you avoid common mistakes in IELTS writing task 1:
1. Don't copy the question for your introduction. You should paraphrase the
question (i.e. rewrite it using some different words).
2. Don't forget to separate your paragraphs clearly.
3. Don't forget to write a good summary/overview of the information. A quick
one-sentence conclusion is not good enough. I prefer to put the overview
straight after the introduction, and I try to write 2 sentences describing the
information in general. You won't get a high score if you don't write a good
overview.
4. Don't describe items separately (e.g. 2 lines on a graph). You should
always try to compare things if it is possible to do so. Instead of
describing 2 lines separately, compare the 2 lines at key points.
5. Don't try to describe every number on a chart or graph (unless there are
only a few numbers). A key skill in task 1 is being able to choose the key
information and describe or compare it well. I usually mention around 6 or
7 numbers in my main paragraphs.
6. Don't spend longer than 20 minutes on task 1. Practise spending 5
minutes on each of your 4 paragraphs. Stop yourself after 20 minutes;
remember that task 2 is worth more marks.
IELTS Writing Task 1: how to use your 20 minutes
You have 20 minutes for task 1, so try spending 5 minutes on each paragraph.
This might help you to organise your time better.
First 5 minutes
Read the question, make sure you understand the chart, write your introduction
by paraphrasing the question.
Second 5 minutes
Look at the chart and try to find 2 general points. Don't look at specific details;
look for "the big picture". Write 2 sentences summarising the information.
Final 10 minutes
Describe specific details. Try to break this part into 2 paragraphs because it looks
better. You could spend 5 minutes on each paragraph.
IELTS Writing Task I: You need a method
Method: Write 4 paragraphs so that the essay has 4 clear sections. Follow the
steps of each paragraph.
I. Introduction
II. Overview
III. Details
IV. Details
1.Introduction
– paraphrase the question.
- Rewrite the question statement by changing some of the words or maybe
changing something about the sentence order.
2.Overview
– the most noticeable features.
- Overall trend or change; highest/lowest.
3.Details – specific details.
4.Details – specific details.
Why 2 paragraphs for details?
It looks more organized. In these two paragraphs, you need to:
- Select key information.
- Include numbers.
- Make comparisons.
IELTS Writing Task 1: how to write an introduction
The introduction to an IELTS writing task 1 essay should explain what the
chart/graph shows. To do this, just paraphrase the question (rewrite it in your own
words).
Here is an example description from an IELTS Task 1 question:
The graph below shows the proportion of the population aged 65 and over
between 1940 and 2040 in three different countries.
By rewriting this description with a few changes, I can quickly create a good
introduction:
The line graph compares the percentage of people aged 65 or more in three
countries over a period of 100 years.
If you practise this technique, you will be able to write task 1 introductions very
quickly. You will be able to start the writing test quickly and confidently.
IELTS Writing Task 1: general to specific
My IELTS Writing Task 1 essays follow a "general to specific" structure.
• The introduction is the most general part of the essay; it simply tells the
reader what the graph is about.
• Then I write a paragraph about the main points or a general trend.
• Finally, I write 2 paragraphs describing specific facts or figures.
• I don't write a conclusion because I have already summarised the
information in paragraph 2.
Note : The summary/overview paragraph can be either second or at the end -
just make sure you have time to do it because it's a VERY important part of the
essay.
Look at the graph below. First, make sure you understand it. Then look for a
general trend. Finally, select specific points on the graph to describe in detail.
Paragraph1:The line graph below gives information about the variation in the
percentage of households that owned no car, one car and two or more cars in the
UK over a period of 36 years.
Paragraph2:It is clear that the proportion of families with 2 cars increased
dramatically over the period shown while the figure for families without cars
dropped considerably.
Paragraph3:In 1971, the percentages of British homes that owned two cars and
three or more cars stood at about 2% and 7% respectively. By contrast,around
45% of British families used one car compared to about 48% of families without
cars.
Paragraph4:The next twenty years saw a slight increase in the percentage of
households with three or more cars. However,the figure for families with no cars
remained stable from 1971 to 2007.During the same period, the proportion of
families with two cars rose significantly to approximately 26% whereas the figure
for those without cars dropped shaply to 25%.
IELTS Writing Task 1: the overview
A current examiner recently told me that the most common mistake in students'
task 1 essays is that there is no overview. This was also true when I was an
examiner.
So what makes a good overview? Here are a few tips:
• An overview is simply a summary of the main things you can see.
• Because the overview is so important, I recommend putting it at the
beginning of your essay, just after the introduction sentence.
• I write two overview sentences. A one-sentence overview isn't really
enough.
• Try not to include specific numbers in the overview. Save the specifics for
later paragraphs.
• Look at the 'big picture' e.g. the overall change from the first year to the
last year (if years are shown on the chart), the differences between whole
categories rather than single numbers, or the total number of stages in a
process.
Have another look at the overview paragraphs (paragraph 2) in the essays I've
written here on the site. Analyse them carefully, and practise writing your own
overviews in the same way.
IELTS Writing Task 1: comparisons
Yesterday I looked at this question with my students. When describing a line
graph:
- Do not describe each line separately.
- You must compare the figures.
Here is an example of how to compare the 4 lines for the year 1990:
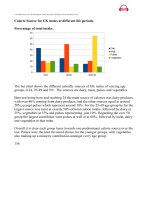
In 1990, almost 90% of 14 to 24 year olds went to the cinema at least once a
year. Cinema attendance was about 30% lower than this among people aged 25
to 34 and 35 to 49, while the figure for those aged over 50 was the lowest, at only
40%.
If you can write comparisons like this, you will get a very high score. Try using my
comparison as a model to help you compare the figures for 2010.
IELTS Writing Task 1: to, by, with, at
Several people have asked me to explain how to use to, by, with and at when
describing numbers. Here are some examples to give you a basic idea of the
differences:
1) Use to when describing what happened to the number:
In 2008, the rate of unemployment rose to 10%.
2) Use by when describing the amount of change between two numbers:
In 2009, the rate of unemployment fell by 2% (from 10% to 8%).
3) Use with to give the idea of 'having' the number:
Obama won the election with 52% of the vote.
4) Use at to add the number on the end of a sentence:
Unemployment reached its highest level in 2008, at 10%.
IELTS Writing Task 1: percentages
Here are 3 useful techniques for describing percentages:
1. English speakers usually put the percentage at the start of the sentence.
2. Use while, whereas or compared to (after a comma) to add a comparison.
3. Use "the figure for" to add another comparison in the next sentence.
Use these examples as models for your own sentences:
In 1999, 35% of British people went abroad for their holidays, while only 28% of
Australians spent their holidays in a different country. The figure for the USA
stood at 31%.
Around 40% of women in the UK had an undergraduate qualification in 1999,
compared to 37% of men. The figures for the year 2000 rose slightly to 42% and
38% respectively.
IELTS Writing Task 1: comparisons
You can use "compared to", "compared with" and "in comparison with" in the
same way. For example:
• Prices in the UK are high compared to / with / in comparison with (prices
in) Canada and Australia.
• Compared to / with / in comparison with (prices in) Canada and Australia,
prices in the UK are high.
When writing about numbers or changes, I find it easier to use "while" or
"whereas":
• There are 5 million smokers in the UK, while / whereas only 2 million
Canadians and 1 million Australians smoke.
• Between 1990 and 2000, the number of smokers in the UK decreased
dramatically, while / whereas the figures for Canada and Australia
remained the same.
Please note:
We don't say "comparing to".
We say "2 million" not "2 millions".
IELTS Writing Task 1: describing numbers
A good exercise is to choose one piece of information (a number) from a graph or
chart, and try to describe it in several different ways.
UK marriages, 1951 - 2009
Here are 5 different sentences describing the 'all marriages' figure for the year
1951 (from the graph above):
• Around 400,000 couples got married in the UK in 1951.
• Around 400,000 weddings took place in the UK in the year 1951.
• In 1951, there were around 400,000 marriages in the UK. C
• In 1951, the number of UK marriages stood at about 400,000. C
• In 1951, the figure for marriages in the UK was approximately 400,000. C
1.Describing the "first marriage" figure for the year 1951:
-Nearly 350,000 couples first married in the UK in 1951.
-The number of UK first marriages in 1951 stood at around 350,000. C
-1951 saw about 350,000 first marriages in the UK.
-There were around 350,000 UK couples getting first married in 1951. C
-The figure for first marriages in the UK was approximately 350,000 in 1951. C
2. Describing the "remarriages" figure for the year 1951:
-The number of remarriages in the UK stood just below 100,000 in 1951. C
-The figure for UK couples getting married again was around 100,000. C
-About 100,000 couples remarried in the UK in 1951.
-There were approximately 100,000 remarriages in the UK in 1951. C
-1951 saw that around 100,000 weddings which were not the first one took place
in the UK.
IELTS Writing Task 1: double, twice as, twofold
A few students have asked me about how to use 'double', 'twice as', 'three times',
'twofold', 'threefold' etc. Compare how each word/phrase is used in the following
examples:
1. 'double' (verb)
The number of unemployed people doubled between 2005 and 2009.
2. 'twice as as/compared to', 'three times as as/compared to'
There were twice as many unemployed people in 2009 as in 2005.
Twice as many people were unemployed in 2009 compared to 2005.
3. 'twofold', 'threefold' (adjective or adverb)
There was a twofold increase in the number of unemployed people between
2005 and 2009. (adjective with the noun 'increase')
The number of unemployed people increased twofold between 2005 and 2009.
(adverb with the verb 'increase')
Try using these forms in your own sentences. Make sure you follow the patterns.
Graphs: The Vocabulary of Numbers
There are some special words for numbers, fractions and
percentages.Look at the following table which shows a number in different years
(1990-1995) :
1990 1995
1200 1800
You could describe the above table using numbers, fractions orpercentages:
The number went up by 600, from 1200 to 800. (Number)
The number went up by half, from 1200 to 1800. (Fraction)
The figure went up by 50%, from 1200 to 1800. Percentage)
The figure went up 150%, to 1800. (Percentage)
1992 1994 1996 1998
500 1000 3000 12000
Use “trebled,” “-fold,” and “times:”
The number doubled between 1992 and 1994.
The number trebled between 1994 and 1996.
The figure quadrupled from 1996 to 1998
There was a twofold increase between 1992 and 1994.
The figure went up sixfold between 1992 and 1996.
The figure in 1996 was three times the 1992 figure.
The figure in 1998 was four times the 1996 figure.
1992 1994 1996 1998
1000 800 400 100
Use Fractions:
Between 1992 and 1994, the figure fell by one-fifth.
Between 1994 and 1996, the number dropped by a half.
The figure in 1998 was one-tenth the 1992 total.
IELTS Writing Task 1: how to start sentences
Probably the most important skill for task 1 is to be able to describe numbers
correctly. Look at the table below.
It's useful to think about how to start your sentences. For example, here are
some sentences about the year 1970:
1) 60 million tonnes of goods were transported by road.
2) The amount of goods transported by road totalled 60 million tonnes.
3) Road vehicles were used to transport 60 million tonnes of goods.
You should notice that it's much easier to begin with the number (sentence 1).
This is how I usually prefer to write sentences for task 1.
Number 2 is good, but you might find that you repeat "the amount of goods" too
many times if you only use this type of sentence.
IELTS Writing Task 1: how to describe future years
Several people have asked me how to write about future years on a graph or
chart. For example, what tense should you use if the graph shows the year
2025?
Try this exercise: take a description of past years, and rewrite it with future years.
Past:
In 1999, the proportion of people using the Internet in the USA was about 20%.
The figures for Canada and Mexico were lower, at about 10% and 5%
respectively. In 2005, Internet usage in both the USA and Canada rose to around
70% of the population, while the figure for Mexico reached just over 25%.
Future (I've changed the years and the verbs):
In 2015, the proportion of people using the Internet in the USA is expected to
beabout 20%. The figures for Canada and Mexico are likely to be lower, at about
10% and 5% respectively. In 2025, it is predicted that Internet usage in both the
USA and Canada will rise to around 70% of the population, while the figure for
Mexico should reach just over 25%.
IELTS Writing Task 1: ten sentences
One way to practise for writing task 1 is to think in terms of sentences rather than
worrying about the full essay. Just take a chart or graph and try to write 10
sentences about it.
Try writing the ten sentences suggested below about last week's chart.
1. State what the chart shows.
2. Make a general comparison between the South and the North.
3. Contrast London with the North East (without giving the figures).
4. Give the overall figure for England.
5. Give the figure for London and compare it with the average for England.
6. Add that figures for the South East, East and South West were also higher
than the country average.
7. Give approximate figures for the three regions above.
8. Describe the similar figures for the West Midlands, North West and East
Midlands.
9. Give figures for the North East, Yorkshire and the Humber.
10.Compare figures for the North East, national average and London.
IELTS Grammar: using 'see' in writing task 1
A few people have asked me about using 'see' to describe numbers on a graph
or chart. Look at the following sentence:
• In Britain, CD sales increased dramatically in the 1980s.
We can write the same sentence in various ways using 'see':
• Britain saw a dramatic increase in CD sales in the 1980s.
• The 1980s saw a dramatic increase in CD sales in Britain.
• British shops saw CD sales increase dramatically in the 1980s.
IELTS Writing Task 1: nouns and verbs
When describing changes I prefer to avoid words
like soar, rocket and plummetbecause they are too "sensationalist" - they
exaggerate too much, and are more journalistic than academic in style.
Instead, we can demonstrate good control of grammar by using words
likeincrease, rise and fall as both nouns and verbs:
- London saw a significant increase in the cost of homes. (noun)
- The cost of homes in London increased significantly. (verb)
- There was a rise in house prices between 1990 and 1995. (noun)
- House prices rose between 1990 and 1995. (verb)
- There was a 7% fall in the average house price in Tokyo. (noun)
- The average Tokyo house price fell by 7%. (verb)
IELTS Writing Task 1: more than one chart
How do you answer a task 1 question that has more than one chart or graph?
Here's my advice:
Introduction
Write your introduction in the usual way: paraphrase the question. For this kind of
question, it's easier to write 2 sentences e.g. "The first chart illustrates The
second chart shows "
Summary
Write a paragraph describing the main points. If possible, try to summarise all of
the information, rather than writing a separate summary for each chart. Look for a
topic or trend that links the charts.
Details
Describe each chart separately. Just write a short paragraph about each chart.
Choose the most important information from each one.
IELTS Writing Task 1: more than one chart
Many students are still worried about questions with more than one chart.
Here are some tips:
1. If there are 2 charts, they often show different information. Don't worry
about comparing them. Just do: introduction, overview, then one
paragraph for each chart.
2. If the units are different (e.g. one chart shows 'millions' and the other
shows 'percentages'), you can't usually compare them.
3. If the units are the same, you can probably compare the charts.
4. If there are 3 or 4 charts, you can usually compare them.
To see an essay about 2 different charts click here (Cambridge IELTS 6, p98).
To see an essay about 4 related charts click here (Cambridge IELTS 7, p101).
IELTS Writing Task 1: describing 2 charts
Here are some tips for writing about 2 charts, graphs or tables:
1. Introduction
Write one sentence, but introduce each chart separately e.g. "The first bar chart
shows , and the second chart illustrates "
2. Summary of main points
Write 2 sentences. If the information in the charts is not connected, find one main
point or general trend for each chart. If the charts are connected, try to make
comparisons.
3. Main body paragraphs
If the 2 charts are completely different (e.g. a graph and a table), write a separate
paragraph about each.
If the charts are the same, and show the same information (e.g. 2 pie charts),
don't describe them separately; the examiner will want to see comparisons. In
this case, you could write one paragraph describing all of the information, but I
still prefer to write 2 paragraphs because it makes the essay look more
organised.
IELTS Writing Task 1: introduction for 2 charts
You might find it easier to introduce two different charts by writing two separate
sentences.
Here is an example question about a graph and bar chart:
The charts below give information about travel to and from the UK, and about the
most popular countries for UK residents to visit.
Here is my 2-sentence introduction:
The graph shows numbers of visits to the UK and trips abroad by UK residents.
The bar chart shows the five most popular destinations for UK travellers.