Báo cáo y học: "Does eGFR improve the diagnostic capability of S-Creatinine concentration results? A retrospective population based study" ppsx
Bạn đang xem bản rút gọn của tài liệu. Xem và tải ngay bản đầy đủ của tài liệu tại đây (448.05 KB, 9 trang )
Int. J. Med. Sci. 2008, 5
9
International Journal of Medical Sciences
ISSN 1449-1907 www.medsci.org 2008 5(1):9-17
© Ivyspring International Publisher. All rights reserved
Research Paper
Does eGFR improve the diagnostic capability of S-Creatinine concentration
results? A retrospective population based study
Anders Kallner
1
, Peter A Ayling
2
, Zahra Khatami
2
1. Department of Clinical Chemistry, Karolinska University Hospital, SE 17176, Stockholm, Sweden
2. Department of Biochemistry, Queen’s Hospital, Romford, Essex, RM70AG UK
Correspondence to: Anders Kallner, Associate Professor, MD, PhD, Phone +46 8 5177 4943; Fax +46 8 5177 2899; e-mail:
Received: 2007.11.14; Accepted: 2008.01.03; Published: 2008.01.05
The use of MDRD-eGFR to diagnose Chronic Kidney Disease (CKD) is based on the assumption that the
algorithm will minimize the influence of age, gender and ethnicity that is observed in S-Creatinine concentration
and thus allow a single cut-off at which further diagnostic and therapeutic actions should be considered. This
hypothesis is tested in a retrospective analysis of outpatients (N=93,404) and hospitalised (N=35,572) patients in
UK and Sweden, respectively. An algorithm based on the same model as the MDRD-eGFR algorithm was derived
from simultaneously measured S-Creatinine concentrations and Iohexol GFR in a subset of 565 patients. The
combined uncertainty of using this algorithm was estimated to about 15 % which is about three times that of the
S-Creatinine concentration results. The diagnostic performance of S-Creatinine concentration was evaluated
using the Iohexol clearance as the reference procedure. It was shown that the diagnostic capacity of MDRD-eGFR,
as it stands, has no added value compared to S-Creatinine. The gender and age differences of the S-Creatinine
concentrations in the dataset persist after applying the MDRD-eGFR algorithm. Thus, a general use of the
MDRD-eGFR does not seem justified. Furthermore the claim that the eGFR is adjusted for body area is
misleading; the algorithm does not include any body size marker. It is thus a dangerous marker for guiding drug
administration.
Key words: CKD, Diagnosis, algorithm, outpatients, inpatients
Introduction
Measurement of the S-Creatinine concentration
1
is one of the most frequently requested tests in the
biochemistry laboratory. Most of the requests may not
necessarily be related to chronic kidney disease or a
specific investigation of renal function [1,2]. Never the
less, health authorities in several countries have ruled
that each S-Creatinine result shall be accompanied by a
quantity that is calculated from the S-Creatinine, the
age and, if applicable, modified for gender (female)
and ethnicity (Afro-American). This quantity is called
eGFR
2
; (estimated glomerular filtration rate). The most
frequently used algorithm is the 4-parameter MDRD
algorithm [3,4,5]. It has been reported that this data
1
A note on terminology: The quantity measured is S-Creatinine;
amount of substance concentration. In the text this is abbreviated to
S-Creatinine.
2
Abbreviations: S-Creatinine: S—Creatinine; amount of substance
concentration (µmol/L). Pt-Iohexol: Patient—Iohexol elimination;
rate mL/(min x 1.73 m
2
). MDRD-eGFR estimated Glomerular
Filtration Rate using the 4-parameter MDRD equation. eGFR II
estimated Glomerular Filtration Rate using the presently derived
equation. LIS: Laboratory Information System.
transformation enhances the diagnosis of chronic
kidney disease (CKD) as a surrogate marker for
glomerular filtration rate and is superior to
S-Creatinine. It is further suggested that the algorithm
allows a single cut-off value for the diagnosis of CKD,
particularly stage III [4]. Considering the physiological
age and gender changes of S-Creatinine the algorithm
therefore needs to neutralize these effects.
To validate this hypothesis we present a
retrospective study in which we apply the
MDRD-eGFR algorithm to results from primary health
care in the United Kingdom (UK) and hospitalized
patients in Sweden (SE). We also derived a 4-term
algorithm based on the same model as the MDRD
algorithm using simultaneously measured
S-Creatinine and Iohexol GFR. The present study thus
focuses on a comparison of the diagnostic performance
of eGFR and S-Creatinine, estimating the uncertainty
of the eGFR and testing the transferability of the eGFR
between sites.
Int. J. Med. Sci. 2008, 5
10
Methods and materials
Database
Data from UK included all S-Creatinine results
from the primary care of the BHR NHS trust (Essex)
during 2005 (women 49,169, men 44,235). Data from SE
included all S-Creatinine results from inpatients of the
Karolinska University Hospital (KS) in Stockholm
(women 14,124, men 21,648) during a one year period.
Results from patients above 19 years with
S-Creatinine between 70 µmol/L and 200 µmol/L were
partitioned according to gender and age (Table 1 and
Figure 1). The age was calculated from the year of birth
to the year of sampling, irrespective of dates of birth or
sampling. The population in neither of the catchment
areas allowed singling out a group of African origin
and no record of ethnicity, was registered in the
databases.
Results from all patients in whom S-Creatinine
and Pt-Glomerular filtration rate (Pt-Iohexol) were
measured on the same day were obtained from the LIS
of KS and those fulfilling the inclusion criteria chosen
(N=565). Results were partitioned according to age
and gender (Table 1).
Since all tags that could uniquely identify a
patient were removed – only age and gender were
retained – the study did not require permission from
the Ethics committees.
60
70
80
90
100
110
120
130
140
20-29 30-39 40-49 50-59 60-69 70-79 80-
S-Creatinine, µmol/L
Age groups
S-Creatinine
,
UK
Females
Males
35
45
55
65
75
85
95
105
115
20-29 30-39 40-49 50-59 60-69 70-79 80-
MDRD arb units
Age grops
MDRD-eGFR, UK
60
70
80
90
100
110
120
130
140
20-29 30-39 40-49 50-59 60-69 70-79 80-89 90-
S-Creatinine, µmol/L
Age groups
S-Creatinine, SE
35
45
55
65
75
85
95
105
115
20-29 30-39 40-49 50-59 60-69 70-79 80-89 90-
MDRD
Age groups
MDRD-eGFR, SE
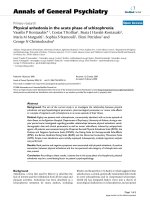
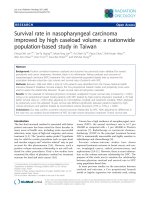
Figure 1. The age-dependent changes of S-Creatinine and MDRD-eGFR for females and males in the Swedish and United Kingdom
cohorts. Triangles represent females, diamonds males.
Int. J. Med. Sci. 2008, 5
11
Table 1 Partitioning of data. Group concentrations and e-GFR values are given as medians and the 25 – 75 percentile interval.
Age
group
Number Crea
conc
Interval Abs
Diff
Rel
conc
MDRD-eGFRIntervalAbs
Diff
Rel
value
Num
ber
Crea
conc
IntervalAbs
Diff
Rel
conc
MDRD-eGFR Interval Abs
Diff
Rel
value
Iohexol
Number
20-29 485 76 72-82 100 87 79-91 110 3087 78 74-84 100 83 76-89 155 13
30-39 830 77 72-84 1 101 79 71-85 -8 107 4814 78 74-84 0 93 77 71-82 -6 144 20
40-49 956 78 73-87 2 103 74 65-79 -5 106 7340 79 75-85 1 94 72 67-78 -5 135 23
50-59 1763 78 73-88 0 103 70 61-76 -4 106 8972 81 76-87 2 96 68 62-73 -5 127 57
60-69 2436 80 74-93 2 105 66 56-73 -4 112 9541 83 77-91 2 99 63 57-69 -4 119 43
70-79 2991 86 76-104 6 113 59 48-68 -7 107 9930 87 79-97 4 104 59 52-65 -5 109 47
80-89 3698 90 79-111 4 118 55 43-64 -4 100 5495 92 82-106 5 110 54 46-61 -5 100 34
90- 966 98 83-123 8 129 49 37-59 -6 86 5
Females SE
14125
Females UK
49179 322
20-29 908 83 76-91 100 103 93-115 107 1902 93 87-100 100 91 83-99 154 20
30-39 1447 84 77-93 1 101 96 88-106 -7 107 4127 94 88-102 1 101 84 77-91 -7 142 25
40-49 2075 85 78-94 1 102 90 80-100 -6 105 7444 95 88-103 1 102 79 72-86 -5 134 31
50-59 3417 86 78-97 1 104 86 74-95 -4 108 9852 96 88-104 1 103 75 68-82 -4 127 62
60-69 5171 88 79-102 2 106 80 68-91 -6 113 9649 98 90-108 2 105 71 63-78 -4 119 72
70-79 4541 96 83-118 8 116 71 56-84 -9 113 8093 104 94-116 6 112 65 57-73 -6 109 80
80-89 3588 104 88-130 8 125 63 48-76 -8 100 3294 110 97-126 6 118 59 50-69 -6 100 27
90- 501 114 91-143 10 137 56 43-72 -7 89 5
Males SE
21648
Males UK
44361 242
Total 35773 93540 564
Analytical
Creatinine
SE. S-Creatinine were measured using Beckman
LX20 instruments, calibrators and reagents with a
modified kinetic Jaffe method. The system was
monitored by routine IQC procedures and
participation in Equalis EQA system. The laboratory
reports a measurement uncertainty of 5 % (k=1, i.e. 1
SD) over the entire reporting interval. The laboratory
was accredited according to the EN/ISO 15189.
UK. S-Creatinine were measured using Olympus
640 analysers. Reagents and calibrators for a modified
kinetic Jaffe method were obtained from Olympus
Diagnostics Ltd UK. The quality of results was
monitored through-out the period by IQC (Randox
Laboratories Ltd, Ireland) procedures and
participation in UK NEQAS. The laboratory reports a
measurement uncertainty of 5 %. The laboratory was
accredited according to CPA (UK).
Since there is no prerequisite in the guidelines
that laboratories shall have harmonized their results
beyond using a traceable calibrator to abide by the
recommended cut-off the acceptance by the EQAS was
regarded as sufficient to disregard any bias.
Iohexol clearance (Pt-Iohexol)
Omnipaque®, 5 mL, was injected intravenously
to fasting, well hydrated patients. Samples were
drawn before and at 230-240 minutes after the
injection. The Iohexol concentration was measured by
HPLC on a C
18
column (Zorbax SB-18, Chromtech,
USA) eluted with Methanol/phosphoric acid and
assayed using Waters 2487 absorbance detector and
2795 Separation Module. The system was calibrated
with Iohexol dissolved in control serum (Autonorm,
Sero AS, Oslo, Norway). Iopamiro (Astra Zeneca,
Södertälje, Sweden) was used as internal standard (IS).
Typically, the IS was eluted twice as fast as Iohexol and
baseline separation was achieved. Measurement
uncertainty was 3.2 %. The chromatograms were
digitized and the Iohexol clearance was estimated
using a one-point method [5,6].
Calculation of MDRD-eGFR and nonlinear fitting
The eGFR of the UK and SE results were
calculated using the 4 variable version [4] of the
MDRD equation. Since UK and SE express
S-Creatinine in µmol/L the conversion factor 1/88.4
was incorporated in the original MDRD formula to
allow direct use of S-Creatinine expressed in µmol/L.
The S-Creatinine, age and gender were fitted to
Int. J. Med. Sci. 2008, 5
12
the measured Pt-Iohexol obtained from the SE results;
the data set is specified in table 2. The
Marquardt-Levenberg iterative algorithm that is
available in SigmaStat was used to model the
algorithm similar to the MDRD-eGFR algorithm The
‘constants’ derived for the males were fitted, together
with a variable factor, to the female Pt-Iohexol values.
Thus, an algorithm was derived with an ‘if female’
factor of 0.82 different from 0.74 stated in the
MDRD-eGFR algorithm.
It is reasonable to assume that the fitting is less
accurate at the extremes of the measuring interval.
Table 2. Specifications of the cohorts used to derive the eGFR II
algorithm. Pt-Iohexol in mL/(min x 1.73 m
2
)
Men Women
Number 323 242
Age median 63 62
25% percentile 50,8 52
75% percentile 73 75,
Pt Iohexol median 63 52
25% percentile 48 36
75% percentile 78 71
Pt Iohexol Max 136 120
Pt-Iohexol Min 16 15
ROC analysis
Using the SE database of Pt-Iohexol as reference,
the clinical sensitivity, specificity and likelihood ratios
were calculated for a threshold cut-off of 60 mL/(min x
1.73 m
2
)
for the MDRD-eGFR and 95 and 115 µmol/L
for S-Creatinine in women and men, respectively
(equating to the upper limits of the reference intervals
recommended by the laboratory at the time of the
study. It should be pointed out, however, that the
reference values of the laboratory are just reference
values estimated as the mean + 2SD of the reference
population and not meant as action limits).
Statistics
The databases and graphs were created with
Microsoft EXCEL. As appropriate, JMP v 5.1 (SAS
Institute, Cary NC, USA) and SigmaPlot/Sigmastat v
10 and 3, respectively (Systat Software, GmbH,
Erkrath, Germany) were used. Normality was tested
by the Kolmogorov-Smirnov test. Comparisons
between results were evaluated using the
Mann-Whitney rank sum test.
Results
Differences between age groups for S-Creatinine
and MDRD-eGFR results in men and women were
evaluated by the Kruskal-Wallis “one-way ANOVA by
rank” followed by the Dunn’s multiple comparison
procedure. All comparisons of the MDRD results
showed a significant difference between age groups
whereas the S-Creatinine in the three lowest age
groups was not significantly different in the SE cohort
nor the two lowest in the UK cohort (Figure 1).
The difference between the creatinine results
obtained in the UK and SE is small for women but
about 10 µmol/L for men (Table 1).
The medians of S-Creatinine were significantly
different between the genders and this difference was
retained in the MDRD-eGFR values (p<0.001). The
ratio of the medians of S-Creatinine and MDRD-eGFR
between women and men decreased from 0.91 for
S-Creatinine to 0.79 for MDRD-eGFR in the SE cohort
and from 0,84 for S-Creatinine to 0.72 for MDRD-eGFR
in the UK cohort. This indicates that in both cohorts the
difference between genders is increased by the
algorithm. It may be pointed out that the ratio between
the reference values of S-Creatinine for women and
men used in the laboratory (SE) was 0.82.
The derived algorithm (table 3 row 4) was
applied to the creatinine and age data from SE and UK
to calculate the “eGFR II”. The difference between the
eGFR II and the MDRD-eGFR was statistically
significant in all age groups and both cohorts except in
the highest age groups in both the SE and UK cohorts
(Table 4). The largest difference between medians of
the groups were 11 mL/(min x 1.73 m
2
) and 9
mL/(min x 1.73 m
2
), recorded in the youngest
age-groups of the UK and SE cohorts of females,
respectively. This indicates that results of the generally
recommended algorithm and a locally derived
algorithm will give different results.
Table 3. Constants and exponents obtained by non-linear fitting of S-Creatinine results to Pt-Iohexol as the dependent variable. Row
1 summarizes the original MDRD algorithm, rows 2 and 3 those obtained in the SE study, row 4 when the expression in row 2 is
adjusted to that in row 3 by introducing an ‘if female’ factor and row 5 the algorithm obtained considering both men and women.
N Constant
(Mass
units)
SEM Exp
crea
SEM Exp age SEM ’If female’ SEM R
2
Adj
1 MDRD-eGFR 1628 186 -1,154 -0,203 0,742
2 Women 242 297 53 -0.918 0.068 -0.382 0.045 0.617
3 Men 323 311 31 -0.852 0.043 -0.344 0.026 0.707
4 Women 242 311 -0.852 -0.344 0.821 0.012 0.617
5 All 565 321 33 -0.813 0.040 -0.375 0.026 0.608
Int. J. Med. Sci. 2008, 5
13
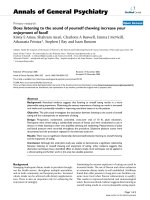
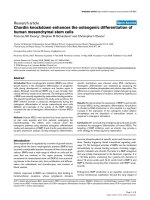
The medians in the age groups of Pt-Iohexol,
S-Creatinine and eGFR II are shown in figure 2. This
material comprised 242 females and 323 males (Table
1). For clarity the creatinine concentration is expressed
as 10,000/S-Creatinine. This figure illustrates the
parallelism between the markers.
An uncertainty budget [8] was established to
estimate the combined uncertainty of the eGFR II
calculations. S-Creatinine of 100 µmol/L equates to an
MDRD-eGFR of about 60 mL/(min x 1.73 m
2
). The
standard uncertainties of the factors and exponents
obtained in the fitting of the S-Creatinine to the
Pt-Iohexol (Table 3) were used. The uncertainty of the
creatinine results was assumed to be 5 %. The major
sources of the combined uncertainty were S-Creatinine
(7 %), the factor (321; 42 %), the derived exponent for
creatinine (-0.813; 1 %), the exponent for the age
(-0,375; 49 %) and the ‘if female’ factor (1 %). The
combined uncertainty was about 15 % resulting in an
interval of the expanded uncertainty (k=2) from 42
mL/(min x 1.73 m
2
) to 78 mL/(min x 1.73 m
2
). The
statistically significant minimal difference between
observations (reference difference) at a calculated
MDRD-eGFR of 60 mL/(min x 1.73 m
2
) is thus
()
13215.060 ×≈×××=Δ zz
sign
mL/(min x 1.73
m
2
). [9]
At a level of confidence of 95 %, z = 2 and the
minimal significant difference between two
observations is thus about 26 mL/(min x 1.73 m
2
) or 43
% of the decision value. The corresponding minimal
difference between S-Creatinine observations is about
14 µmol/L (14 %)
()
72205.01002 ×≈×××=Δ
sign
µmol/L
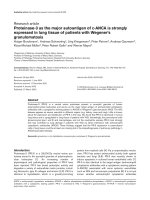
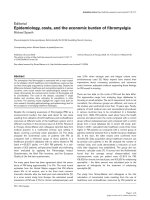
ROC curves were calculated (Figure 3) for the
S-Creatinine and eGFR. At the suggested cut-offs,
Pt-Iohexol of 60 mL/(min x 1.73 m
2
) and S-Creatinine
95 and 115 µmol/L (the upper reference limits of the
laboratory), respectively, the likelihood ratio (LR) was
4.4, 3.6, 1.7 and 3.1 for S-Creatinine in men and women
and MDRD-eGFR, respectively. The z-scores adjusted
with Yates correction indicate a difference in favor of
S-Creatinine between the LR of S-Creatinine and
eGFR. This difference is statistically significant for men
but not for women (z=2.2 and 1.4, respectively).
20
40
60
80
100
120
140
20-29 30-39 40-49 50-59 60-69 70-79 80-89 90-
Pt-Iohexol,eGFR and 10,000/S-Creatinine
Age groups
EGFR II
Iohexo l
10,000/S-Creatinine
20
40
60
80
100
120
140
20-29 30-39 40-49 50-59 60-69 70-79 80-89 90-
Pt-Iohexol,eGFR and 10,000/S-Creatinine
Age grops
Figure 2. From top to bottom the inverse S-Creatinine (10000/S-Creatinine, filled triangles), Pt-Iohexol (filled diamonds, solid line)
and eGFR II (filled squares) of the SE Iohexol data set (women in the right panel).
Int. J. Med. Sci. 2008, 5
14
0,3
0,5
0,7
0,9
0 0,2 0,4 0,6 0,8 1
1-Specificity
Sensitivity
0,3
0,5
0,7
0,9
0 0,2 0,4 0,6 0,8 1
1-Specificity
Sensitivity
Figure 3. Partial ROC curves. The left panel is based on 342 men, the right on 242 women. Squares refer to S-Creatinine and
diamonds to eGFR II. Open symbols refer to the predetermined reference limits and cut-offs.
Discussion
A recent study reported the performance of
MDRD-eGFR in relation to measured GFR in a large
diverse population [10]. The present study focuses on
how the MDRD-eGFR performs in similar cohorts in
relation to S-Creatinine which is the primary,
measured quantity. This relation has been poorly
studied but two independent studies were recently
published [11,12].
Traditionally the kidney function has been
estimated by the glomerular function through
“creatinine clearance” although this procedure has
long been questioned [13]. Major reasons for the
concern are that creatinine is continuously generated;
it is secreted and reabsorbed from the tubules and
excreted by the intestine. In particular the practical
problems with urine collection are difficult to avoid.
S-Creatinine varies with age, muscle mass, diet and
exercise and differs between genders. Other estimates
of GFR have been based on exogenous substances e.g.
Inulin and Iohexol. Analytically, the much used Jaffe
method is liable to interferences by both endogenous,
e.g. ketone bodies, and exogenous substances e.g.
certain drugs. The use of a kinetic modification of the
Jaffe assay has diminished these problems. Enzymatic
methods, HPLC methods and ID-MS methods are
available but may be too costly for routine application
in most laboratories.
The calibration of S-Creatinine measurements has
been a major concern [14] and a special factor in the
MDRD-eGFR algorithm has been derived for
calibrators that have been assayed by ID-MS [15].
Different MDRD-eGFR algorithms are thus in use. This
will cause an indirect additional increase of the
interlaboratory uncertainty of the eGFR [16]. The
trueness of measurements is an often neglected
problem in formulating common cutoff values,
set-point values or recommendations. Myers et al. [14]
concluded that “even if the imprecision is low and the
assay is standardized to an ID-MS reference measurement
procedure, if analytical non-specificity bias remains, then
errors in estimated GFR for individual patients will
occur”.
Although the uncertainty contribution by
S-Creatinine is small this does not mean that changes
in the calibration of S-Creatinine can be disregarded.
Accredited laboratories participate in External
Quality Assessment Schemes (EQAS) or Proficiency
Testing (PT) that are designed to assess the trueness of
measurements. The only measurement in eGFR is
creatinine; therefore EQAS will only evaluate the
measurement of creatinine, not the calculated quantity.
The analytical “sensitivity” of S-Creatinine is
slightly larger than that for MDRD-eGFR, thus if
S-Creatinine changes from 90 to 115 µmol/L, i.e. 25
units, then the MDRD-eGFR will decrease from 82 to
61 mL/(min x 1.73 m
2
), i.e. 21 units.
Estimated glomerular filtration rate, eGFR, is
claimed to eliminate some of the disadvantages of
S-Creatinine and ‘creatinine clearance’. Many
algorithms for eGFR include e.g. S-Albumin, S-Urea,
and patient weight. Thorough evaluations and
comparisons have been published with extensive
accounts of kidney function [3,4,5] including a healthy
cohort [17,18]. The professions have favored the
4-parameter MDRD [4] algorithm that is based on only
S-Creatinine, the patient’s age, gender and ethnicity. It
can be described as the reciprocal of S-Creatinine
enhanced by multiplying with the reciprocal of the age
and, if appropriate, adjusted by a factor for the gender
and ethnicity. An additional factor adjusts the result
numerically to the order of magnitude of Pt-Iohexol.
The unit embedded in this factor (mL/(min x 1.73 m
2
)
Int. J. Med. Sci. 2008, 5
15
formally adjusts the dimension of the calculated
number to that of clearance. The algorithm does not
include any reference to the size (body area) of the
actual patient. As a result a 2 m and 100 kg and a 165 m
50 kg individual of the same age and S-Creatinine
would have the same MDRD-eGFR expressed in
mL/(min x 1.73 m
2
). It is important to understand that
the regression function may hold true on a population
basis but not in an individual. The use of eGFR in the
individual case, after due adjustment for the body size,
may therefore still be misleading in adjusting the
dosage of drugs. An unexplored factor may be the
know anthropometrical differences between
Americans and others. This is an additional source of
uncertainty in the use of MDRD-eGFR.
Only one cut-off value for MDRD-eGFR of 60
mL/(min x 1.73 m
2
) (CKD stage III) is recommended
by the NKDEP [4], for all ages and both sexes, below
which additional investigations of the kidney function
should be initiated. Thus the NKDEP assumes that the
physiological changes of S-Creatinine by age and
gender will be neutralized by the algorithm. Our
results unequivocally show that this is not the case
(Figure 1). The age dependency of MDRD-eGFR was at
least of the same order of magnitude as that of
S-Creatinine. Similar results, a decrease of about 7 %
per decade were recently reported [19]. The K/DOQI
report [3] suggests a decrease in the GFR with about 1
mL/min per year of age above 20 years. Our data
shows that this is not eliminated by the MDRD-eGFR.
Thus a common cut-off is not applicable to all ages.
The K/DOQI report further suggests 8 % lower
GFR [3] values in women than in men but the original
MDRD-eGFR algorithm suggests a factor of 0.741. Our
Iohexol study gives a factor of 0.82 ± 0.01 (SEM) which
is also lower than that expected from the DOQI report
(0,92). The difference in the ratio between females and
males of S-Creatinine (0,91) and MDRD (0,79) shows
that the gender dependence of the markers increases in
the MDRD-eGFR rather than being reduced or
eliminated.
The difference in S-Creatinine between the SE
and UK cohorts can in part be due to the difference in
the patient types. Considering the equality between
the results obtained in SE and UK women it is less
likely that the difference is due to measurement bias.
The problem of trueness will necessarily be aggravated by
introduction of an algorithm in which constants and
exponents have been derived at a location other than that
in which it is used. The algorithms estimated in the
present study were established by fitting data to the
same model as the original MDRD-eGFR and the
resulting coefficients and exponents are different
(Table 3) – but the difference in calculated results are
not clinically important (Table 4) between adjacent age
groups in view of the uncertainty attached to the
MDRD-eGFR results. Also, the large cohorts enhance
the statistical significance that may not be of the same
importance in clinical practice. Therefore, the
algorithms seem reasonably transferable between
populations at least in the reporting interval and
excluding the lowest and highest age group.
Table 4. Medians of eGFR II and difference to the corresponding MDRD-eGFR values (Table 1). Medians and differences are
expressed in mL/(min x 1.73 m
2
). Non-significant differences in bold.
Age-group Males Females Males Females
SE Median Difference Median Difference UK Median Difference Median Difference
21-30 95.9 9.2 108.4 4.1 94.2 11.0 98.0 6.9
31-40 85.1 5.8 95.4 -0.2 83.5 6.4 86.8 3.0
41-50 76.8 2.8 86.8 -3.1 75.9 3.5 78.9 -0.10
51-60 71.2 0.8 80.3 -5.4 69.3 1.6 73.0 -1.9
61-70 66.0 -0.4 74.6 -5.8 64.1 0.7 67.7 -2.9
71-80 59.3 -0.2 65.8 -4.9 58.7 0.2 61.9 -2.8
81+ 54.4 -0.3 58.8 -3.7 53.7 0.2 56.5 -2.6
90+ 48.9 0.3 52.7 -2.6
The course of changes of S-Creatinine, Pt-Iohexol
and eGFR II over the studied ages is shown in figure 2.
The changes in Pt-Iohexol and inverted S-Creatinine
follow each other closely as does the eGFR II. The
conversion of the S-Creatinine by any of the algorithms
we tested does thus not contribute to a more effective
understanding of the kidney function.
The uncertainty of the factors and exponents of
the original MDRD-eGFR algorithm is not known to
the authors, however, data from the present study
(Table 3), provides an estimate of the combined
uncertainty of 15 % for the results of the eGFR II. This
may be applicable to the original MDRD-eGFR and
Int. J. Med. Sci. 2008, 5
16
indicates an expanded uncertainty of about 20
mL/(min x 1.73 m
2
) (k=2) at S-Creatinine 100 µmol/L,
equating to an eGFR level of about 60 mL/(min x 1.73
m
2
). It is interesting to note that the variation that is
claimed acceptable by the K/DOQI [10] at
MDRD-eGFR 60 mL/(min x 1.73 m
2
), is 42-78 mL/(min
x 1.73 m
2
) which is compatible with our uncertainty
calculations (40-80 mL/(min x 1.73 m
2
)). Since the
calculated uncertainty corresponds to an
intralaboratory uncertainty it is an underestimate of
the interlaboratory uncertainty that should be the basis
for a recommendation. The uncertainty of S-Creatinine
is about 14 µmol/L or one third.
Therefore the use of MDRD-eGFR in diagnosis
may be misleading and the large uncertainty is a
disadvantage in monitoring.
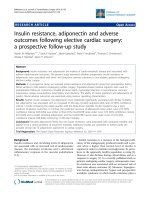
The ROC data (Figure 4) shows that S-Creatinine
and MDRD-eGFR perform similarly. S-Creatinine
results, however, are associated with a much smaller
uncertainty than the MDRD-eGFR and accordingly
will allow identifying smaller changes in the kidney
function.
35
45
55
65
75
85
95
70 90 110 130
MDRD-eGFR mL/(min x 1.73 m2
S-Creatinine, µmol/L
Figure 4. Relation between MDRD-eGFR (mL/(min x 1.73
m
2
)) and S-Creatinine (µmol/L). Curves represent (from upper)
ages 20, 50 and 80 years. Females to the left. Vertical dashed
lines are suggested creatinine cut-offs. The shaded area
represents the uncertainty of the MDRD-eGFR based on the
present study.
Many authors claim that S-Creatinine is a poor
marker for glomerular filtration rate [20]. It is therefore
an intriguing thought that a simple algorithm that
essentially is based on a negative exponent (-1,154) of
S-Creatinine (equal to 0,87 at S-Creatinine 100 µmol/L)
and an age compensating factor of about 0,45 (0,54 at
20 years and 0,42 at 80 years) and a magnifying
constant factor (174-186) will drastically change the
diagnostic power of the measurand. On the contrary,
the algorithm will increase the uncertainty of the result
and thus the diagnosis. The uncertainty found in our
derived algorithm transferred to a 95 % level of
confidence (±18 mL/(min x 1.73 m
2
)) is almost equal to
the analytical goal by K/DOQI ±30 % (±18 mL/(min x
1.73 m
2
) at 60 mL/(min x 1.73 m
2
)) [10]. The
implication of this, as illustrated in figure 4 is that a
S-Creatinine cut-off of 90 µmol/L and 110 µmol/l for
females and males, respectively, would correspond to
a eGFR of 60 mL/(min x 1.73 m
2
). Measurement of
S-Creatinine is also easier to standardize than
algorithms based on regression analysis.
Conclusion
Transformation of S-Creatinine to eGFR
according to the MDRD-eGFR algorithm or a similarly
derived algorithm does not compensate for the
physiological differences between age groups and
gender. A common cut-off for additional
examinations, investigations or diagnosis does thus
not seem justified, i.e. we either have to fully
compensate for the effects of gender and age or have
different cut-offs for the different age groups and
gender. The present study does not support an
assumed advantage of factorizing S-Creatinine to
create a number that superficially resembles that of
iohexol clearance. Considering the low LR, the pretest
probability (prevalence of disease) needs to amount to
about 20 % or higher for either quantity as a single test
to be of diagnostic value.
Acknowledgements
This study was financed in full by the hospitals as
routine parts of their quality improvement efforts.
Conflict of interests
The authors have declared that no conflict of
interest exists.
References
1. Rainey PM. Automatic reporting of the estimated glomerular
Filtration Rate – Jumping the gun? Clin Chem 2006;52:2184-87.
2. Levey AS, Stevens LA, Hostetter T. Automatic reporting of
estimated glomerular filtration rate – Just what the doctor
ordered. Clin Chem 2006;52:2188-2193.
3. National Kidney Foundation. K/DOQI clinical practice
guidelines for chronic kidney disease: evaluation, classification,
and stratification. Kidney Disease Outcome Quality Initiative.
Am J Kidney Dis. 2002;39:S1-246.
4. Levey AS, Coresh J, Balk E, Kausz AT, Levin A, Steffes MW et
al National Kidney Foundation Practice Guidelines for Chronic
KidneyDisease: Evaluation, Classification, and Stratification.
Ann Intern Med 2003;139:137-47
5. Hostetter TH, Lising M. National Kidney Disease Education
Program. Am J Kidney Disease 2002;39(Suppl 1): s17-s223.
6. Eriksson C-G, Kallner A. Glomerular filtration rate: a
comparison between Cr-EDTA clearance and a single sample
technique with a non-ionic contrast agent. Clin Biochem
1991;24:261-264.
7. Brandstrom E, Grzegorczyk A, Jacobsson L, Friberg P, Lindahl
A,Aurell M. GFR measurement with iohexol and 51Cr-EDTA. A
comparison of the two favoured GFR markers in Europe
Nephrol Dial Transplant, 1998;13:1176-1182.
Int. J. Med. Sci. 2008, 5
17
8. BIPM, IEC, IFCC, ISO, IUPAC, IUPAP, OIML. Guide to the
expression of uncertainty in measurement. Geneva: ISO. 1993.
9. Fraser CG. Biological variation: From principles to practice.
Washington DC USA: AACC press. 2001.
10. Stevens LA, Coresh J, Feldman HI, el al. Evaluation of the
modification of the diet in renal disease study equation in a large
diverse population. J Am Soc Nephrol; 2007;18:2749-2757.
11. Kallner A, Ayling PA, Khatami Z. How does MDRD-eGFR
perform compared to S-Creatinine in routine healthcare? Poster
Clin Chem 2007;53(6):A119
12. Lippi G, Salvagno GL ,Guidi GC. Is estimated glomerular
filtration rate suitable for stratification of chronic kidney
disease? Scand J Clin Lab Invest. accepted for publication.
13. Payne RB. Creatinine clearance: a redundant clinical
investigation. Ann Clin Biochem 1986;23:241-250.
14. Myers GL, Miller G, Coresh J, Fleming J, Greenberg N, Greene T,
et al. for the National Kidney Disease Education Program
Laboratory Working Group Recommendations for Improving
Serum Creatinine Measurement: A Report from the Laboratory
Working Group of the National Kidney Disease Education
Program. Clin Chem 2006;52:5-18.
15. Vicerey S, Stevens PE, Dalton RN, van Lente F, Lamb EJ. Does
the ID-MS traceable MDRD equation work and is it suitable for
use with compensated Jaffe and enzymatic creatinine assays?
Nephrol Dial Transplant 2006;21:2439-45.
16. Miller JN, Miller JC. Statistics and Chemometrics for Analytical
Chemistry. Harlow, UK: Perason Education Ltd. 2005.
17. Rule AD, Larson TS, Bergstralh EJ, Slezak JM, Jacobsen SJ, Cosio
FG. Using serum creatinine to estimate glomerular filtration rate:
accuracy in good health and in chronic kidney disease. Ann
Intern Med 2004;141:929–37.
18. Lin J, Knight EL, Hogan ML, Singh AK. A comparison of
prediction equations for estimating glomerular filtration rate in
adults without kidney disease. J Am Soc Nephrol
2003;14:2573–80.
19. Khatami Z, Handley G, Narayanan K, Weaver JU. Applicability
of estimated glomerular filtration rate in stratifying chronic
kidney disease. Scand J Clin Lab Invest 2007;67:297-305.
20. MacGregor MS, Boag DE and Innes A. Chronic kidney disease:
evolving strategies for detection and management of impaired
renal function. Q J Med 2006;99:365-375.