Engineering Materials and Processes phần 9 ppsx
Bạn đang xem bản rút gọn của tài liệu. Xem và tải ngay bản đầy đủ của tài liệu tại đây (326.87 KB, 14 trang )
Integration Issues 103
its eutectic point, further annealing in an oxidizing ambient no longer gives
outdiffusion of silicon [11]. Crystallization takes place during annealing, which
greatly reduces the number of grain boundaries in the annealed samples compared
with the polycrystalline films in the as-deposited state.
Under the same annealing conditions (temperature and time) the 50 nm-thick
Au layer compared to the 150 nm, forms a slightly thicker oxide, due to the longer
diffusion path for the thicker Au overlayer [13].
6.2.5 Conclusions
In 30 years, the Hiraki et al. [11], conclusion has not changed: ‘‘When a single
crystal substrate of silicon is covered with evaporated gold and heated at relatively
low temperatures (100–300°C) in an oxidizing atmosphere, a silicon-dioxide layer
is readily formed over the gold layer’’. This investigation reaffirmed the Au/Si
results [13]. No oxide layer is formed on Ag/Si layers annealed under the same
conditions. The Ag forms a discontinuous layer. The results obtained from the
Au/Si and Ag/Si correlate well with the surface potential model.
6.3 Silver Metallization on Silicides with Nitride Barriers
6.3.1 Introduction
The attractive properties of Ag, such as its low resistivity coupled with increased
resistance to electromigration, have propelled some exciting research aimed
towards its use as a future interconnect material in the next generation of ULSI
devices [14]. Early studies of the Ag/Si interface have shown the morphological
stability to be poor since it is prone to agglomeration upon annealing of only 200
o
C. The addition of a thin interposing Au layer between Ag and Si has improved
the stability of the interface by forming an intermixed region, which lowers the
interfacial energy of the original Ag/Si system. Several authors have investigated
the behavior of Ag at the SiO
2
/Si interface [15]. Results [16], suggest that
diffusion of trace amounts of Ag occur in the Ag/CoSi
2
/Si and Ag/NiSi/Si systems.
To combat such problems, several barriers for Ag inter-diffusion have been
proposed; titanium, titanium nitride, tantalum and tantalum nitride are typical
barriers used with copper and silver [17]. Other barrier layers such as aluminum
oxynitrides were studied as well
[2, 4, 18–19].
Working with Ag it was quickly noticed that its diffusion into substrates and
dielectrics posed challenges to be overcome. Mitan et al. investigated the thermal
stability of Ag at the CoSi
2
and NiSi interfaces in conjunction with a Ti-O-N
diffusion barrier [20]. The discussion is divided into two sections, CoSi
2
and NiSi.
Each section discusses the behavior of Ag and barrier layer with respect to the
silicide being examined.
104 Silver Metallization
6.3.2 Experimental Details
6.3.2.1 CoSi
2
and Ti-O-N Preparation
Test grade silicon (100) p-type wafers, 10 to 20 Ω resistance, were cleaned in a
piranha bath containing sulfuric acid and hydrogen peroxide at 100
o
C. The native
oxide was subsequently removed by dilute hydrofluoric acid. Immediately after
cleaning the wafers were loaded into a Varian electron-beam deposition chamber.
A 60 nm thin film of Co metal was deposited on a clean silicon wafer at a base
pressure of 1 × 10
–6
Torr. A 5 nm capping layer of silicon was deposited over the
Co in the same chamber without breaking vacuum. This capping layer protected
the cobalt from reacting with oxygen while transferring samples from the
deposition chamber to the anneal furnace. The formation of CoSi
2
was
accomplished by annealing in a rapid thermal annealer (RTA) in two steps. The
initial heat treatment step at 500
o
C for 40 seconds was followed by 750
o
C for 30
seconds. All rapid thermal anneal furnace treatments were performed under a
nitrogen atmosphere. In between heat treatments excess metal was removed by
dilute nitric acid. This self-aligning approach yielded very smooth polycrystalline
silicide layers. The silicided silicon wafer was then coated with 20 nm of Ti-O-N
using DC sputtering. The base pressure in the sputtering chamber was 1.3 × 10
–7
Torr. N
2
and Ar gas flow rates were set at 6 sccm, respectively. The film was
sputtered at a power of 300 W. After Ti-O-N deposition, the sample was again
loaded into the Varian electron-beam deposition chamber for Ag deposition. With
a base pressure of 1 × 10
–6
Torr, 100 nm of Ag was deposited on top of the Ti-O-
N/CoSi
2
layers. The silver coated sample was sectioned into small samples and
then annealed at 100
o
C increments starting from 100
o
C up to 700
o
C for 30 minutes
each. One additional sample was annealed at 650
o
C to give good comparison with
previous work. These thermal stability tests were performed in a vacuum furnace
at a pressure of 1 × 10
–8
Torr.
6.3.2.2 NiSi and Ti-O-N Preparation
Using cleaned Si wafers as described in CoSi
2
preparation section, a 50 nm film of
Ni metal was deposited at a base pressure of 1 × 10
–6
Torr followed by the
immediate deposition of a silicon cap of 5 nm. The Si cap layer served to protect
the Ni from air during transport to the anneal furnace. The formation of NiSi was
accomplished by annealing in RTA at 400
o
C for 30 minutes under flowing N
2
ambient. The RTA anneal procedure produced smooth single-phase
polycrystalline NiSi [19]. The silicided silicon wafer was then coated with 20 nm
of Ti-O-N using DC sputtering. The base pressure in the sputtering chamber was
1.3 × 10
–7
Torr. N
2
and Ar gas flow rates were set at 6 sccm, respectively. The
film was sputtered at a power of 300 W. After Ti-O-N deposition, the sample was
again loaded into the Varian electron-beam-deposition chamber for Ag deposition.
With a base pressure of 1 × 10
–6
Torr 100 nm of Ag was deposited on top of the Ti-
O-N/NiSi layers. Thermal stability tests were identical to the CoSi
2
samples.
Integration Issues 105
6.3.2.3 Ag/barrier/silicide/silicon Evaluation
All samples were analyzed by Rutherford backscattering spectrometry (RBS), X-
ray diffractometry (XRD), optical microscopy, atomic force microscopy (AFM),
and secondary ion mass spectroscopy (SIMS). Additionally, the Ag thin film
resistance was checked by in-line four-point-probe (FPP) measurements. FPP
measurements were made with a Keithley 2700 Multimeter using 100 mA of
current. RBS spectra were generated using 2 MeV and 3.7 MeV alpha particles.
Sample and detector were in the Cornell geometry arrangement such that the
backscatter detector is directly below the incident beam; the incident beam and the
scattered beam are in a vertical plane. In this geometry the sample normal is not in
that vertical plane. The samples were tilted 7
o
off beam axis to avoid channeling,
and a scattering angle of 172
o
was used for spectra collection. RBS spectra were
simulated using RUMP software.
Ag morphology micrographs were generated with optical microscopy. Sample
surface scans were acquired on a Digital Instruments Dimension 5000 (AFM) in
tapping mode to capture image using Nanoprobe TESP tips. SIMS depth profiles
were generated using a Cameca IMS-6f secondary ion microanalyzer. Profiles
were generated using 10 nA of beam current of Cs
+
at 10 KeV in a chamber at
vacuum of 1 × 10
–7
Torr. The beam was rastered over 250 μm. Sample bias was
set to +5 KV giving net ion incident energy of 5 KeV. These instrument
parameters are used in a technique known as, Cs attachment SIMS, which helps
minimize matrix effects as well as decrease clustered molecular interference. The
goal here was to discover if any Ag had migrated into the silicide films through the
diffusion barrier; therefore, Ag was removed prior to SIMS profiling by immersing
samples in a bath of 1:1 nitric acid and water for 30 seconds.
6.3.3 Results and Discussions
6.3.3.1 Ag/Ti-O-N/CoSi
2
/Si
The thermal behavior of the Ag films was first analyzed by Rutherford
backscattering spectrometry (RBS). Figure 6.15 shows the RBS spectra for the as-
deposited Ag film on the Ti-O-N/CoSi
2
/Si thin film structure. The simulation
coincided with collected spectra, which gives a CoSi
2
thickness of 200 nm and a
100 nm thick Ag top layer. The Ti-O-N barrier was approximated at 50 nm using
RUMP simulation and correlation of sputter deposition parameters. The
discrepancy between the heights of the evaporated Ag film and that of the
simulated film signals is likely due to inclusion of light elements in the Ag films,
an artifact of the poor vacuum in the evaporation chamber. Figure 6.15 also
compares the spectra of films annealed at 600
o
C, 650
o
C, and 700
o
C against the as-
deposited film. Spectra of the 600
o
C and 650
o
C profiles show a small rise in the
trailing edge of the Ag peak together with drop in the overall Ag peak intensity.
The Co signal reveals a slight forward shift from the as deposited spectrum. All of
these changes can be attributed to morphology changes of the Ag film during the
annealing process. The loss of Ag signal becomes pronounced when the films are
annealed to 700
o
C, which clearly shows a significant drop in the integral Ag signal.
106 Silver Metallization
For a pure example of Ag film agglomeration, a drop in the surface Ag peak
would coincide with a trailing edge that makes up for the loss in the surface peak’s
initial integral counts. The trailing edge, which is not present in this RBS plot,
would account for the formation of voids and an increase in the thickness of the
resultant islands. The case presented here suggests the agglomeration of the Ag
film may not be a possible reason of Ag film failure on Ti-O-N film. At this point,
the voided film allows the Co and Si signals to move forward to their respective
RBS surface peak energies.
Optical imaging analysis of the as-deposited and the annealed Ag films at 600,
650, and 700
o
C suggested that there is no significant increase in the surface height
upon film voiding. This indicated that voids are not formed only by the process of
agglomeration. Agglomeration results in the rough surface morphology due to
hillock formation caused by diffusion of atoms. The voids are caused by the Ag
film failure mechanism at elevated temperature since these voids are not found in
as-deposited and low temperature annealed samples.
Figure 6.15. RBS 2 MeV spectra of Ag/Ti-O-N/CoSi
2
/Si film structure of as-deposited and
annealed samples at 600, 650, and 700
o
C [20]
CoSi
2
Si
Ag
TiON
2.0 Mev
4
He
++
CoSi
2
Si
Ag
TiON
2.0 Mev
4
He
++
Integration Issues 107
To help to illuminate film roughness around a void before and after heating,
AFM scans were taken to get an accurate indication of the surface roughness and
step height changes. From AFM analysis it followed that the thin Ag film in its as-
deposited form follows the topography of the Ti-O-N layer that it covers. The
voids are most likely initiated by an agglomeration mechanism but can not account
for the missing Ag.
Confirmation of crystalline phase changes was accomplished through XRD
analysis. 2θ-θ scans performed of the as-deposited and 700
o
C anneal conditions
did not reveal the presence of any unexpected compounds. Figure 6.16 shows two
overlaid spectra. Figure 6.16a is the as-deposited Ag film on Ti-O-N/CoSi
2
,
followed by the 700
o
C anneal with film voiding (Figure 6.16b). All peaks were
identified as belonging to CoSi
2
or Ag except substrate peaks (Si). No
transformation of phases during film anneals were observed. No peaks were found
corresponding to Ti-O-N due to the film’s shallow thickness and lack of
crystallinity.
Figure 6.16. Overlaid XRD 2θ-θ scan data. (a) as-deposited Ag film on Ti-O-N/CoSi
2
, (b)
700
o
C anneal of Ag on Ti-O-N/CoSi
2
[20].
30 40 50 60 70 80 90
: Si
: Ag
: CoSi
2
(b)
(a)
Intensity (Arb. Unit)
2
θ
(degree)
108 Silver Metallization
6.3.3.2 Ag/Ti-O-N/NiSi/Si
Initial evaluation of annealed films is accomplished by RBS. The behavior of the
Ag films on Ti-O-N/NiSi is similar to the Ti-O-N/CoSi
2
experiments. Figure 6.17
displays the RBS spectra of the as deposited condition, the simulation, and the
higher temperature annealed films 600
o
C to 700
o
C. The simulation coincided with
collected spectra from as-deposited sample, which gives a NiSi thickness of 270
nm and a 100 nm thick Ag top layer. The Ti-O-N barrier was approximated at 50
nm using RUMP simulation and correlation of sputter-deposition parameters. The
discrepancy between the heights of the evaporated Ag film and that of the
simulated film signals is likely due to inclusion of light elements in the Ag films
caused by the poor vacuum in the evaporation chamber.
Upon Ag film breakup, the spectra shows that the Si and Ni signals have moved
forward and the Ag peak has fallen by roughly 40%, indicating formation voids in
the Ag film. Similar to the CoSi
2
case, the Ag does not agglomerate into islands of
thicker films. Paralleling the CoSi
2
example, the Ni system does not show any long
range trend (RBS) of surface height (ΔZ) increases leading to a similar conclusion.
The voiding, most likely initiated by an agglomeration mechanism, can not account
for the missing Ag.
Figure 6.17. RBS 2 MeV spectra of Ag/Ti-O-N/NiSi/Si film structure of as-deposited and
annealed samples at 600, 650, and 700
o
C [20]
NiSiSi Ag
TiON
2.0 Mev
4
He
++
NiSiSi Ag
TiON
2.0 Mev
4
He
++
Integration Issues 109
Confirmation of crystalline phase changes was accomplished through XRD
analysis. 2θ-θ scans performed on the as deposited and 700
o
C anneal conditions
did not reveal the presence of any unexpected compounds. Figure 6.18 shows two
overlaid spectra. Figure 6.18a is the as-deposited Ag film on Ti-O-N/NiSi, lower
plot, followed by the 700
o
C anneal with film voiding, upper plot (Figure 6.18b).
All peaks were identified as belonging to NiSi or Ag except Si substrate peaks. No
transformation of phases during film anneals were observed. No peaks were found
corresponding to Ti-O-N due to the film’s shallow thickness and lack of
crystallinity.
Figure 6.18. Overlaid XRD 2θ-θ scan spectra of (a) as-deposited Ag film on Ti-O-N/CoSi
2
and (b) the 700
o
C anneal of Ag on Ti-O-N/NiSi [20]
6.3.4 Conclusions
RBS results of the annealed Ag/Ti-O-N/silicide layers reveal the presence of stable
silicides across the investigated temperature range. There were no phase changes
observed in the films that XRD could detect throughout the temperature range. A
similarity with both silicide scenarios seems to be the unusual failure mode of the
Ag film. Upon film breakup, both examples show a behavior where the voids
formed have smooth ridges, however, the step height increases at the edges do not
account for the missing Ag. Some of the observed voids frequently have no
significant ridge height increase and thus irregular vias form within the Ag film.
30 40 50 60 70 80 90
: Si
: Ag
: NiSi
(b)
(a)
Intensity (Arb. Unit)
2
θ
(degree)
110 Silver Metallization
This effect is more pronounced with NiSi giving it almost no significant rise of the
Ag trailing edge of its RBS plot. The overall success of the barrier layer below
500
o
C is eventually concluded via the SIMS profiles which indicate trace amounts
of Ag segregating to the silicide/silicon interfaces through the Ti-O-N barrier [20].
From the experimental data shown in this study, it is thought that failures of Ag
films on Ti-O-N/silicide/Si are caused by the combination of Ag film
agglomeration and diffusion into underlying substrates. The mass loss of Ag film
cannot only be explained by agglomeration process. From the SIMS analysis, it
was revealed some amount of Ag has moved to the interface between Si and
silicides. The electrical conductivity of the Ag films remained constant up to
600
o
C, a result that was independent of the Ag diffusion issue. Currently the use
of CoSi
2
is widespread in the industry and NiSi is gaining ground due to its smaller
consumption of Si during formation. The ability of Ag film survival up to 600
o
C is
useful for many high temperature applications [20]
.
6.4 References
[1] D. Adams, T. Laursen, T. L. Alford, J. W. Mayer, Thin Solid Films,
308/309, 448(1997).
[2] Y. L. Zou, T. L. Alford, J. W. Mayer, F. Deng, S. S. Lau, T. Laursen,
A. I. Amli, B. M. Ullrich, J. Appl. Phys. 82, 3321(1997).
[3] T. L. Alford, D. Adams, T. Laursen, B. Manfred Ullrich, Appl. Phys. Lett.
68, 3251(1996).
[4] Y. Wang, T. L. Alford, Appl. Phys. Lett. 74, 52(1999).
[5] Y. Wang, T. L. Alford, J. W. Mayer, J. Appl. Phys. 86, 5407(1999).
[6] D. Adams, B. A. Julies, T. L. Alford, J. W. Mayer, Thin Solid Films 332
[7] D. Adams, T. L. Alford, Mater. Sci. Eng., R. 40 (6), 224(2003).
[8] G. F. Malgas, D. Adams, T. L. Alford, and J. W. Mayer, Thin Solid Films
467, 267(2004).
[9] T. L. Alford, E. J. Jaquez, N. D. Theodore, S. W. Russell, M. Diale,
D. Adams, J. Appl. Phys. 79 (4), 2074(1996).
[10] J. Li, J. W. Mayer, L. J. Matienzo, F. Emmi, Mater. Chem. Phys. 32,
390(1992).
[11] A. Hiraki, E. Lugujjo, J. W. Mayer, J. Appl. Phys. 43, 3643(1972).
[12] J. M. Poate, K. N. Tu, J. W. Mayer (Eds.), Thin Films–Interdiffusion and
Reactions, Wiley/Interscience, New York, 1978.
[13] D. Adams, B. A. Julies, J. W. Mayer, T. L. Alford. Applied Surface Science
216, 163(2003).
[14] P. L. Rossiter, The Electrical Resistivity of Metals and Alloys, (Cambridge
University Press, Cambridge, UK, 1987).
[15] K. Sieradzki, K. Baily, and T. L. Alford, Appl. Phys. Lett. 79, 3401 (2001).
[16] M. M. Mitan, T. L. Alford, Thin Solid Films 434, 258 (2003).
[17] T. L. Alford, P. Nyugen, Y. Zeng, J. W. Mayer, Microelectronic Eng. 55,
383(2001).
Integration Issues 111
[18] Y. Zeng, Y. L. Zou, T. L. Alford, S. S. Lau, F. Deng, T. Laursen and
B. M. Ullrich, J. Appl. Phys. 81, 7773(1997).
[19] B. A. Julies, D. Knoesen, R. Pretorius, D. Adams, Thin Solid Films 347,
201(1999).
[20] M. M. Mitan, H. C. Kim, T. L. Alford, J. W. Mayer, G. F. Malgas, and
D. Adams. J. Vac. Sci. Technol. B 22(6), 2804(2004).
This page intentionally blank
7
Summary
7.1 Introduction
This monograph reviews bilayer and alloy techniques with Ti, Al and others to
form adhesion layers and diffusion barriers. The temperature range of thermal
stability is covered. During Ti and Al transport to form the encapsulating layers,
the Ag films develop <111> texture. Integration with low-K dielectrics such as
paralene has been demonstrated. Encapsulated Ag films have superior resistance to
electromigration degradation.
7.2 Thermal Stability: Diffusion Barriers and Self-encapsulation
In view of the thermal stability issues associated with silver metallization
a passivation layer and diffusion barrier are required to protect it from the
fabrication environment, and an adhesion promoter is needed to enhance adhesion
of Ag to the dielectrics.
Titanium–nitride is used in integrated circuit technology as a diffusion barrier
and etch stop. It has low specific resistance when compared to TiW [1], which
makes it particularly attractive in applications where device speed is critical.
Furthermore, TiN has been found to suppress or prevent aluminum migration
through TiSi
2
to the silicon substrate [2]. This makes TiN a viable material for thin-
film diffusion or reaction barrier layer. Two common methodologies can be used to
produce TiN, i.e. (1) reactive sputtering of titanium in a nitrogen ambient [3] and
(2) titanium deposition and subsequent annealing in either nitrogen or ammonia
114 Silver Metallization
[2]. The reactive sputtering in the nitrogen ambient has suffered from an
incomplete control of compositions since the sputter rate changes as a function of
time. Therefore, we have focused on forming a TiN passivation layer in an
ammonia ambient to encapsulate Ag films [4,5].
To accomplish both surface passivation and diffusion barrier/adhesion
promoter functions in a single process step, it has been proposed to anneal Cu-
refractory metal (Ti, Cr) alloy and bilayer structures on SiO
2
in an ammonia (NH
3
)
ambient to induce simultaneously a surface nitridation reaction and interfacial
reactions [6]. This process has been applied to Ag-refractory metal systems and is
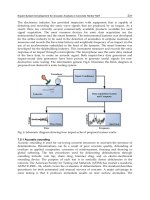
schematically represented in Figure 7.1. The surface reaction results in the
formation of a titanium–nitride encapsulation layer (labeled as “TiN
x
”) and a
titanium-oxide/titanium-silicide (“TiO/TiSi
y
”) bilayer structure, which is a direct
consequence of the interfacial reaction.
Figure 7.1. Schematic of nitride self-encapsulation of silver-bilayers and –alloys. The
encapsulation process simultaneously provides a surface protection layer and an interfacial
adhesion layer [17].
The RBS spectrum of an as-deposited Cu (20 at.% Ti) alloy is compared with
that annealed at 500°C for 120 minutes (Figure 7.2). Upon annealing the Ti
segregated to the free surface and the alloy/SiO
2
interface, with a slight preference
to the surface. The Ti that diffused to the surface reacted with the
ammonia and
residual oxygen to form a titanium–nitride layer, indicated as TiN(O). The
interfacial
layers are labeled as “TiO
w
” and “Ti
5
Si
3
”, respectively. The spectrum of
the annealed sample gives a residual Ti concentration of ~5.5 at.%.
Summary 115
Figure 7.2. RBS spectra showing only the depth distributions of Ti for a Cu(20 at.% Ti)
alloy before and after annealing for 120 minutes at 500°C in NH
3
ambient. The spectra were
obtained using a 4.3 MeV He
2+
beam and a scattering angle of 170° [17].
The encapsulation of the Ag-refractory bilayers proceeded in a similar way to
that of the alloys. Alford et al. [4] demonstrated the encapsulation of the Ag-
refractory bilayers using RBS (as show in Figure 7.3). Only the Ti and Ag
backscattered signals are displayed, and the Ti signal shows clearly that the 500°C
anneal causes Ti to segregate at the surface (see peak labeled “Ti surface”). Based
on the RBS analysis, the TiN(O) surface layer is 10 nm thick. The interfacial
bilayer is expected to consist of TiO
w
(w~1:1) and Ti
5
Si
3
, the reaction products
from the Ti–SiO
2
reaction [7].
116 Silver Metallization
Figure 7.3. Ag encapsulation on SiO
2
prepared from Ag(120 nm)/Ti(22 nm) bilayers. RBS
spectra show the depth distributions of Ag and Ti before and after annealing at 500°C in an
ammonia ambient for 30 minutes. The spectra were obtained using a 2.0 MeV He
+2
beam
and a scattering angle of 170° [4].
Wang and Alford [8] evaluated the effectiveness of the Al
x
O
y
N
z
encapsulation
layer as diffusion barrier. This was done by depositing a 50 nm thick Cu film on
the Al
x
O
y
N
z
/Ag structure followed by a high temperature anneal in both vacuum
and forming gas. Figure 7.4 shows the RBS spectra of the Cu/Al
x
O
y
N
z
/Ag structure
before and after annealing at 620°C for 30 minutes [8]. Analysis of the data
revealed that no interdiffusion occurred between the Cu and Ag. These results were
the same for anneals in both vacuum and forming gas. Compared to the results
obtained from the Ag/TiN system [9], the Al
x
O
y
N
z
diffusion barrier is stable up to
620°C, which is about 200°C higher than the TiN processed in a similar manner.