Báo cáo khoa học: "Short-term variations and long-term changes in oak productivity in northeastern France. The role of climate and atmospheric CO 2" pot
Bạn đang xem bản rút gọn của tài liệu. Xem và tải ngay bản đầy đủ của tài liệu tại đây (872.58 KB, 16 trang )
Original
article
Short-term
variations
and
long-term
changes
in
oak
productivity
in
northeastern
France.
The
role
of
climate
and
atmospheric
CO
2
M
Becker
TM
Nieminen
F
Gérémia
1
1
INRA,
Forest
Research
Center,
54280
Champenoux,
France;
2
Finnish
Forest
Research
Institute,
PL
18, 01301
Vantaa,
Finland
(Received
20
July
1993;
accepted
24
January
1994)
Summary —
A
dendroecological
study
was
carried
out
in
2
forests
in
northeastern
France
with
the
aim
of
identifying
and
quantifying
possible
long-term
trends
in
the
radial
growth
of
sessile
oak
(Quercus
petraea
(Matt)
Liebl)
and
pedunculate
oak
(Q
robur
L).
A
total
of
150
sites
were
selected
to
represent
the
ecological
diversity
of
these
forests.
An
index
Cdwas
used
to
correct
annual
ring
width
in
order
to
compensate
for
the
effect
of
different
competition
situations.
The
data
were
standardized
with
reference
to
the
mean
curve ’basal
area
increment
vs
cambial
age’.
The
growth
index
curves
revealed
a
strong
increase
in
sessile
oak
growth
(+
64%
during
the
period
1888
to
1987)
as
well
as
in
that
of
peduncu-
late
oak
(+40%).
The
growth
increase
in
the ’young’
rings
(<
60
years)
of
sessile
oak
was
+
81%,
and
that
of
young
rings
of
pedunculate
oak
was
+
49%.
The
corresponding
increase
in
the
’old’
rings
(>
65
years)
was
+
48%
and
15%
respectively
(not
significant
for
the
latter).
It
would
thus
appear
that
pedun-
culate
oak
has
benefited
to
a
lesser
extent
than
sessile
oak
from
the
progressive
changes
in
its
envi-
ronment.
Years
showing
a
strong
growth
decrease
are
more
common
for
pedunculate
oak
than
for
ses-
sile
oak.
These
results
are
consistent
with
a
recent
hypothesis
about
a
slow
but
general
retreat
of
pedunculate
oak,
including
severe
episodic
declines,
in
favour
of
sessile
oak
in
many
regions
of
France.
A
model
was
created
using
a
combination
of
meteorological
data
(monthly
precipitation
and
tem-
perature)
starting
in
1881,
and
increasing
atmospheric
CO
2
concentrations.
The
model
explains
78.3%
of
the
variance
for
sessile
oak
and
74.3%
for
pedunculate
oak.
This
includes
some
monthly
parame-
ters
of
year
y
(year
of
ring
formation),
and
also
some
parameters
of
the
years
y-
1
to
y-
4
for
sessile
oak
and
y-
1
to
y-
5
for
pedunculate
oak.
The
models
satisfactorily
reproduce
the
long-term
trends
and
the
interannual
variation.
The
climatic
variables
alone
(ie
excluding
the
CO
2
concentration)
were
insufficient
to
explain
the
trends
observed.
The
possible
direct
and
indirect
effects
of
increasing
CO
2
concentration
on
the
growth
of
both
species
are
discussed.
Quercus robur /
Quercus petraea
I France
/ tree
growth
I
dendrochronology
I
dendroecology
/
climate
I
precipitation
I
temperature
I
CO
2
I
global
change
Résumé —
Variations
à
court
terme
et
changements
à
long
terme
de
la
productivité
du
chêne
dans
le
nord-est
de
la
France.
Rôle
du
climat
et
du
CO
2
atmosphérique.
Une
étude
dendroéco-
logique
a
été
menée
dans
2
forêts
de
chêne
du
nord-est
de
la
France
dans
le
but
de
mettre
en
évidence
et
de
quantifier
d’éventuels
changements
à
long
terme
dans
la
croissance
radiale
du
chêne
sessile
(Quer-
cus
petraea
[Matt]
Liebl)
et
du
chêne
pédonculé
(Q
robur
L).
Un
total
de
150
placettes
ont
été
sélec-
tionnées,
représentatives
de
la
diversité
écologique
de
ces
forêts.
Les
largeurs
de
cernes
mesurées
ont
été
corrigées
à
l’aide
d’un
index
Cd
afin
de
compenser
l’effet
des
variations
du
statut
de
compéti-
tion
entre
les
arbres.
Ces
données
ont
été
standardisées
par
référence
à
la
courbe
moyenne
des
accroissements
annuels
en
surface
terrière
en
fonction
de
l’âge
cambial.
Les
courbes
d’indices
de
crois-
sance
révèlent
une
forte
augmentation
à
long
terme
du
niveau
de
productivité,
aussi
bien
chez
le
chêne
sessile
(+
64%
entre
1888
et
1987)
que
chez
le
chêne
pédonculé
(+
40%).
L’augmentation
est
plus
sensible
pour
les
cernes
«jeunes»
(<
60
ans) :
+
81
%
chez
le
sessile
et
+
49%
chez
le
pédonculé.
Pour
les
cernes
«vieux»
(>
65
ans),
elle
est
respectivement
de
+
48%
et
15%
(non
significatif
pour
la
dernière).
Il
semble
donc
que
le
chêne
pédonculé
ait
moins
bénéficié
que
le
chêne
sessile
des
modi-
fications
progressives
de
son
environnement.
Les
années
caractéristiques
d’une
forte
baisse
relative
de
croissance
sont
beaucoup
plus
fréquentes
chez
le
chêne
pédonculé
que
chez
le
chêne
sessile.
Ces
résultats
sont
cohérents
avec
l’hypothèse
récente
d’un
déclin
lent
mais
général
du
chêne
pédonculé,
au
profit
du
chêne
sessile,
dans
de
nombreuses
régions
françaises,
ponctué
de
dépérissements
épi-
sodiques
sévères.
Deux
modèles
climatiques
ont
été
élaborés,
sur la
base
de
données
météorologiques
mensuelles
de
précipitations
et
de
températures
disponibles
depuis
1881 ;
l’augmentation
progressive
de
la
teneur
en
CO
2
atmosphérique
a
également
été
prise
en
compte.
Ces
modèles
expliquent
78,3%
de
la
variance
pour
le
chêne
sessile,
et
74,3%
pour
le
chêne
pédonculé.
Ils
incluent
non
seulement
cer-
tains
paramètres
climatiques
de
l’année
y
(année
de
formation
du
cerne),
mais
aussi
divers
para-
mètres
des
années
y -
1
à y -
4
pour
le
chêne
sessile
et y - 1 à y -
5 pour
le
chêne
pédonculé.
Ces
modèles
reconstruisent
de
façon
très
satisfaisante
aussi
bien
les
tendances
à
long
terme
que
les
variations
interannuelles.
Les
variables
climatiques
seules,
sans
la
teneur
en
CO
2
atmosphérique,
sont
insuffisantes
pour
expliquer
les
tendances
observées.
Les
effets
possibles,
directs
et
indirects,
de
l’augmentation
du
CO
2
sur
la
croissance
des
2 espèces
sont
discutés.
Quercus
robur
/Quercus
petraea
/
France
/
croissance
des
arbres
/
dendrochronologie
/ den-
droécologie
/ climat
/ précipitations
/ température
/ CO
2
/
changements
globaux
INTRODUCTION
Recent
dendrochronological
studies
sug-
gest
that
a
long-term
increase
has
taken
place
in
the
wood
production
rates
of
vari-
ous
forest
ecosystems.
This
has
been
observed
in
boreal
forests
in
Europe
(Hari
et
al,
1984)
and
North
America
(Payette
et al,
1985;
d’Arrigo
et al,
1987;
Jozsa
and
Pow-
ell
1987),
and
also
in
the
mountain
forests
of
the
temperate
zones
in
Europe
(Becker,
1989;
Briffa,
1992)
and
North
America
(Lamarche
et al,
1984;
Graumlich
et al,
1989;
Peterson
et al,
1990).
Fewer
studies
have
been
carried
out
in
the
plain
forests
of
temperate
zones
(Wagener
et
al,
1983).
In
addition
to
these
dendrochronologi-
cal
studies,
Kenk
et
al
(1989)
reported
a
similar
result
in
the
Black
Forest
in
Ger-
many
after
directly
comparing
the
production
of
2
successive
generations
of
Norway
spruce
on
the
same
site.
A
similar
growth
increase
has
been
found
in
the
case
of
silver
fir
(Abies
alba
Miller)
in
the
Vosges
mountains
(France),
in
studies
started
in
1984
as
a
part
of
the
national
research
program
Deforpa
(forest
decline
and
air
pollution).
In
these
studies,
forest
decline
at
altitudes
ranging
from
400
to
1
000
m
has
proved
to
be
one
of
the
main
episodic
crises
which
affect
the
growth
and
vitality
of
trees
as
a
consequence
of
unfavourable
meteorological
conditions
(Becker,
1987).
On
the
other
hand,
on
the
century
time-scale,
a
clear
long-term
increase
in
the
average
radial
growth
level
was
demonstrated
(Becker,
1989).
More-
over,
the
monthly
precipitation
and
temper-
ature
data
for
the
year
of
ring
formation
and
the
6
preceding
years
explained
a
high
pro-
portion
(almost
80%)
of
the
observed
vari-
ation
during
the
episodic
crises
as
well
as
the
long-term
trend,
ie
the
average
in
the
production
rate
over
more
than
a
century.
In
contrast
to
these
results,
there
was
no
significant
increasing
trend
in
the
average
radial
growth
rate
found
in
a
preliminary
analysis
using
the
same
methodology
in
northeastern
France
using
oak
at
low
alti-
tudes
(200-250m)
(Nieminen,
1988).
A
number
of
possible
explanations
have
been
proposed:
(1)
Different
species
react
differently
to
changes
in
the
environment.
This
could
be
the
case
between
silver
fir
and
oak
but
this
could
also
be
due
to
differences
on a
larger
scale
between
conifers
and
broadleaved
trees.
(2)
Different
climates
are
present
on
the
plain
and
in
the
mountains,
even
though
the
distance
between
these
areas
is
only
about
100
km.
More
precisely,
these
were
differ-
ences
in
climate
modification
that
took
place
in
these
areas
during
the
last
century.
(3)
The skewed
structure
of
the
data
result-
ing
from
the
different
silvicultural
history
of
the
stands
could
cause
artifacts.
About
150
years
ago
the
treatment
in
some
parts
of
the
forest
changed
from
coppice-with-stan-
dards
to
that
of
an
even-aged
high
forest.
As
a
consequence,
most
of
the
older
sam-
pled
trees
grew
at
a
lower
stand
density
during
their
early
stage
of
development
than
the
younger
trees
sampled.
This
difference
in
competition
has
a
strong
influence
on
height
and
tree-ring
width
development.
In
order
to test
this
third
hypothesis,
an
index
of
competition
(Cd)
was
created
to
compensate
for
the
effects
of
different
com-
petition
status
experienced
by
the
trees
throughout
their
lifetime
(Becker,
1992).
The
data
set,
which
has
since
been
enlarged
by
additional
sampling,
has
been
reprocessed
using
corrected
tree
ring
widths.
In
addition,
we
have
used
the
basal
area
increment
(BAI),
instead
of
the
widely
used
tree
ring
width,
partly
because
BAI
is
more
directly
related
to
the
production
rate
that
is
of
interest
to
foresters,
but
especially
because
it
is
less
dependent
on
the
cam-
bial
age,
or
current
age,
ie the
age
of
a
tree
at
the
time
of
annual
ring
formation
(Fed-
erer
et al,
1989;
Briffa,
1992;
Jordan
and
Lockaby, 1990).
The
main
aim
of
this
study
was
to
estab-
lish
the
presence
or
absence
of
a
long-term
trend
in
the
radial
growth
rate
of
oak
growing
on
the
plain.
If
it
were
shown
to
exist,
then
quantifying
the
trend,
as
well
as
modelling
the
response
of radial
growth
to
climatic fac-
tors
and
atmospheric
CO
2
concentrations,
were
additional
aims.
Moreover,
a
compar-
ison
between
the
2
oak
species
that
grow
on
the
plains
of
northeastern
France
was
an
important
objective
in
itself.
Pedunculate
oak
(Quercus
robur L)
is
known
to
be
more
sensitive
to
abnormal
weather
conditions
than
sessile
oak
(Q
petraea
(Matt)
Liebl).
Pedunculate
oak
is
very
sensitive
to
suc-
cessive
years
of
drought,
and,
in
France,
it
has
suffered
from
severe
episodic
declines
during
the
20th
century
(Becker
and
Lévy,
1982).
MATERIALS
AND
METHODS
Study
area
The
forest
area
under
study
is
situated
in
north-
eastern
France
(48°
45’N,
6°
20’
E,
250
m
ele-
vation)
in
the
region
of
Lorraine,
in
2
state
forests
located
close
to
each
other:
the
forest of
Amance
(972
ha)
and
the
forest
of
Champenoux
(467
ha).
The
climate
type
is
semi-continental,
although
there
is
fairly
regular
rainfall
throughout
the
year.
Annual
precipitation
is
about
700
mm,
and
the
average
annual
temperature
9.1°C.
The
most
typ-
ical soil
type
is
’leached
brown
earth’,
which
is
developed
on
marls
covered
with
loam
of
vary-
ing
depth.
Exceptions
are
the
’pelosol’
and
’pseudogley’
soils
in
certain
valley
bottoms
where
drainage
is
insufficient.
Pedunculate
and
sessile
oaks
are
the
major
tree
species
with
a
varying
admixture
of
beech
(Fagus
silvatica
L)
and
hornbeam
(Carpinus
betu-
lus
L).
Prior
to
1826,
the
forests
were
treated
as
coppice-with-standards
stands
for
centuries.
From
1867
until
1914,
most
of
the
stands
were
regen-
erated
to
form
even-aged
high-forest
stands,
but
the
old
coppice-with-standards
stands
are
still
to
be
found
in
some
parts
of
the
forests.
Sampling
The
study
sites
were
chosen
to
represent
the
complete
ecological
diversity
in
the
forest
areas,
although
mixtures
of
both
oak
species
were
favoured.
Five
dominant
trees
of
both
species
were
bored
to
the
pith
on
every
sample
plot
when-
ever
possible.
However,
the
total
number
of
sam-
ple
trees
on
many
of
the
plots
was
less
than
10
owing
to
the
low
abundance
of
1
of
the
2
species,
and
in
some
rare
cases
codominant
trees
had
to
be
chosen
as
sample
trees.
Special
attention
was
paid
to
the
ecological
homogeneity
of
the
sample
plots.
The
homogeneity
of
the
ground
vegetation
was
also
taken
into
account.
The
topographic
position
and
the
drainage
conditions
on
each
sample
plot
were
recorded
in
order
to
characterize
the
availability
of
water
in
the
soil.
A
complete
floristic
’relevé’
according
to
the
method
of
Braun-Blanquet
was
also
produced.
The
total
height
(H)
and
the
stem
diameter
at
breast
height
(D)
of
the
sample
trees
were
also
measured.
Two
cores
were
taken
from
each
sample
tree
at
a
height
of
2.80
m
(to
minimize
the
negative
effects
on
the
wood
quality
of
the
butt
log),
one
from
the northern
side
of
the
trunk
and
the
other
from
the
southern
side.
Throughout
the
text,
age
refers
to
that
determined
at
this
height.
The
total
number
of
sample
plots
was
150.
Sessile
oak
was
present
on
121
plots
(529
sample
trees)
and
pedunculate
oak
on
115
plots
(505
trees).
Both
species
were
present
on
85
plots.
The
average
age
of
sessile
oak
was
86
years,
giving
a
total
of
about
91
000
measured
tree-ring
widths.
The
average
age
of
pedunculate
oak
was
80
years,
with
about
80
800
measured
tree-ring
widths.
Data
processing
The
annual
ring
widths
of
2
068
cores
were
mea-
sured
with
a
binocular
microscope
fitted
with
a
’drawing
tube’
and
a
digitizing
tablet
coupled
to
a
computer.
The
individual
ring-width
series
were
crossdated
using
a
moving
graphic
program
after
progressive
detecting
of
so-called
’pointer
years’.
The
mean
ring-width
series
(the
average
of
2
cores
per
tree)
was
calculated
and
used
in
the
following
data-processing
stages.
The
’pointer
years’ were
defined
as
those
calendar
years
when
at
least
70%
(or
80%
for
the
’special
pointer
years’)
of
the
rings
were
at
least
10%
narrower
or
wider
than
the
previous
year.
Two
competition
indices,
Cd for
ring
width
and
Ch
for
tree
height,
were
defined
in
order
to
com-
pensate
for
the
effect
of
the
different
competition
situations
among
the
trees.
The
methods
used
for
calculating
these
indices
has
been
published
separately
(Becker,
1992).
It
is
based
on
the
hypothesis
that
the
H/D
ratio
of
a
tree
depends
on
its
average
competition
status
in
the
past,
but
is
largely
independent
of
the
ecological
site
condi-
tions.
H/D
is
also
closely
related
to
age,
in
accor-
dance
with
the
following
model:
The
indices
Cd and
Ch
are
determined from
the
relationships:
Cd
x D
= Dr and
Ch
x H
Hr,
where
Hr and
Dr are
the
dimensions
of
a
refer-
ence
tree
that
would
be
of
the
same
age
and
characterized
by
an
average
competition
status.
Hr and
Dr are
unknown,
but the
Hr/Dr ratio
can
be
calculated
according
to
[1].
Thus,
Cd/Ch
is
well
defined,
and
called
alpha.
A
simple
model
is
used
to
obtain
the
competition
indices:
Cd
=
alpha
0.7
and
Ch
=
alpha
-0.3
.
Coefficients
a
and
b
were
determined
separately
for
sessile
oak
and
pedunculate
oak.
The
Cd
index
was
then
calculated
for
each
sample
tree
and
used
to
com-
pensate
the
BAI
series.
Each
tree
is
assumed
to
always
have
been
subject
to
the
same
degree
of
competition,
given
that
the
trees
are
the
same
age
in
the
whole
sample.
This
is
generally
the
case
with
the
dominant
trees
in
an
even-aged
high
forest
and
with
the
standards
in
a
coppice-
with-standards.
Although
the
whole
BAI
series
of
a
tree
is
multiplied
by
a
constant,
given
that
the
present
age
of
the
trees
in
the
whole
sample
is
very
varied,
the
mean
chronologies
calculated
subsequently
may
be
more
or
less
strongly
affected.
Two
methods
were
used
to
detect
possible
long-term
trends
in
radial
growth.
Firstly,
for
a
given
cambial
age
class,
the
aver-
age
radial
growth
was
calculated
for
all
those
cal-
endar
years
when
at
least
4
annual
BAIs
were
available.
It
was
then
plotted
vs
calendar
year.
This
was
repeated
for
10
cambial
age
classes
from
10
(±2)
to
100
(±2)
years.
The
drawback
to
this
method
is
the
low
number
of
tree
rings
cor-
responding
to
each
date
for
a
given
cambial
age.
On
the
other
hand,
it
can
reveal
possible
long-
term
trends
directly
from
the
raw
data
(Becker,
1987;
Briffa,
1992)
without
preliminary
’stan-
dardization’,
which
is
a
more
complicated
and
somewhat
disputable
operation.
Secondly,
the
effect
of
cambial
age
on
BAI
was
taken
into
account
using
the
following
stan-
dardization
method
(Becker,
1989).
The
average
BAI
curve
according
to
the
cambial
age
(current
age)
was
constructed
for
both
species.
As
vary-
ing
site
conditions
and
varying
calendar
years
of
formation
of
the
annual
rings
corresponded
to
every
current
year
in
the
curve,
the
effects
of
the
various
environmental
conditions
tended
to
can-
cel
each
other
out.
In
addition,
the
curve
was
bal-
anced
so
as
to
take
into
account
the
different
number
of
available
annual
rings
for
every
pair
’cambial
age-calendar
year’,
and
this
balanced
curve
was
fitted
to
a
curvilinear
model
[2].
The
model
had
to
be
as
simple
as
possible
and
con-
vincing
from
a
biological
point
of
view.
Growth
indices
(IC0),
expressed
in
%,
were
calculated
for
each
individual
radial
growth
series
as
the
ratio
of
each
actual
BAI
versus
the
reference
value
of
model
[2].
The
average
curve
of
these
growth
indices
according
to
calendar
years
was
calculated
with
the
aim
of
determining
the
progression
of
radial
growth
over
time
and
detecting
possible
growth
crises,
long-term
trends,
etc.
Other
kinds
of
curve
could
also
be
calculated,
eg,
separate
curves
for
the
growth
indices
of
the
’young’
(<
60
years)
and
the ’old’
(>
65
years)
rings
(cambial
age).
In
the
final
stage,
the
curve
of
the
growth
indices
IC0
was
modelled
according
to
the
availa-
ble
meteorological
parameters,
using
a
linear
regression
model.
The
meteorological
data
con-
sisted
of
monthly
precipitation
values
(P)
and
average
monthly
temperatures
(T)
from
a
mete-
orological
station
in
Nancy-Essey.
This
station
is
situated
only
12
km
from
the
forests
under
study,
and
meteorological
data
have
been
collected
there
since
1881.
Inclusion
of
the
change
in
atmo-
spheric
CO
2
concentration
over
time
(Neftel
et
al,
1985;
Keeling,
1986)
has
also
proved
useful.
The
dependent
variable
was
the
growth
index,
IC0,
of
year
y.
In
addition
to
the
predictors
P,
T
and
CO
2,
the
growth
index
IC1
of
year
(y-
1)
was
included
when
studying
the
autocorrelation
problems
that
are
common
in
time
series
analy-
ses
(Monserud,
1986).
A
standard
method
was
used
involving
stepwise
multiple
linear
regres-
sion,
which
provides
correlation
functions
(Fritts,
1976;
Cook
et al,
1987;
Peterson
et al,
1987).
The
explained
variance
is
calculated
in
each
step
k,
and
the
residuals
of
the
regression
are
analysed
using
the
F
ratio:
where
SCR
k
=
sum
of
square
residuals
in
step
k,
SCRk-1
=
sum
of
square
residuals
in
step
k -
1;
S2
=
SCR
k
/(n-
k -
1);
and
n
= number
of
years
analysed.
F
is
then
compared
with
Snedecor’s
table
levels.
RESULTS
Pointer
years
Practically
speaking,
there
were
no
real
missing
rings
in
the
initial
data,
although
some
rings
were
very
narrow
and
especially
hard
to
distinguish.
This
was
rather
sur-
prising
when
we
consider
the
situation
for
silver
fir
in
a
nearby
region,
where
31%
of
the
trees
had
real
missing
rings
(Becker,
1989).
The
years
with
a
strong
relative
growth
increase
or
decrease
are
presented
in
table
I.
These
pointer
years
reveal
the
great
sim-
ilarity
between
the
2
species.
They
are
more
common
in
the
case
of
sessile
oak,
but
most
of
the
additional
years
occur
prior
to
1870,
and
thus
must
be
related
to
the
structure
of
the
sample;
old
trees
(more
than
150
years)
are
more
common
in
the
case
of
sessile
oak
(n
= 71)
than
in
the
case
of
pedunculate
oak
(n
= 33).
However,
there
is
a
clear
differ-
ence
between
the
2
species
when
the
num-
ber
of
’special
pointer
years’ for
an
increase
and
those
for
a
decrease
are
compared.
The
ratio
of
special
pointer
years
versus
all
pointer
years
is
57%
(increase)
and
48%
(decrease)
for
sessile
oak,
and
29%
(increase)
and
60%
(decrease)
for
pedun-
culate
oak.
The
competition
correction
index
The
estimates
of
model
[1]
are:
Sessile
oak
Pedunculate
oak
The
averages
of
Cd are
close
to
unity:
0.974
(sd
= 0.096)
for sessile
oak
(extremes:
0.68
and
1.31)
and
0.986
(sd
=
0.083)
for
pedunculate
oak
(extremes:
0.66
and
1.32).
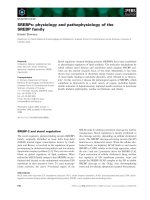
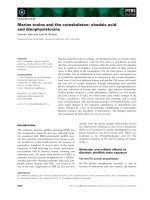
The
development
of
radial
growth
in
different
cambial
age
classes
Ten
figures
were
constructed
for
the
fol-
lowing
cambial
classes
(±
2
years):
10, 20,
100
years.
The
number
of
rings
older
than
100
years
was
too
small
for
deter-
mining
possible
trends.
Most
of
these
fig-
ures
indicated
a
clear
increase
during
the
last
century,
especially
for
sessile
oak
(figs
1
and
2).
A
linear
regression
was
performed
for
each
cluster
of
points
in
order
to
quantify
this
increase.
The
mean
relative
increase
in
BAI
during
the
last
100
years
is
67%
for
sessile
oak
and
40%
for
pedunculate
oak
(table
II).
Moreover,
it
tends
to
be
lower
for
higher
cambial
ages.
However,
this
primar-
ily
concerns
pedunculate
oak,
in
which
growth
increase
is
no
longer
significant
at
cambial
ages
higher
than
60
years.
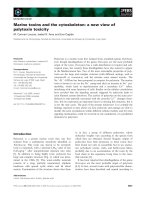
1980,
the
mean
BAI
of
pedunculate
oak
was
higher
than
that
of
sessile
oak
for
cambial
ages
of
10
to
70
years
(+
16%
on
average),
but
then
decreased
(fig
3).
At
the
age
of
100
years,
the
BAI
of
both
species
was
still
increasing.
Mean
annual
BAI
according
to
cambial
age
The
mean
evolution
of
BAI
as
a
function
of
cambial
ring
age
is
very
similar
for
both
species
(fig
4),
although
the
BAI
of
pedun-
culate
oak
is
consistently
slightly
higher
(from
2
to
3
cm
2
).
The
relatively
important
fluctuations
observed
after
the
age
of
150
years
are
due
to
a
rapid
decrease
in
the
number
of
very
old
tree
rings.
The
same
type
of
exponential
model
has
been
defined
using
a
curvilinear
regression
on
both
species:
Sessile
oak
Pedunculate
oak
These
2
adjustments
have
been
used
to
standardize
the
raw
data,
ie to
convert
them
into
growth
indices
that
can
be
studied
with-
out
reference
to
their
cambial
age.
Development
of growth
indices
according
to
the
calendar
year
The
growth
indices
clearly
confirm
the
pre-
ceding
results,
ie
a
strong
increase
for
ses-
sile
oak
(fig
5a)
as
well
as
for
pedunculate
oak
(fig
5b).
The
growth
increase
of
sessile
oak
(+64%
between
1888
and
1987,
signif-
icant
at
p
=
0.05)
is
always
stronger
than
that
of
pedunculate
oak
(+40%,
significant
at
p
=
0.05).
There
are
strong
interannual
fluc-
tuations,
among
which
can
be
found
all
of
the
pointer
years
discussed
earlier.
More-
over,
some
’crises’,
ie
longer
or
shorter
peri-
ods
(from
5
to
10
years)
of
steeper
or
slighter
growth
decline,
are
apparent,
eg,
1838-1848, 1879-1898, 1899-1910, 1917-
1924,
1938-1946,
and,
especially,
1971-
1982.
The
difference
in
behaviour
of
the
2
oak
species
with
regard
to
cambial
age
shown
in
table
II
suggests
a
separation
in
the
growth
indices
of ’young’ rings,
ie
less
than
60
years
(fig
6),
and
’old’
rings,
ie
more
than
65
years
(fig
7).
The
increase
in
the
young
rings
of
sessile
oak
is
+
81
%
(significant
at
p
=
0.05),
and
that
of
pedunculate
oak
+
49%
(signif-
icant
at
p
=
0.05).
The
increase
in
the
old
rings
is
respectively
+
48%
(significant
at
p
=
0.05),
and
only
+
15%
(not
significant
at
p
= 0.05).
Modelling
the
annual
growth
index
As
the
long-term
increase
in
radial
growth
is
approximately
linear
for
both
species
and
the
increase
in
atmospheric
CO
2
is
practi-
cally
exponential,
the
logarithm
of
CO
2,
LN(CO
2)
has
been
used
as
a
predictor
in
the
regressions.
Moreover,
preliminary
cal-
culations
have
shown
that
low
(below
0°C)
temperatures
in
wintertime
depress
growth
during
the
next
vegetation
period.
In
order
to
gain
a
better
picture
of
this
phenomenon,
already
detected
for
silver
fir
in
northeastern
France
(Becker,
1989),
a
variable
LN
(T
+
10)
was
utilized
in
the
following
calcu-
lations
for
January
and
February.
The
autocorrelation,
which
is
largely
expressed
by
the
correlation
between
IC0
and
IC1,
was
strong
for
both
oak
species,
r
=
0.583
for
sessile
oak
and
r =
0.612
for
pedunculate
oak.
This
has
encouraged
us
to
search
for
and
quantify
the
possible
lag
effects
of
certain
meteorological
events
that
occur
before
the
formation
of
a
tree
ring
(year
y).
In
fact,
such
lag
effects
have
been
verified
back
until
year
y -
4
for
sessile
oak
and
y -
5
for
pedunculate
oak.
The
exis-
tence
of
these
lag
effects
multiplies
the
num-
ber
of
potential
predictors.
It
thus
becomes
highly
probable
that
a
certain
number
of
apparently
statistically
significant
correla-
tions
will
occur
by
chance
even
though
they
are
not
biologically
meaningful
(Verbyla,
1986).
First,
we
employed
a
somewhat
empirical
approach
to
distinguish
’significant’
vari-
ables.
This
consisted
of
evaluating
the
bio-
logical
relevance
and
the
overall
consis-
tency
of
the
variables
in
the
final
model,
especially
when
lag
effects
were
detected.
The
case
of
July
is
special,
and
is
discussed
later.
The
variance
explained
amounts
to
78.3%
for
sessile
oak
with
21
predictors
(table
III),
and
to
74.3%
for
pedunculate
oak
with
24
predictors
(table
IV).
Figure
8
shows
the
estimated
growth
indices
compared
with
the
actual
indices
for
sessile
oak.
The
cor-
responding
curve
for
pedunculate
oak
was
essentially
similar.
We
then
attempted
to
validate
the
mod-
els.
This
was
done
by
dividing
the
total
avail-
able
period
(1881-1987)
into
a
calibration
period
(1881-1960)
and
a
verification
period
(1961-1987)
(Cook
et al,
1987).
The
first
period
made
it
possible
to
elaborate
a
tem-
porary
version
of
the
model,
using
the
same
variables
as
in
the
previous
one,
and
this
second
model
was
then
applied
to
the
sec-
ond
period.
This
procedure
resulted
in
a
sat-
isfactory
similarity
between
the
2
models;
before
1960
as
well
as
after
1960,
and
for
sessile
oak
(fig
9)
as
well
as
for
pedunculate
oak.
The
proportion
of
variance
explained
increases
progressively
as
the
years
prior
to
y are
taken
into
account
in
the
models
(fig
10) ,
although
more
rapidly
for
sessile
oak
than
for
pedunculate
oak.
Simultaneously,
the
weight
of
IC1
(autocorrelation)
decreases
and
tends
towards
0
for
both
species.
DISCUSSION
The
mean
annual
basal
area
increment
(BAI)
according
to
cambial
age
of
both
oak
species
continues
to
increase
after
an
age
of
150
years,
when
it
amounts
to
about
15
cm
2.
This
result
is
significantly
different
when
compared
to
coniferous
tree
species,
espe-
cially
silver
fir,
in
which
BAI
was
found
to
reach
a
maximum
at
the
age
of
50
and
then
to
decrease
slowly
(Bert
and
Becker,
1990).
This
simple
observation
provides
support
for
the
usual
French
silvicultural
practice
of
planning
the
final
felling
of
oak
for
an
age
of
150-200
years
or
more,
while
that
of
sil-
ver
fir
is
much
earlier
(100-120
years).
According
to
an
opinion
widely
held
in
France,
the
use
of
dendrochronology
in
eco-
physiological
studies
(dendroecology)
is
mainly
applicable
to
mountain
coniferous
species,
especially
in
the
case
of
open
stands
in
which
competition
among
the
trees
is
low.
The
high
number
of
pointer
years
found
in
the
present
study,
and
the
strong
climatic
determinism
of
these
years,
empha-
size
that
broadleaved
species,
even
in
dense
stands,
can
be
fruitfully
investigated
by
dendroecological
methods.
This
is
par-
ticularly
true
for
oaks
(both
sessile
and
pedunculate),
which
rank
among
the
major
broadleaved
trees
used
for
timber
produc-
tion
in
western
Europe.
In
the
case
of
pedunculate
oak,
the
num-
ber
of
pointer
years
highly
characteristic
of
a
growth
decrease
was
about
twice
that
for
a
growth
increase.
In
contrast,
the
respective
numbers
were
approximately
equal
for
ses-
sile
oak.
This
suggests
that
sessile
oak
is
able
to
recover
more
rapidly
than
peduncu-
late
oak
after
stresses
that
lead
to
a
growth
decrease.
Such
a
difference
between
the
2
species
is
consistent
with
the
longer
and
stronger
after-effects
of
unfavourable
cli-
matic
events
found
for
pedunculate
oak
compared
to
sessile
oak
(fig
10).
Unfavourable
events
of
this
sort
(mainly
hot
and
dry
periods),
responsible
for
severe
growth
decreases,
occurred
during
the
last
century,
principally
in
1917-1924,
1938-1946
and
1971-1982
(fig
5).
In
fact,
these
crises
fit
precisely
the
main
declines
which
old
oak
stands
(more
than
80-100
years)
suffered
from
in
many
regions
in
western
Europe
(Delatour,
1983),
but
which
only
proved
fatal
to
pedunculate
oak
(Becker
and
Lévy,
1982).
Irrespective
of
the
method
used
for
pro-
cessing
the
data,
there
is
clear
evidence
of
a
long-term
increase
in
radial
growth
in
both
species
for
more
than
a
century
(table
II,
fig
5).
However,
this
increase
is
higher
for
ses-
sile
oak
(+64%)
than
for
pedundulate
oak
(+40%).
Moreover,
the
difference
between
the
2
species
is
even
clearer
when
we
com-
pare
the
BAI
of
the ’old’
rings,
ie
more
than
65
years
(fig
7),
which
show
that
the
increase
is
no
longer
significant
in
pedun-
culate
oak,
while
it
is
still
high
(+48%)
in
sessile
oak.
It
thus
appears
that,
unlike
ses-
sile
oak,
pedunculate
oak
(more
precisely
the
mature
trees)
have
not
benefited
from
the
progressive
environmental
changes
of
the
last
100-150
years.
This
last
result
seems
to
be
consistent
with
the
greater
sus-
ceptibility
of
pedunculate
oak
to
growth
declines.
Furthermore,
it
reinforces
a
recent
hypothesis
suggesting
a
slow
but
general
retreat
of
pedunculate
oak
in
favour
of
ses-
sile
oak
in
many
regions
of
France
(Becker
and
Levy,
1982).
Except
for
the
precipitations
in
year
y-
4
and
the
temperatures
in
year
y-
5,
which
express
the
longer
lag
effects
discussed
above
for
pedunculate
oak,
the
significant
predictors
retained
are
the
same
in
both
models
(tables
III
and
IV).
The
case
of
July
appears
somewhat
dis-
concerting
because
the
related
parameters
from
years
y,
y-
1
and
y-
3
on
the
hand,
and
years
y-
2
and
y-
4
on
the
other,
can
be
given
opposing
biological
meanings.
This
could
be
an
artifact
due
to
the
large
num-
ber
of
potential
predictors.
However,
the
corresponding
values
of
the
partial
F rank
among
the
more
significant
in
the
models.
An
alternative
explanation
could
involve
spe-
cific
patterns
for
shoot
and
root
growth:
the
poor
water
supply
conditions
in
July
of
year
y
(low
precipitation
and/or
high
tempera-
ture)
would
result
in
decreased
shoot
growth
during
years
y and
y+
1.
In
contrast,
these
conditions
would
stimulate
root
growth
dur-
ing
year
y
which,
in
turn,
would
result
in
increased
shoot
growth
during
year
y
+
2.
This
sort
of
alternate
effect
would
persist
until
year
y +
3
in
sessile
oak,
and
y +
4 in
pedunculate
oak.
It
was
eventually
decided
to
keep
these
variables
in
the
models.
The
interpretation
of
the
other
climatic
variables
is
much
easier.
A
very
low
tem-
perature
in
January
has
a
negative
influence
on
the
growth
during
the
following
growing
season,
but
there
are
no
longer
lag
effects.
Sessile
oak
is
more
sensitive
to
this
vari-
able,
which
is
consistent
with
its
reputation
as
a
slightly
more
thermophilous
species.
High
precipitation
in
May,
June
and
August
(or
low
temperatures,
which
correlate
positively
with
precipitation
during
these
months)
are
favourable
for
growth.
Lag
effects
are
apparent
for
May
and
August
only,
but
not
for
June,
for
which
no
clear
explanation
was
found.
The
case
of
July
was
discussed
above.
The
negative
effect
of
high
precipitation
(or
low
temperatures)
in
March
and
low
tem-
peratures
in
April
may
be
explained
by
2
complementary
theories:
firstly
the
related
shortening
of
the
growing
season;
secondly,
and
more
importantly,
the
unfavourable
effects
of
an
excess
of
water
on
the
soil
structure
and
on
the
rooting
of
the
trees
owing
to
the
impermeability
of
the
subsoil.
Of
the
recent
dendroecological
studies
that
demonstrate
a
long-term
increase
in
the
wood
production
rate
of
forest
ecosys-
tems,
some
tend
to
dismiss
the
direct
role
of
atmospheric
CO
2
(Becker,
1989;
Graum-
lich
et al,
1989).
On
the
other
hand,
they
cannot
exclude
the
indirect
role
of
CO
2
on
climate
(Wigley
et al,
1984).
In
the
present
study,
the
climate
variability
alone
appears
to
be
insufficient
to
explain
the
trends
observed,
especially
in
sessile
oak.
More-
over,
CO
2
appears
to
be
the
most
impor-
tant
predictor
principally
explaining
the
long-
term
growth
increase
observed.
However,
caution
is
necessary
in
interpreting
this
result,
which,
strictly
speaking,
does
not
prove
a
pure
causal
relationship.
CO
2
could
be
partly
responsible
for
the
trends
observed,
but
some
other
variables
which
vary
in
time
in
a
similar
manner
to
CO
2
may
also
be
important.
It
may
not
be
possible
to
include
these
in
the
models
because
of
the
lack
of
historical
data:
for
example,
atmo-
spheric
anthropogenic
deposits,
especially
of
nitrogen
compounds
(Kenk
and
Fischer,
1988).
Recent
studies
conclude
that
the
CO
2
concentration
will
probably
double
by
the
year
2050,
which
might
lead
to
increased
wood
productivity
in
boreal
and
temperate
forest
ecosystems
(Pastor
and
Post,
1988).
In
the
case
of
sessile
oak
in
western
Europe
(and
assuming
that
the
model
in
table
III
is
real
and
can
be
extrapolated),
the
growth
rate
could
rise
from
140%
in
1988
(fig
5a)
to
280%
in
2050,
ie
exactly
double.
However,
such
a
long-term
forecast
appears
rather
unlikely
because
the
climatic
conditions
will
probably
change
as
well
and
become
incompatible
with
the
ecological
require-
ments
of
oak.
Perhaps
the
first
signs
of this
incompatibility
are
already
perceptible
in
pedunculate
oak,
through
its
present
response
to
climatic
factors
and
atmo-
spheric
CO
2.
REFERENCES
Becker
M
(1987)
Bilan
de
santé
actuel
et
rétrospectif
du
sapin
(Abies
alba
Mill)
dans
les
Vosges.
Etude
écologique
et
dendrochronologique.
Ann
Sci
For 44,
379-402
Becker
M
(1989)
The
role
of
climate
on
present
and
past
vitality
of
silver
fir
forests
in
the
Vosges
moun-
tains
of
northeastern
France.
Can
J
For
Res
19,
1110-1117
Becker
M
(1992)
Deux
indices
de
compétition
pour
la
comparaison
de
la croissance
en
hauteur
et
en
diamètre
d’arbres
aux
passés
sylvicoles
variés
et
inconnus.
Ann
Sci
For 49,
25-37
Becker
M,
Levy
G
(1982)
Le
dépérissement
du
chêne
en
forêt
de
Tronçais.
Les
causes
écologiques.
Ann
Sci
For 39, 439-444
Becker
M,
Lévy
G
(1982)
Le
point
sur
l’écologie
com-
parée
du
chêne
sessile
et
du
chêne
pédonculé.
Rev
For Fr 42,
148-154
Bert
GD,
Becker
M
(1990)
Vitalité
actuelle
et
passée
du
sapin
(Abies
alba
Mill)
dans
le
Jura.
Etude
den-
droécologique.
Ann
Sci
For 47,
395-412
Briffa
KR
(1992)
Increasing
productivity
of ’natural
growth’
conifers
in
Europe
over
the
last
century.
In:
Tree
rings
and
Environment
Proc
Intern
Dendrochrono-
logical
Symp,
Ystad,
Sweden,
3-9
Sept
1990.
Lundqua
Report 34,
64-71
Cook
ER,
Johnson
AH,
Blasing
TJ
(1987)
Forest
decline:
modeling
the
effect
of
climate
in
tree
rings.
Tree
Physiol 3,
27-40
d’Arrigo
R,
Jacoby
GC,
Fung
IY
(1987)
Boreal
forests
and
atmosphere-biosphere
exchange
of
carbon
diox-
ide.
Nature
(Lond)
239,
321-323
Delatour
C
(1983)
Les
dépérissements
de
chênes
en
Europe.
Rev
For
Fr 35,
265-282
Federer
CA,
Tritton
LM,
Hornbeck
JW,
Smith
RB
(1989)
Physiologically
based
dendroclimate
models
for
effects
of
weather
on
red
spruce
basal-area
growth.
Agric
For
Meteorol 46,
159-172
Fritts
HC
(1976)
Tree
rings
and
climate.
Academic
Press,
New
York
Graumlich
LJ,
Brubaker
LB,
Grier
CC
(1989)
Long-term
trends
in
forest
net
primary
productivity:
Cascade
Mountains,
Washington.
Ecology 70,
405-410
Hari
P,
Arovaara
H,
Raunemaa
T,
Hautojärvi
A
(1984)
Forest
growth
and
the
effects
of
energy
production:
a
method
for
detecting
trends
in
the
growth
potential
of
trees.
Can
J
For
Res
14,
437-440
Jordan
DN,
Lockaby
BG
(1990)
Time
series
modelling
of
relationships
between
climate
and
long-term
radial
growth
of
loblolly
pine.
Can
J
For
Res
20, 738-742
Jozsa
LA,
JM
Powell
(1987)
Some
climatic
aspects
of
biomass
productivity
of
white
spruce
stem
wood.
Can
J
For
Res
17, 1075-1079
Keeling
CD
(1986)
Atmospheric
CO
2
concentrations.
Mauna
Loa
Observatory,
Hawai
1958-1986.
NDP-
001/R
1. Carbon
Dioxide
Information
Analysis
Center.
Oak
Ridge
National
Laboratory,
Oak
Ridge,
TN,
USA
Kenk
G,
Fischer
H
(1988)
Evidence
from
nitrogen
fertil-
ization
in
the
forests
of
Germany.
Env
Poll 54,
199-218
Kenk
G,
Rommel
WD,
Spiecker
H
(1989)
Weitere
Ergeb-
nisse
zum
aktuellen
und
früheren
Wachstumsver-
halten
von
Fichten
KiK-PEF 50,
117-126
Lamarche
VC,
Graybill
DA,
Fritts
HC,
Rose
MR
(1984)
Increasing
atmospheric
carbon
dioxide:
tree
ring
evi-
dence
for
growth
enhancement
in
natural
vegeta-
tion.
Science 225, 1019-1021
Monserud
RA
(1986)
Time-series
analyses
of
tree-ring
chronologies.
For Sci 32, 349-372
Nertel
A,
Moor
E,
Oeschger
H,
Stauffer
B
(1985)
Evi-
dence
from
polar
ice
cores
for
the
increase
in
atmo-
spheric
CO
2
in
the
past
two
centuries.
Nature
(Lond)
315, 45-47
Nieminen,
TM
(1988)
Étude
dendroécologique
du
chêne
(pédonculé
et
sessile)
et
du
hêtre
dans
une
forêt
de
la
plaine
lorraine.
Diplôme
d’Études
Approfondies,
Université
de
Nancy
Pastor
J,
Post
WM
(1988)
Response
of
northern
forests
to
CO
2
-induced
climate
change.
Nature
(Lond)
334,
55-58
Payette
S,
Filion
L,
Gauthier
L,
Boutin
Y
(1985)
Secular
climate
change
in
old
growth
tree-line
of
northern
Québec.
Nature
(Lond)
315,
135-138
Peterson
DL,
Arbaugh
MJ,
Wakefield
VA,
Miller
PR
(1985)
Evidence
of
growth
reduction
in
ozone-injured
Jeffrey
pine
(Pinus jeffreyi
Grev
and
Balf)
in
Sequoia
and
Kings
Canyon
national
parks.
J
Air
Poll
Control
Assoc
37, 906-912
Peterson
DL,
Arbaugh
MJ,
Robinson
LJ,
Derderian
BR
(1990)
Growth
trends
of
whitebark
pine
and
lodge-
pole pine
in
a
subalpine
Sierra
Nevada
forest,
Cali-
fornia,
USA.
Arct
Alp
Res
22,
233-243
Verbyla
D
(1986)
Potential
prediction
bias
in
regression
and
discriminant
analysis.
Can
J For
Res
16, 1255-
1257
Wagener
K,
de
Luca
Rebello
A,
Hollstein
E
(1983)
Increasing
productivity
in
recent
European
oak
trees.
Radiat
Environ
Biophys
22, 303-310
Wigley
TM,
Briffa
KR,
Jones
PD
(1984)
Predicting
plant
productivity
and
water
resources.
Nature
(Lond)
312,
102-103