Báo cáo y học: "Assessing post-traumatic stress disorder in South African adolescents: using the child and adolescent trauma survey (CATS) as a screening tool" docx
Bạn đang xem bản rút gọn của tài liệu. Xem và tải ngay bản đầy đủ của tài liệu tại đây (289.28 KB, 10 trang )
BioMed Central
Page 1 of 10
(page number not for citation purposes)
Annals of General Psychiatry
Open Access
Primary research
Assessing post-traumatic stress disorder in South African
adolescents: using the child and adolescent trauma survey (CATS)
as a screening tool
S Suliman
1
, D Kaminer
2
, S Seedat*
1
and DJ Stein
1
Address:
1
MRC Unit on Anxiety and Stress Disorders, Department of Psychiatry, University of Stellenbosch, Tygerberg, 7505, Cape Town, South
Africa and
2
Department of Psychology, University of Cape Town, Private Bag Rondebosch, 7700, Cape Town, South Africa
Email: S Suliman - ; D Kaminer - ; S Seedat* - ; DJ Stein -
* Corresponding author
traumapost-traumaticstressassessmentinstruments
Abstract
Background: Several studies have demonstrated that South African children and adolescents are
exposed to high levels of violent trauma with a significant proportion developing PTSD, however,
limited resources make it difficult to accurately identify traumatized children.
Methods: A clinical interview (K-SADS-PL, selected modules) and self-report scale (CATS) were
compared to determine if these different methods of assessment elicit similar information with
regards to trauma exposure and post-traumatic stress disorder (PTSD) in adolescents. Youth (n =
58) from 2 schools in Cape Town, South Africa participated.
Results: 91% of youth reported having been exposed to a traumatic event on self-report (CATS)
and 38% reported symptoms severe enough to be classified as PTSD. On interview (K-SADS-PL),
86% reported exposure to a traumatic event and 19% were found to have PTSD. While there were
significant differences in the rates of trauma exposure and PTSD on the K-SADS and CATS, a cut-
off value of 15 on the CATS maximized both the number of true positives and true negatives with
PTSD. The CATS also differentiated well between adolescents meeting DSM-IV PTSD symptom
criteria from adolescents not meeting criteria.
Conclusions: Our results indicate that trauma exposure and PTSD are prevalent in South African
youth and if appropriate cut-offs are used, self-report scales may be useful screening tools for
PTSD.
Introduction
Adolescence is a critical developmental period that may
also be characterized as a period of great risk to healthy
development [1]. Adolescents are often subjected to a
multitude of traumatic events in their daily lives. Those
who are victimised and/or traumatised often lag behind
those who are not, in terms of their behavioural and phys-
ical growth [2]. PTSD is one syndrome that may result
from exposure to extreme trauma and is characterized by
persistent reexperiencing, avoidance/numbing, and
Published: 31 January 2005
Annals of General Psychiatry 2005, 4:2 doi:10.1186/1744-859X-4-2
Received: 31 May 2004
Accepted: 31 January 2005
This article is available from: />© 2005 Suliman et al; licensee BioMed Central Ltd.
This is an Open Access article distributed under the terms of the Creative Commons Attribution License ( />),
which permits unrestricted use, distribution, and reproduction in any medium, provided the original work is properly cited.
Annals of General Psychiatry 2005, 4:2 />Page 2 of 10
(page number not for citation purposes)
hyperarousal symptoms, present for more than one
month and associated with significant distress and/or
functional impairment [3].
Although community violence is highly prevalent in
South Africa, a lack of awareness that children and adoles-
cents may be adversely affected both in the short- and
long- term [4], has contributed to a dearth of systematic
data on youth exposed to violence and PTSD. Much of the
work done has focused on the impact of political violence
in the 1980's [5,6]. Although politically inspired violence
has been in decline, criminal and domestic violence con-
tinues to prevail in local communities [7,8]. This has seen
large numbers of children and adolescents being exposed
to, and directly involved in, acts of violence [4]. For exam-
ple, Peltzer's study on rural children in South Africa found
that 67% had directly or vicariously experienced a trau-
matic event (elicited from direct interviewing of the child
or from parent report) while 8% fulfilled criteria for PTSD
[9].
Studies in the Western Cape have also noted high rates of
traumatisation and PTSD among youth. In Cape Town, a
retrospective chart review found PTSD to be one of the
most common disorders at the Child and Adolescent Psy-
chiatry Unit at Tygerberg Hospital [10]. In a community
study in Khayelitsha, Ensink, Robertson, Zissis and Leger
[11] used self-report measures to determine exposure to
violence, as well as structured questionnaires and non-
standardized clinical assessments to elicit symptoms and
make psychiatric diagnoses in children aged 6 to 16 years.
All children reported exposure to indirect violence.
Ninety-five percent had witnessed violent events, 56%
had experienced violence themselves, and 40% met the
criteria for one or more DSM-III-R diagnoses. 22% met
criteria for PTSD. The most commonly reported PTSD
symptoms were: avoidance of thoughts and activities
associated with the trauma, difficulties in sleeping, and
hypervigilance.
A recent school survey of 307 Grade Ten pupils in the
Western Cape, found that adolescents reported an average
of 3.5 childhood traumatic experiences, and 12.1% met
DSM-IV criteria for PTSD on self-report measures [12].
The most commonly reported symptoms were: avoiding
thoughts about the event (34.4%), irritability (28.2%),
difficulty showing emotion (26.5%), emotional upset at
being reminded of the trauma (24.9%), and intrusive rec-
ollections of the event (19.4%). A significant positive cor-
relation between multiple trauma exposure and PTSD
symptoms was also found.
These aforementioned studies suggest that South African
children, as a whole, are exposed to high levels of trauma
and that a significant proportion develop PTSD. In order
to develop preventative and ameliorative strategies for
dealing with trauma, reliable and valid measurements of
posttraumatic stress responses are needed. Although sev-
eral instruments for assessing childhood disorders and
symptoms have been developed over the past two decades
[13], most have originated in the United States [14]. PTSD
assessment instruments need preferably to be standard-
ized in local samples to improve detection of the disorder.
In South Africa, increasingly limited resources such as few
school psychologists and large classrooms make it diffi-
cult to accurately identify traumatized children. Neverthe-
less, identification of children at risk for PTSD post-
trauma may lead to the more efficient use of resources that
are currently available.
The present study compared the psychometric properties
of two instruments designed to assess trauma exposure
and PTSD symptomatology and asked the question: " Do
the K-SADS (a diagnostic clinical interview) and the CATS
(a self-report scale) elicit similar information with regards
to rates of trauma exposure and PTSD symptoms in a sam-
ple of South African adolescents?"
Methodology
Sample
A random sample of Grade 11 adolescents (n = 67) was
selected from two Cape Town schools (36 from school A
and 31 from school B). Of the 67 who were selected, 58
(17 males and 41 females) agreed to participate. Their
mean age was 16 years, 8 months (SD: 0.59; range: 16–18
years). All spoke English as a first language. The majority
of participants were non-White (n = 39 Coloured, n = 1
Asian, n = 18 White). The schools selected had partici-
pated in an aforementioned school survey of three
schools that were conveniently sampled. Anonymous self-
report questionnaires of trauma exposure and PTSD
symptoms were utilized [12]. Lack of resources (time and
money) did not allow for all participants in that study to
be included in the present one.
Instrumentation
1. Demographic Questionnaire
This was clinician-administered and devised for the
present study. It included information on age, sex, resi-
dential address, parental marital status, and occupation.
2. Kiddie Schedule for Affective Disorders and Schizophrenia for
School-Age Children – Present and Lifetime Version (K-SADS-PL)
[15]
The K-SADS-PL is a standardised, DSM-IV based, clinician
administered diagnostic interview, designed to provide an
overview of current and lifetime psychopathology [16].
The K-SADS-PL has demonstrated good reliability and
validity [17]. Abrosini [18] reported inter-rater reliability
of 0.67 and 0.60 for current and lifetime PTSD,
Annals of General Psychiatry 2005, 4:2 />Page 3 of 10
(page number not for citation purposes)
respectively. Construct validity [18] and criterion validity
[19] have also been established.
Based on DSM-III-R and DSM-IV criteria, the K-SADS-PL
has an initial 82 item screen interview that surveys key
symptoms for current and past episodes of twenty differ-
ent diagnostic areas, some of which screen for multiple
disorders. Symptoms that have been present in the previ-
ous two months are recorded as current. For the purpose
of this study, in order to make the K-SADS comparable to
the CATS, PTSD symptoms judged to have been present in
the past month were recorded as 'current'. Furthermore,
only the PTSD and depression sections of the K-SADS-PL
were administered.
The screen interview and diagnostic supplement format is
unique to the K-SADS-PL and greatly facilitates adminis-
tration of the instrument with normal controls and
patient populations [16]. Most items on the K-SADS are
rated on a zero to three point scale with a score of zero
indicating no information is available; '1' suggesting the
symptom is not present; '2' indicating sub-threshold lev-
els of symptomatology; and '3' representing threshold cri-
teria [15]. The Clinician-Administered PTSD Scale (CAPS-
CA), arguably the current "gold standard" clinical inter-
view for childhood PTSD, was not chosen for this study as
it does not make use of screening questions for PTSD and
is too lengthy to administer.
Although the K-SADS is designed to be administered to
both parent and participant, it was administered to partic-
ipants only. The reasons for this are twofold. First, our
sample comprised older adolescents (16 to 18 years of
age) and it was felt that the information gathered would
be reasonably reliable. Second, as the primary objective of
our study was to directly compare a clinician-assessment
with a self-report, we did not consider it imperative that
parental collateral be obtained. Previous studies have
noted that parents may not always be aware of what their
children are experiencing and may, therefore, not always
be accurate historians [20].
3. Child and Adolescent Trauma Survey (CATS) [21])
The CATS is a self-report index of PTSD qualifying stres-
sors, non-PTSD life events, and PTSD symptoms. It is also
a self-report measure of PTSD modelled on the Multidi-
mensional Anxiety Scale for Children (MASC) [22] and
the DSM-IV criteria for PTSD. The CATS is, however, not a
DSM score scale but is derived using Item Response The-
ory (IRT). It includes stable indices of non-PTSD life
events and provides a reliable and valid survey of second-
ary adversities, PTSD qualifying stressors, as well as a psy-
chometrically sound symptom scale [21].
Unlike other self-rating scales, the CATS includes both a
trauma exposure list and a PTSD inventory. Most self-rat-
ing scales focus on one or the other. The trauma list
includes both direct (happened to me) and vicarious
(happened to someone I know well) lifetime exposure.
For example, the participant is required to indicate if s/he
or someone s/he knows well has been badly beaten, or has
been kidnapped during the participant's lifetime. Partici-
pants were also asked to note which was the worst event
experienced and to report PTSD symptoms, experienced
in the last month, in relation to this event.
In the PTSD section, participants are asked to rate how
often in the past month they have had experiences that
inventory the major symptom domains of PTSD – reexpe-
riencing, avoidance and hyperarousal – on a four-point
Likert scale. For example, participants are asked to indi-
cate how often they are jumpy and nervous, or how often
they sleep poorly – never, rarely, sometimes or often. Each
of the DSM-IV PTSD criterion variables is represented by
at least two questions [22].
According to March [23] a score of 27 and above on the
PTSD scale should be taken to indicate that a child is at
risk of clinically significant levels of PTSD. The CATS
shows excellent internal [22] and test-retest reliability
(March and Amaya-Jackson, unpublished data, 1997, [in
[24]]).
Neither the K-SADS nor the CATS has been cross-cultur-
ally validated. However, the K-SADS is widely used inter-
nationally as a diagnostic measure in children and
adolescents.
Procedures
Permission to carry out the study was obtained from the
Western Cape Department of Education and the Ethics
Committees of the Universities of Stellenbosch and Cape
Town. Consent from the heads of schools, parent bodies,
and parents and learners was also obtained. Learners and
their parents/guardians were informed that participation
was entirely voluntary. Consent forms were handed to
parents/guardians for signing prior to the interviews.
Learners who opposed participation, or whose parents/
guardians opposed participation, were excluded.
All evaluations were conducted in private in rooms allo-
cated by school staff. The order of administration of the
CATS and K-SADS was counterbalanced to control for
practice effects. The evaluation per participant took
approximately 45 minutes.
Data Analysis
Microsoft Excel and Statistica software were used for data
analysis. Student t-tests were used to determine
Annals of General Psychiatry 2005, 4:2 />Page 4 of 10
(page number not for citation purposes)
significances for numeric data. The difference of two pro-
portions test and the McNemar chi-square test were used
to determine significances for categorical data. Cohen's
kappa coefficients (K) were used to measure the level of
agreement between the measures. As initial analysis
revealed a statistically significant difference and low level
of agreement between the measures, a more sensitive cut-
off point was established for the CATS using a Receiver
Operator Characteristic (ROC) Analysis.
Results
Exposure to Traumatic Events
On interview (Table 1), 86% of participants reported life-
time exposure to at least 1 traumatic event, (mean = 2.3;
SD = 1.7; range = 0–10), while on self-report (Table 2),
91% of participants reported direct or indirect lifetime
exposure to at least 1 traumatic event (mean = 3.7; SD =
3.2; range = 0–14). The difference of two proportions test
revealed that the number of participants who reported
experience of a traumatic event on each measure was not
significantly different (p = 0.36). The level of agreement
between the measures was 0.74 (SE = 0.15; CI = 0.46–
1.0). These events were random, rather than politically-
motivated experiences of trauma.
Differences in Reporting of Trauma Exposure Between
Measures
When both direct ("happened to me") and vicarious
("happened to someone I know well") trauma exposure
on the CATS was considered, significantly more traumas
were endorsed on the CATS (mean = 3.7) than on the K-
SADS (mean = 2.3) (t = -3.94; p = < 0.01). However, when
vicarious exposure was excluded on the CATS, the number
of traumas reported on the K-SADS was significantly
higher (t = 5.68; p = < 0.01).
PTSD Diagnoses
11 participants (19%) received a diagnosis of PTSD on the
K-SADS, while only 1 participant (1.7%) received a diag-
nosis of PTSD on the CATS using a cut-off of 27, as sug-
gested by March [23]. This difference was significant (χ
2
=
50.3; p < 0.01) with the level of agreement between the
Table 1: Frequencies of reported traumas on the K-SADS
Event Number %
Car accident 4 6.9
Other accident 9 15.5
Fire 2 3.4
Witness of a disaster 4 6.9
Witness of a violent crime 14 24.1
Victim of a violent crime 6 10.3
Confronted with traumatic news 33 56.9
Witness to domestic violence 18 31
Physical abuse 2 3.4
Sexual abuse 5 8.6
Other 11 19
(n = 58)
Table 2: Frequencies of reported traumas on the CATS
Event Happened to Me Happened to Someone I Know Well
Number % Number %
Badly bitten by a dog or another animal 8 13.8 15 25.9
Badly scared or hurt by a gang or criminal 4 6.9 17 29.3
Badly beaten 1 1.7 14 24.1
Shot or stabbed 0 0 16 27.6
Terrible fire or explosion 0 0 7 12.1
Chemical or other deadly poisoning 1 1.7 4 6.9
Bad storm, flood, tornado, hurricane or earthquake 2 3.4 6 10.3
Bad car, boat, bike, train, or plane accident 3 5.2 18 31
Other very bad accident 5 8.6 9 15.5
Got sick and almost died or died 5 8.6 28 48.3
Kidnapped or held captive 0 0 5 8.6
Suicide attempt or died from suicide 4 6.9 19 32.8
I was taken away from my family 1 1.7
I saw something terrible happen to a stranger 16 27.6
Other shocking or terrifying event 5 8.6 2 3.4
(n = 58)
Annals of General Psychiatry 2005, 4:2 />Page 5 of 10
(page number not for citation purposes)
measures (K) being 0.14 (SE = 0.25; CI = -0.35–0.62).
Three participants diagnosed with PTSD(27.3%) on the K-
SADS appeared to have developed it in response to sexual
assault trauma, as did the one participant screened with
PTSD on the CATS.
ROC Analysis
Given the low level of agreement using a CATS cut-off of
27, an ROC analysis (Table 3) was done in order to estab-
lish a CATS cut-off score that would be more appropriate
for the sample. First, using the K-SADS as the "gold"
standard for a diagnosis of PTSD (a measure that identi-
fies those individuals who have or do not have a disor-
der), the sensitivity and specificity for various CATS cut-
off scores were established. In addition to sensitivity (the
proportion of true positives that are test positives [true
positive probability]) and specificity (the proportion of
true negatives that are test negatives [true negative proba-
bility]); '1 – specificity' (false positive probability), the gra-
dients between each point, and the positive and negative
predictor values were calculated (the predictive value of a
positive test is the proportion of those with a positive test
result who actually have the disorder, while the predictive
value of a negative test is the proportion of those with a
negative test result who do not have the disorder).
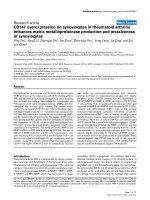
An ROC curve graph (sensitivity and 1 – specificity) was
also plotted (Figure 1). The area under the curve (sensitiv-
ity of the scale) was found to be 0.805. A cut-off that gives
a gradient closest to 1 is usually chosen as appropriate
because it maximises both sensitivity and specificity. With
a cut-off of 15, 22 participants had scores indicative of
PTSD on the CATS. However, the difference between the
number of participants diagnosed with PTSD on the K-
SADS and the CATS remained significant (χ
2
= 19.9; p <
0.01). While significance was in the expected direction
(i.e. the prevalence on self-report was higher than on
interview), but the level of agreement was doubled (K =
0.31; SE = 0.14; CI = 0–0.59).
A t-test comparing the scalar scores of participants with a
PTSD diagnosis on the K-SADS (mean = 18.5, SD = 7.8)
and participants without a PTSD diagnosis (mean = 10.4,
SD = 6.4) showed the difference between the two meas-
ures to be significant (t = 3.64; p < 0.01).
PTSD Symptom Clusters
On the K-SADS, 18 participants met DSM-IV criteria for
re-experiencing symptoms (Criterion B), 15 participants
met criteria for avoidance symptoms (Criterion C), and
18 participants met criteria for hyperarousal symptoms
Table 3: Receiver Operator Characteristic (ROC) and Predictive Values
Cut-off Values Sensitivity Specificity 1-specificity Gradient Predictive Values
Positive Negative
0 100 0 100
1 100 2 98 0 22 100
3 100 17 83 0 22 100
4 9121792.252191
5 912377 0 2292
7 912872 0 2393
8 913268 0 2494
9 913664 0 2594
10 82 36 64 ∞ 23 90
11 82 40 60 0 24 91
12 82 47 53 0 27 92
13 82 53 47 0 29 93
14 82 62 38 0 33 94
15 73 70 30 1.12 36 92
16 64 81 19 0.82 44 91
17 64 87 13 0 44 91
18 55 87 13 ∞ 50 89
19 55 92 8 0 60 90
20 55 94 6 0 67 90
21 55 98 2 0 86 90
22 55 100 0 0 100 90
23 36 100 0 ∞ 100 87
25 18 100 0 ∞ 100 84
27 9 100 0 ∞ 100 83
Annals of General Psychiatry 2005, 4:2 />Page 6 of 10
(page number not for citation purposes)
(Criterion D). Since the CATS is not a DSM-IV PTSD score
scale, the number of participants meeting individual
DSM-IV criteria could not be established. However, the
CATS does include six items for Criterion B, two for Crite-
rion C, and four for Criterion D, so a scalar score for each
of these factors could be derived. Student t-tests compar-
ing mean Criterion B, C, and D CATS scalar scores for par-
ticipants fulfilling criteria B, C, and D, respectively, on the
K-SADS, with those not meeting criteria, revealed signifi-
cant differences for all three symptom clusters at the 0.05
level. The Criterion B mean scalar score for participants
meeting Criterion B on the K-SADS was 7.3 (SD = 4.3)
compared to 4.8 (SD = 3.1) for those not meeting criteria
(t = -2.45; p = 0.02). Participants with Criterion C on the
K-SADS had a mean scalar score of 3.9 (SD = 1.8), while
those not meeting Criterion C had a mean score of 2.2
(SD = 2.0) (t = -3.12; p = 0.03). The mean scalar score for
participants meeting Criterion D was 5.1 (SD = 3.3) com-
pared to a mean score of 3.1 for those not meeting this cri-
terion (SD = 2.5) (t = -2.50; p = 0.02).
PTSD Symptoms
Table 4 compares the percent endorsement of PTSD
symptoms on the K-SADS and the CATS. Student t-tests
were used to compare number of symptoms reported on
the K-SADS (mean = 3.3, SD = 5.0) with number of symp-
toms reported on the CATS (mean = 3.7, SD = 2.8). No
significant differences were noted (t = -0.83; p = 0.41).
Kappa's were then done to measure the level of agreement
between the measures for symptoms that could be directly
compared for the sample as a whole, and for participants
with and without PTSD on the K-SADS (Table 5). Items
assessing sleep problems, distress at reminders of event,
and exaggerated startle responses evidenced the best
agreement across instruments.
Participants with and without a diagnosis of PTSD based
on the K-SADS were compared on percentage endorse-
ment of each CATS symptom. The difference of two pro-
portions test showed a significant difference in only five of
the twelve symptoms (recurrent thoughts about the event,
exaggerated startle response, difficulty concentrating,
avoidance of physical reminders of the event, and night-
mares). The other symptoms did not discriminate well
between participants with and without PTSD.
Internal Consistency
Alphas of 0.96, 0.97 and 0.93 were obtained for the K-
SADS PTSD Criterion B, C, and D respectively. These were
ROC curveFigure 1
ROC curve
Scatterplot of 1-specificity by sensitivity
0
20
40
60
80
100
020406080100
1-specificity
sensitivity
Annals of General Psychiatry 2005, 4:2 />Page 7 of 10
(page number not for citation purposes)
not improved by the removal of any items within a symp-
tom category (Criterion B, C, and D).
Alphas of 0.79 and 0.67 were obtained for Criteria B and
D in the CATS, which were not improved by the removal
of any items. An alpha was not calculated for Criterion C
as there are only two items comprising that category.
A total internal consistency of 0.99 was obtained for the
PTSD section of the K-SADS and a total internal consist-
ency of 0.86 was obtained for the CATS.
Discussion
Compared with other international community-based
studies [e.g. [25,26]], our study found high rates of
trauma exposure on both clinician-administered and self-
report measures in adolescents, with the majority (86%
on the KSADS and 91% on the CATS) reporting exposure
to at least one traumatic event in their lifetime. These rates
are consistent with previous South African studies [e.g.
[12]].
Consistency in reporting of traumatic events was low
between the measures and participants were more likely
to endorse a trauma on the CATS than on the K-SADS.
This may be attributable to the fact that more vicarious
traumatisation as compared to directly experienced or wit-
nessed traumas is asked about in the CATS, or to the rela-
tive privacy of the self-report format- participants may
have felt more comfortable in admitting to traumatic
experiences on a self-report scale which may be perceived
as less intrusive [27].
19% of adolescents in the sample were diagnosed with
PTSD on the K-SADS. This rate is comparable with the
PTSD rate found in a larger sample of adolescents who
were sampled in the same geographical region [28]. The
rate of 19% is, however, higher than that documented in
a previous survey of which this sample constituted a sub-
sample [12] The passage of time (i.e. more than a year
between assessments) may be one reason for the higher
rate of PTSD in the sub-sample. Most other South African
community-based studies in adolescents (with the excep-
tion of a study by Ensink et al. [11], that have used self-
Table 4: PTSD symptoms
Rate of PTSD symptoms on the K-SADS Rate of PTSD symptoms on the CATS
symptom % symptom %
Comparable Symptoms
Recurrent thoughts or images of events 28 I go over and over what happened in my mind 40
Efforts to avoid thoughts or images associated with the
trauma
28 I try not to think about what happened 47
Insomnia 22 I sleep poorly 26
Irritability or outbursts of anger 24 I am grouch and irritable 36
Distress at reminders of event 16 When something reminds me of what happened I get
tense and upset
21
Exaggerated startle response 17 I am jumpy and nervous 29
Nightmares 16 I have bad dreams about what happened 9
Difficulty concentrating 19 I have trouble keeping my mind on things 28
Efforts to avoid activities or situations that arouse
recollections of the trauma
21 I try to stay away from things that remind me of what
happened
21
Non-comparable Symptoms
Sense of foreshortened future 3 I worry that what happened will happen again 57
Feelings of detachment or estrangement 21 I get scared when I think about what happened 38
Inability to recall important aspects of the trauma 10 I have unwanted thoughts about what happened 21
Restricted affect 28
Hypervigilance 17
Physiological reactivity upon exposure to reminders 9
Dissociative episodes, illusions or hallucinations 21
Diminished interest in activities 22
Repetitive play related to event / reenactment 2
Annals of General Psychiatry 2005, 4:2 />Page 8 of 10
(page number not for citation purposes)
report measures of assessment, have documented lower
rates of PTSD than was found in this study.
The differing rates of PTSD between the K-SADS and the
CATS (using a cut-off 27 on the CATS), suggests that this
cut-off may be too high in our setting. The ROC analysis
yielded a cut-off of 15 on the CATS. This cut-off maxi-
mizes both the number of true positives and true nega-
tives and may be more appropriate. Using a cut-off of 15,
22 participants (38%) were diagnosed with PTSD. While
there still remained significant differences in the rates of
PTSD using this cut-off, the level of diagnostic agreement
was higher than with a cut-off of 27. Our findings are con-
sistent with studies that have demonstrated that self-
report measures [e.g. [29,30]] yield higher rates of psychi-
atric diagnoses than clinician-based interviews [e.g.
[25,27]]. Moreover, significant differences in CATS sever-
ity scores between participants with and without PTSD,
suggests that the CATS discriminates well between those
with and without the disorder.
Further, significant differences were found between mean
CATS scores for Criterion B (intrusive), C (avoidance),
and D (hyperarousal) symptoms between participants
meeting DSM-IV criteria for these clusters on the K-SADS,
and those not meeting criteria. The two symptoms that
were most frequently endorsed on both the K-SADS and
the CATS (recurrent thoughts/ images of event and efforts
to avoid thoughts of the event) are also among the symp-
toms most frequently reported in other studies [11,12],
suggesting that careful inquiry of these symptoms is
important. However, the level of agreement for specific
symptoms appeared to be suboptimal: overall, partici-
pants who reported symptoms on the K-SADS did not
necessarily report the same symptoms on the CATS. That
said, participants with PTSD were more consistent in their
reporting than those without PTSD. Nevertheless, the lack
of significant differences in the numbers of symptoms
reported between the measures suggests that these meas-
ures may be comparable in eliciting the average number
of symptoms experienced post-trauma. The CATS
appeared to discriminate well between those with and
Table 5: Levels of agreement for comparable PTSD symptoms
PTSD Symptom 95% Confidence Interval
Observed Kappa Standard Error Lower Limit Upper Limit
Recurrent thoughts or images of event (i) 0.02 0.14 -0.31 0.26
(ii) -0.57 0.22 -1.01 -0.13
(iii) 0.01 0.18 -0.33 0.35
Trying not to think about the event (i) 0.25 0.13 -0.003 0.51
(ii) -0.14 0.56 -1.24 0.96
(iii) 0.07 0.17 -0.26 0.41
Sleep problems (i) 0.44 0.15 0.15 0.72
(ii) 0.61 0.25 0.11 1
(iii) 0.16 0.23 -0.3 0.62
Anger and irritability (i) 0.24 0.14 -0.05 0.52
(ii) 0.24 0.3 -0.35 0.83
(iii) 0.13 0.19 -0.24 0.49
Distress at reminders of event (i) 0.48 0.16 0.17 0.79
(ii) 0.44 0.28 -0.1 0.98
(iii) 0.17 0.29 -0.4 0.74
Exaggerated startle response (i) 0.39 0.15 0.09 0.68
(ii) 0.3 0.35 -0.38 0.98
(iii) 0 0.3 -0.59 0.59
Nightmares (i) 0.2 0.23 -0.26 0.65
(ii) 0.23 0.26 -0.28 0.73
(iii) -0.05 0.45 -0.93 0.82
Difficulty concentrating (i) 0.19 0.17 -0.04 0.51
(ii) 0.35 0.26 -0.15 0.86
(iii) 0.03 0.23 -0.41 0.48
Efforts to avoid reminders of event (i) 0.27 0.15 -0.03 0.56
(ii) -0.31 0.3 -0.89 0.28
(iii) 0.34 0.18 -0.02 0.7
(i) Total sample (N = 58); (ii) Participants with PTSD on the K-SADS (N = 11);
(iii) Participants without PTSD on the K-SADS (N = 47).
Annals of General Psychiatry 2005, 4:2 />Page 9 of 10
(page number not for citation purposes)
without PTSD on five of twelve items (recurrent thoughts
about the event, exaggerated startle response, difficulty
concentrating, avoidance of physical reminders of the
event, and nightmares), suggesting that these symptoms
may be more sensitive indicators of PTSD.
General Implications of Findings
The K-SADS and CATS yield different information about
the level and type of trauma exposure, therefore research-
ers and clinicians should be cautious when substituting
one for the other. The K-SADS is likely to yield more
detailed information on witnessing traumatic events,
while the CATS is likely to yield more information on
vicarious trauma exposure. Adolescents are also more
likely to endorse a trauma on the CATS than they are on
the K-SADS. The significantly larger proportion of adoles-
cents with scores indicative of PTSD on the CATS, com-
pared to the K-SADS, indicates that the CATS may be
better utilized as a PTSD screening device (as suggested by
its author), with a cut-off threshold of 15 instead of the
original threshold of 27, in the South African context. This
will identify over one third of all participants with PTSD
while making few false positive identifications. This will,
however, require replication in a larger South African
cohort. For an actual PTSD diagnosis, a clinician-based
diagnostic interview may be more appropriate even
though it is likely to be more time consuming.
Several limitations are worth mentioning. First, the K-
SADS was not administered to both parents and learners
as it is intended to be, thus participants' responses were
not verified by collateral information from parents and
legal guardians. Second, the sample comprised predomi-
nantly female adolescents of mixed race. Even though this
constitutes the majority ethnic group in the province, the
small sample and truncated age limits the generalizability
to the larger population. Further, socio-demographic var-
iables (e.g. social class, family income and race) were not
accounted for in the analysis. Third, cultural influences
may favour certain symptoms of trauma over others [31]
and it has been noted that there is a need to identify other
post-traumatic expressions of distress, such as somatiza-
tion [32,33]. Both the K-SADS and the CATS do not
attempt to capture these experiences. However, PTSD has
been widely documented in traumatized cohorts from dif-
ferent ethnocultural backgrounds and those from non-
Western cultures who meet PTSD diagnostic criteria often
show a similar clinical course and response to treatment
[33]. Fourth, we used the DSM-IV concept of trauma to
compare these instruments and some authors, for exam-
ple Summerfield [34], have highlighted some of the diffi-
culties with the concept of trauma as defined in the DSM.
It may be that events counted and endorsed as traumas
were too broad to ascertain their level of agreement on the
K-SADS and the CATS. Fifth, while we attempted to com-
pare traumatic events and symptoms across instruments,
it must be noted that these instruments are not necessarily
suited to direct comparison. For example, the two instru-
ments measure different traumatic events, automatically
placing a cap on the level of agreement.
In view of the high levels of violence in South African
youth, identification of those children and adolescents
with PTSD is important and necessary to allow for appro-
priate interventions. Owing to limited resources, adminis-
tration of diagnostic clinical interviews to all youth is not
feasible. Self-report scales, even though they do not
replace clinical interviews, may be useful in identifying
those youth in the community who are most at risk. This
may help to facilitate more targeted and efficient
treatments. While this study has limitations, some
tentative conclusions can nevertheless be drawn. High
rates of trauma exposure and PTSD characterize South
African children and adolescents. Self-report scales may
be better utilized as screening instruments rather than as
diagnostic tools. To establish more efficient ways of diag-
nosing PTSD and other post-traumatic sequelae in the
South African setting, future studies (using self-rating
scales and brief PTSD diagnostic measures) should be
conducted in larger samples, more representative of the
South African population. In particular, we need to estab-
lish and verify more suitable cut-off values on these
instruments to enable the identification of those children
and adolescents who are at higher risk for PTSD and other
disorders.
Competing Interests
The author(s) declare that they have no competing
interests.
Acknowledgements
This work is supported by the Medical Research Council (MRC) Unit on
Anxiety and Stress Disorders, Department of Psychiatry, University of
Stellenbosch.
References
1. Takanishi R: The opportunities for adolescents – research,
interventions, and policy. American Psychologist 1993, 48:85-87.
2. Schurink WJ, Snyman I, Krugel WF, Slabbert L: Victimisation: nature and
trends Pretoria: HSRC 1992.
3. American Psychiatric Association: Diagnostic and statistical manual of
mental disorders 4th edition. Washington DC: Author; 1994.
4. Smith C, Holford : Post-traumatic stress disorder: South
Africa's children and adolescents. Southern African Journal of Child
and Adolescent Psychiatry 1993, 5:57-69.
5. Dawes A, Tredoux C: Emotional status of children exposed to
political violence in the Crossroads squatter area during
1986/1987. Psychology in Society 1989, 12:33-47.
6. Dawes A, Tredoux C, Feinstein A: Political violence in South
Africa: Some effects on children of the violent destruction of
their community. International Journal of Mental health 1989,
18:16-43.
7. Hamber B: "Have no doubt it is fear in the land": an explora-
tion of the continuing cycles of violence in South Africa.
Southern African Journal of Child and Adolescent Mental Health 2000,
12:5-18.
Publish with BioMed Central and every
scientist can read your work free of charge
"BioMed Central will be the most significant development for
disseminating the results of biomedical research in our lifetime."
Sir Paul Nurse, Cancer Research UK
Your research papers will be:
available free of charge to the entire biomedical community
peer reviewed and published immediately upon acceptance
cited in PubMed and archived on PubMed Central
yours — you keep the copyright
Submit your manuscript here:
/>BioMedcentral
Annals of General Psychiatry 2005, 4:2 />Page 10 of 10
(page number not for citation purposes)
8. Lockhat R, van Niekerk A: South African children: a history of
adversity violence and trauma. Ethnicity and Health 2000,
5:291-302.
9. Peltzer K: Posttraumatic stress symptoms in a population of
rural children in South Africa. Psychological Reports 1999,
85:646-650.
10. Traut A, Kaminer D, Boshoff D, Seedat S, Hawkridge S, Stein DJ:
Treatment utilization and trauma characteristics of child
and adolescent inpatients with posttraumatic stress
disorder. Curationis 2002, 25:67-72.
11. Ensink K, Robertson BA, Zissis C, Leger P: Post-traumatic stress
disorder in children exposed to violence. South African Medical
Journal 1997, 87:1526-1530.
12. Seedat S, van Nood E, Vythilingum B, Stein DJ, Kaminer D: School
survey of exposure to violence and posttraumatic stress
symptoms in adolescents. Southern African Journal of Child and Ado-
lescent Mental Health 2000, 12:38-44.
13. American Academy of Child and Adolescent Psychiatry: Practice
parameters for the psychiatric assessment of children and
adolescents. Journal of the American Academy of Child and Adolescent
Psychiatry 1995, 34:1386-1405.
14. Randall R, Parker J: Post-traumatic stress disorder and children
of school age. Educational Psychology in Practice 1997, 13:197-203.
15. Kaufman J, Birmaher B, Brent D, Rau U, Ryan N: Schedule for Affective
Disorders and Schizophrenia for School-Age Children (6–18 years)- Present
and Lifetime version The Department of Psychiatry: University of Pitts-
burg School of Medicine; 1996.
16. Kaufman J, Birmaher B, Brent D, Ryan N, Rau U: K-SADS-PL. Journal
of the American Academy of Child and Adolescent Psychiatry 2000,
39:1208.
17. Perrin S, Smith P, Yule W: Practitioner review: The assessment
and treatment of post-traumatic stress disorder in children
and adolescents. Journal of Child Psychology and Psychiatry 2000,
41:277-286.
18. Ambrosini PJ: Historical development and present status of
the Schedule for Affective Disorders and Schizophrenia for
School-Age Children (K-SADS). Journal of the American Academy
of Child and Adolescent Psychiatry 2000, 39:49-58.
19. Kaufman J, Birmaher B, Brent D, Rau U, Flynn C, Moreci P, William-
son D, Ryan N: Schedule for Affective Disorders and Schizo-
phrenia for School-Age Children- Present and Lifetime
version (K-SADS-PL): initial reliability and validity data. Jour-
nal of the American Academy of Child and Adolescent Psychiatry 1997,
36:980-987.
20. Pfefferbaum B: Post-traumatic stress disorder in children: a
review of the past 10 years. Journal of the American Academy of Child
and Adolescent Psychiatry 1997, 36:1503-1511.
21. March J: Assessment of pediatric Post-traumatic stress disor-
der. In Post-traumatic stress disorder Edited by: Saigh P, Bremner D.
Washington, DC: American Psychological Press; 1999:199-218.
22. March JS, Amaya-Jackson L, Terry R, Costanzo P: Posttraumatic
symptomatology in children and adolescents after an indus-
trial fire. Journal of the American Academy of Child and Adolescent
Psychiatry 1997, 36:1080-1088.
23. March J: Personal communication 2001.
24. March JS, Amaya-Jackson L, Murray MC, Shulte A: Cognitive-behav-
ioral therapy for children and adolescents with post-trau-
matic stress disorder after a single incident stressor. Journal of
the American Academy of Child and Adolescent Psychiatry 1998,
37:585-593.
25. Giaconia RM, Reinherz HZ, Silverman AB, Pakiz B, Frost AK, Cohen
E: Traumas and Posttraumatic stress disorder in a commu-
nity population of older adolescents. Journal of the American Acad-
emy of Child and Adolescent Psychiatry 1995, 34:1369-1380.
26. Mazza JJ, Reynolds WM: Exposure to violence in young inner-
city adolescents: Relationship with suicidal ideation, depres-
sion, and PTSD symptomatology. Journal of Abnormal Child
Psychology 1999, 27:203-213.
27. Cuffe SP, Addy CL, Garrison CZ, Waller JL, Jackson KL, McKeown
RE, Chilappagari S: Prevalence of PTSD in a community sample
of older adolescents. Journal of the American Academy of Child and
Adolescent Psychiatry 1998, 41:277-286.
28. Seedat S, Nyamai F, Njenga B, Vythilingum B, Stein DJ: Trauma
exposure and post-traumatic stress symptoms in urban Afri-
can schools. British Journal of Psychiatry 2004, 184:169-175.
29. Fitzpatrick KM, Boldizar JP: The prevalence and consequences of
exposure to violence among African-American youth. Journal
of the American Academy of Child and Adolescent Psychiatry 1993,
32:424-430.
30. Wright Berton M, Stabb DS: Exposure to violence and Posttrau-
matic stress disorder in urban adolescents. Adolescence 1996,
31:489-498.
31. Terr LC: Acute responses to external events and Posttrau-
matic stress disorders. In Child and adolescent psychiatry: a compre-
hensive textbook Edited by: Lewis M. New Haven, Connecticut:
Williams & Wilkins; 1991.
32. Friedman MJ: Posttraumatic stress disorder. Journal of Clinical
Psychiatry 1997, 58:33-36.
33. Marsella AJ: Ethnocultural aspects of post-traumatic stress disorder: Issues,
research and clinical applications Washington DC: American Psycholog-
ical Association; 1996.
34. Summerfield D: The invention of post-traumatic stress disor-
der and the social usefulness of a psychiatric category. British
Medical Journal 2001, 322:95-98.