Building the Data Warehouse Third Edition phần 7 docx
Bạn đang xem bản rút gọn của tài liệu. Xem và tải ngay bản đầy đủ của tài liệu tại đây (571.2 KB, 43 trang )
redundant detailed data is a very undesirable condition for the detailed level of
data in the data warehouse and defeats its purpose. If multiple development
groups will be doing concurrent design and population in the current level of
detail, great care must be taken to ensure that no redundant detailed data is
created.
To ensure that no redundant data is developed, it is necessary to create a data
model that reflects the common detailed data. Figure 6.32 shows that multiple
development groups have combined their interests to create a common data
model. In addition to the currently active development groups, other groups
that will have future requirements but who are not currently in a development
mode may also contribute their requirements. (Of course, if a group knows it
will have future requirements but is unable to articulate them, then those
requirements cannot be factored into the common detailed data model.) The
common detailed data model reflects the collective need among the different
groups for detailed data in the data warehouse.
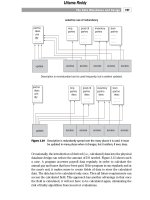
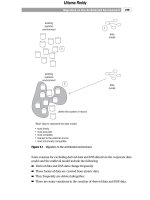
The data model forms the basis of the design for the data warehouse. Fig-
ure 6.33 shows that the data model will be broken up into many tables as design
progresses, each of which physically becomes part of the warehouse.
Because the data model is broken into multiple physical tables at the moment
of implementation, the development process for the data warehouse can pro-
ceed in an iterative manner. There is no need to build all of the tables at once.
In fact, a good reason to build only a few tables at a time is so that the end user
CHAPTER 6
236
development
group A
development
group B
development
group C
development
group D
development
group E
Figure 6.31 Different development groups that are developing the current level of
detail for the data warehouse.
Uttama Reddy
The Distributed Data Warehouse
237
data unique to
development
group A
data unique to
development
group B
data unique to
development
group C
data unique to
development
group D
common
data model
data common to
development
groups A, B, C, D
Figure 6.32 A data model identifies data that is common to all the development
groups.
customer
movement
history
sales
history
vendor
history
parts
history
customer
survey
history
substitute
part
history
customer
history
sales
pricing
history
shipment
history
customer
complaint
history
parts
reject
history
shipment
arrival
history
shipment
breakage
history
common
data model
Figure 6.33 The data warehouse is physically manifested over multiple physical tables
and databases.
Uttama Reddy
feedback can be factored into the modification of the table, if necessary, with a
minimum of fuss. In addition, because the common data model is broken into
multiple tables, adding new tables at a later time to reflect requirements that
are now unknown is not a problem.
Different Requirements
at Different Levels
Normally different groups have unique requirements (see Figure 6.34). These
requirements result in what can be termed “local” current-level detail. The local
data is certainly part of the data warehouse. It is, however, distinctively differ-
ent from the “common” part. The local data has its own data model, usually
much smaller and simpler than the common detailed data model.
There is, of necessity, nonredundancy of data across all of the detailed data.
Figure 6.35 makes this point clear.
Of course, the nonredundancy of the data is restricted to nonkey data. Redun-
dancy exists at the key level because a form of foreign key relationships is used
to relate the different types of data. Figure 6.36 shows the use of foreign keys.
The foreign keys found in the tables shown in Figure 6.36 are quite different
from the classical foreign key relationships that are governed by referential
integrity. Because the data in the data warehouse is gathered by and stored in
CHAPTER 6
238
data unique to
development
group A
data unique to
development
group B
data unique to
development
group C
data unique to
development
group D
common
data model
data common to
development
groups A, B, C, D
local current
level detail
Figure 6.34 Just because data is not common to all development groups does not
mean that it does not belong in the current-level detail of the data ware-
house.
TEAMFLY
Team-Fly
®
Uttama Reddy
terms of snapshots of data, the foreign key relationships that are found are
organized in terms of “artifacts” of relationships. For an in-depth explanation of
artifacts of relationships, refer to the www.billinmon.com Tech Topic on the
subject, found in the “References” section.
An issue that arises is whether to place all of the detailed tables—common and
local—under the same technology, as shown in Figure 6.37. There are many
good arguments for doing so One is that the cost of a single platform versus
multiple platforms is much less. Another is that the cost of support and training
will be less. In fact, about the only argument for multiple platforms for detailed
data is that with multiple platforms, there may not be the need for a single mas-
sively large platform, and as a consequence, the cost of the multiple smaller
platforms may be less than a single larger platform. In any case, many organi-
zations adopt the strategy of a single platform for all their detailed data ware-
house data, and the strategy works well.
Other Types of Detailed Data
Another strategy is to use different platforms for the different types of data
found at the detailed level. Figure 6.38 shows one example of this option. Some
of the local data is on one platform, the common data is on another platform,
and other local data is on yet another. This option is certainly one that is valid,
The Distributed Data Warehouse
239
customer
movement
history
sales
history
vendor
history
parts
history
customer
survey
history
substitute
part
history
customer
history
sales
pricing
history
shipment
history
customer
complaint
history
parts
reject
history
shipment
arrival
history
shipment
breakage
history
Figure 6.35 Nonredundancy of nonkey data throughout the many tables that make up
the detailed level of the data warehouse.
Uttama Reddy
and it often satisfies the different political needs of the organization. With this
option each group doing development can feel that it has some degree of con-
trol of at least its own peculiar needs. Unfortunately, this option has several
major drawbacks. First, multiple technologies must be purchased and sup-
ported. Second, the end user needs to be trained in different technologies. And
finally, the boundaries between the technologies may not be as easy to cross.
Figure 6.39 illustrates this dilemma.
CHAPTER 6
240
key
foreign key
foreign key
vendor
history
key
foreign key
shipment
history
key
foreign key
foreign key
sales
history
key
foreign key
foreign key
parts
history
key
foreign key
customer
history
Figure 6.36 Foreign keys in the data warehouse environment.
Uttama Reddy
The Distributed Data Warehouse
241
data unique to
development
group A
data unique to
development
group B
data unique to
development
group C
data unique to
development
group D
data common to
development
groups A, B, C, D
common technological platform
Figure 6.37 The different types of data in the detailed level of the data warehouse all
on a common platform.
data unique to
development
group A
data unique to
development
group B
data unique to
development
group C
data unique to
development
group D
data common to
development
groups A, B, C, D
platform A
platform B
platform C
Figure 6.38 In this case, the different parts of the detailed level of the data warehouse
are scattered across different technological platforms.
Uttama Reddy
If there are to be multiple technologies supporting the different levels of detail
in the data warehouse, it will be necessary to cross the boundaries between the
technologies frequently. Software that is designed to access data across differ-
ent technological platforms is available. Some of the problems that remain are
shown in Figure 6.40.
One problem is in the passage of data. If multi-interfaced technology is used for
the passage of small amounts of data, then there is no problem with perfor-
mance. But if multi-interfaced technology is used to pass large amounts of data,
then the software can become a performance bottleneck. Unfortunately, in a
DSS environment it is almost impossible to know how much data will be
accessed by any one request. Some requests access very little data; other
requests access large amounts of data. This problem of resource utilization and
management manifests itself when detailed data resides on multiple platforms.
CHAPTER 6
242
data unique to
development
group A
data unique to
development
group B
data unique to
development
group C
data unique to
development
group D
data common to
development
groups A, B, C, D
platform A
platform B
platform C
data transfer
Figure 6.39 Data transfer and multiple table queries present special technological
problems.
Uttama Reddy
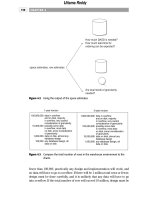
Another related problem is “leaving” detailed data on one side of the data ware-
house after it has been transported from the other side. This casual redeploy-
ment of detailed data has the effect of creating redundancy of data at the
detailed level, something that is not acceptable.
The Distributed Data Warehouse
243
platform B
platform A
platform C
bulk transfer of data
leaving data after analysis is complete
Figure 6.40 Some problems with interfacing different platforms.
customer
complaint
history
shipment
history
customer
movement
history
sales
history
vendor
history
parts
history
customer
history
sales pricing
history
meta data
Figure 6.41 Meta data sits on top of the actual data contents of the data warehouse.
Uttama Reddy
Meta Data
In any case, whether detailed data is managed on a single technology or on mul-
tiple technologies, the role of meta data is not diminished. Figure 6.41 shows
that meta data is needed to sit on top of the detailed data warehouse data.
Multiple Platforms for Common Detail Data
One other possibility worth mentioning is using multiple platforms for common
detail of data. Figure 6.42 outlines this scenario.
While such a possibility is certainly an option, however, it is almost never a
good choice. Managing common current detailed data is difficult enough. The
volumes of data found at that level present their own unique problems for man-
agement. Adding the complication of having to cross multiple technological
platforms merely makes life more difficult. Unless there are very unusual miti-
gating circumstances, this option is not recommended.
The only advantage of multiple platforms for the management of common
detail is that this option satisfies immediate political and organizational differ-
ences of opinion.
CHAPTER 6
244
platform A platform B platform C
common data across many
development groups
current detailed data
Figure 6.42 Common detailed data across multiple platforms-a real red flag in all cases.
Uttama Reddy
Summary
Most environments operate from a single centralized data warehouse. But in
some circumstances there can be a distributed data warehouse. The three types
of distributed data warehouses are as follows:
■■
Data warehouses serving global businesses where there are local opera-
tions and a central operation
■■
Technologically distributed data warehouses where the volume of data is
such that the data is spread over multiple physical volumes
■■
Disparate data warehouses that have grown separately through lack of
organizational or political alignment
Each type of distributed data warehouses has its own considerations.
The most difficult aspect of a global data warehouse is the mapping done at the
local level. The mapping must account for conversion, integration, and differ-
ent business practices. The mapping is done iteratively. In many cases, the
global data warehouse will be quite simple because only the corporate data that
participates in business integration will be found in the global data warehouse.
Much of the local data will never be passed to or participate in the loading of
the global data warehouse. Access of global data is done according to the busi-
ness needs of the analyst. As long as the analyst is focusing on a local business
practice, access to global data is an acceptable practice.
The local data warehouses often are housed on different technologies. In addi-
tion, the global data warehouse may be on a different technology than any of
the local data warehouses. The corporate data model acts as the glue that holds
the different local data warehouses together, as far as their intersection at the
global data warehouse is concerned. There may be local data warehouses that
house data unique to and of interest to the local operating site. There may also
be a globally distributed data warehouse. The structure and content of the dis-
tributed global data warehouse are determined centrally, whereas the mapping
of data into the global data warehouse is determined locally.
The coordination and administration of the distributed data warehouse envi-
ronment is much more complex than that of the single-site data warehouse.
Many issues relate to the transport of the data from the local environment to
the global environment, including the following questions:
■■
What network technology will be used?
■■
Is the transport of data legal?
■■
Is there a processing window large enough at the global site?
■■
What technological conversion must be done?
The Distributed Data Warehouse
245
Uttama Reddy
Uttama Reddy
Executive Information Systems
and the Data Warehouse
CHAPTER
7
P
rior to data warehousing, there were executive information systems (EIS). EIS
was a notion that computation should be available to everyone, not just the
clerical community doing day-to-day transactions. EIS presented the executive
with a set of appealing screens. The idea was that the elegance of the screen
presentation would beguile the executive. While there certainly is merit to the
idea that the world of computation should be open to the executive, the
founders of EIS had no concept of the infrastructure needed to get those num-
bers to the executive. The entire idea behind EIS was presentation of informa-
tion with no real understanding of the infrastructure needed to create that
information in the first place. When the data warehouse first appeared, the EIS
community roundly derided it as a complex discipline that required getting the
hands dirty. EIS was a high-minded, elegant discipline that was above the hard
work and management of complexity involved in a data warehouse. The EIS
community decided that executives had better things to do than worry about
such issues as sources of data, quality of data, currency of data, and so forth.
And so EIS died for lack of an infrastructure. It hardly mattered that the pre-
sentation to the executive was elegant if the numbers being presented were
unbelievable, inaccurate, or just plain unavailable.
This chapter first appeared just as EIS was on its way out. As originally written,
this chapter was an attempt to appeal to the EIS community, based on the ratio-
nality of the necessity of an infrastructure. But the wisdom of the EIS com-
munity and its venture capital backers was such that there was to be no
247
Uttama Reddy
relationship between data warehousing and EIS. When it came to the infra-
structure needed to support the grandiose plans of the EIS community, the EIS
community and the venture capital community just didn’t get it.
EIS as it was known in its earliest manifestation has all but disappeared. But the
promises made by EIS are still valuable and real. Consequently EIS has reap-
peared in many forms today—such as OLAP processing and DSS applications
such as customer relationship management (CRM)—and those more modern
forms of EIS are very much related to data warehousing, unlike the earliest
forms of EIS.
EIS—The Promise
EIS is one of the most potent forms of computing. Through EIS, the executive
analyst can pinpoint problems and detect trends that are of vital importance to
management. In a sense, EIS represents one of the most sophisticated applica-
tions of computer technology.
EIS processing is designed to help the executive make decisions. In many
regards, EIS becomes the executive’s window into the corporation. EIS pro-
cessing looks across broad vistas and picks out the aspects that are relevant to
the running of the business. Some of the typical uses of EIS are these:
■■
Trend analysis and detection
■■
Key ratio indicator measurement and tracking
■■
Drill-down analysis
■■
Problem monitoring
■■
Competitive analysis
■■
Key performance indicator monitoring
A Simple Example
As an example of how EIS analysis might appear to an executive, consider Fig-
ure 7.1, which shows information on policies offered by an insurance company.
Quarter by quarter, the new life, health, and casualty policy sales are tracked.
The simple graph shown in Figure 7.1 is a good starting point for an executive’s
probing into the state of the business. Once the executive has seen the overall
information, he or she can probe more deeply, as shown by the trend analysis in
Figure 7.2.
In Figure 7.2, the executive has isolated new casualty sales from new life sales
and new health sales. Looking just at new casualty sales, the executive identi-
CHAPTER 7
248
TEAMFLY
Team-Fly
®
Uttama Reddy
fies a trend: New casualty sales are dropping off each quarter. Having identified
the trend, the executive can investigate why sales are dropping.
Executive Information Systems and the Data Warehouse
249
1st
qtr
2nd
qtr
3rd
qtr
4th
qtr
1st
qtr
2nd
qtr
500
400
300
200
100
executives and EIS
total
policies
new life policies
new health policies
new casualty policies
Figure 7.1 A chart typical of EIS processing.
1st
qtr
2nd
qtr
3rd
qtr
4th
qtr
1st
qtr
2nd
qtr
400
300
200
100
new casualty policies
what do executives see in EIS.
Figure 7.2 Trends—new casualty policy sales are dropping off.
Uttama Reddy
The EIS analysis alerts the executive as to what the trends are. It is then up to
him or her to discover the underlying reasons for the trends.
The executive is interested in both negative and positive trends. If business is
getting worse, why, and at what rate? What can be done to remedy the situa-
tion? Or, if business is picking up, who and what are responsible for the upturn?
What can be done to accelerate and accentuate the success factors? Can the
success factors be applied to other parts of the business?
Trends are not the only type of analysis accommodated by EIS. Another type of
useful analysis is comparisons. Figure 7.3 shows a comparison that might be
found in an EIS analysis.
Looking at fourth-quarter data, first-quarter data, and second-quarter data in
Figure 7.3, the question can be asked, “Why is there such a difference in sales of
new health policies for the past three quarters?” The EIS processing alerts the
manager to these differences. It is then the job of the EIS analyst to determine
the underlying reasons.
For the manager of a large, diverse enterprise, EIS allows a look at the activities
of the enterprise in many ways. Trying to keep track of a large number of activ-
CHAPTER 7
250
1st
qtr
2nd
qtr
3rd
qtr
4th
qtr
1st
qtr
2nd
qtr
500
400
300
200
100
new life policies
new health policies
new casualty policies
comparisons
Figure 7.3 Why is there an extreme difference in sales of new health policies for the
past three quarters?
Uttama Reddy
ities is much more difficult than trying to keep track of just a few activities. In
that sense, EIS can be used to expand the scope of control of a manager.
But trend analysis and comparisons are not the only ways that the manager can
use EIS effectively. Another approach is to “slice-and-dice.” Here the analyst
takes basic information, groups it one way, and analyzes it, then groups it
another way and reanalyzes it. Slicing and dicing allows the manager to have
many different perspectives of the activities that are occurring.
Drill-Down Analysis
To do slicing and dicing, it is necessary to be able to “drill down” on data.
Drilling down refers to the ability to start at a summary number and to break
that summary into a successively finer set of summarizations. By being able to
get at the detail beneath a summary number, the manager can get a feel for what
is happening, especially where the summary number is surprising. Figure 7.4
shows a simple example of drill-down analysis.
In Figure 7.4, the manager has seen second-quarter summary results and wants
to explore them further. The manager then looks at the regions that have con-
tributed to the summary analysis. The figures analyzed are those of the Western
region, the Southeast region, the Northeast region, and the Central region. In
looking at the numbers of each region, the manager decides to look more
closely at the Northeast region’s numbers.
Executive Information Systems and the Data Warehouse
251
Western region
Southeast region
Northeast region
Central region
New York City
Albany
Schenectady
Long Island
Ithaca
White Plains
Poughkeepsie
Other
New York
Massachusetts
Connecticut
Pennsylvania
New Jersey
Virginia
Maine, RI, Vermont
2nd
qtr
Figure 7.4 To make sense of the numbers shown by EIS, the numbers need to support
a drill-down process.
Uttama Reddy
The Northeast’s numbers are made up of totals from New York, Massachusetts,
Connecticut, Pennsylvania, New Jersey, Virginia, Maine, Rhode Island, and Ver-
mont. Of these states, the manager then decides to look more closely at the
numbers for New York state. The different cities in New York state that have
outlets are then queried.
In each case, the manager has selected a path of going from summary to detail,
then to a successively lower level. In such a fashion, he or she can determine
where the troublesome results are. Once having identified the anomalies, the
manager then knows where to look more closely.
Yet another important aspect of EIS is the ability to track key performance indi-
cators. Although each corporation has its own set, typical key performance
indicators might be the following:
■■
Cash on hand
■■
Customer pipeline
■■
Length of sales cycle
■■
Collection time
■■
New product channel
■■
Competitive products
Each corporation has several key performance indicators that—in a single mea-
surement—tell an important story about some aspect of the life of the corpora-
tion. On their own, the key performance indicators say a lot about what is going
on in the corporation. Taken over time, the key performance indicators say
even more because they indicate trends.
It is one thing to say that cash on hand is $X. It is even more powerful to say that
two months ago cash on hand was $Z, one month ago cash on hand was $Y, and
this month cash on hand is $X. Looking at key performance indicators over
time is one of the most important things an executive can do, and EIS is ideal
for this purpose.
There is plenty of very sophisticated software that can be used in EIS to present
the results to a manager. The difficult part of EIS is not in the graphical presen-
tation but in discovering and preparing the numbers that go into the graphics,
as seen in Figure 7.5.
EIS is perfectly capable of supporting the drill-down process from the graphical
perspective as long as the data exists in the first place. However, if the data to
analyze does not exist, the drill-down process becomes very tedious and awk-
ward, certainly not something the executive wants to do.
CHAPTER 7
252
Uttama Reddy
Supporting the Drill-Down Process
Creating the basis of data on which to perform drill-down analysis, then, is the
major obstacle to successfully implementing the drill-down process, as seen in
Figure 7.6. Indeed, some studies indicate that $9 is spent on drill-down data
preparation for every $1 spent on EIS software and hardware.
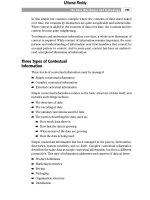
Exacerbating the problem is the fact that the executive is constantly changing
his or her mind about what is of interest, as shown in Figure 7.7. On day 1, the
executive is interested in the corporation’s financial activities. The EIS analyst
makes a big effort to develop the underlying data to support EIS interest. Then
on day 2, there is an unexpected production problem, and management’s atten-
tion turns there. The EIS analyst scurries around and tries to gather the data
needed by the executive. On day 3, the EIS analyst is directed to the problems
that have developed in shipping. Each day there is a new focus for the execu-
tive. The EIS analyst simply cannot keep up with the rate at which the execu-
tive changes his or her mind.
Management’s focus in the running of the business shifts with every new prob-
lem or opportunity that arises. There simply is no predictable pattern for what
management will be interested in tomorrow. In turn, the EIS analyst is at the
end of a whip—the wrong end! The EIS analyst is forever in a reactive state.
Furthermore, given the work that is required of the EIS analyst to build the base
of data needed for EIS analysis, the EIS analyst is constantly swamped.
Executive Information Systems and the Data Warehouse
253
EIS software and the
drill-down process
Figure 7.5 EIS software supports the drill-down process as long as the data that is
needed is available and is structured properly.
Uttama Reddy
The problem is that there is no basis of data from which the EIS analyst can eas-
ily work. Each new focus of management requires an entirely different set of data
for the EIS analyst. There is no infrastructure to support the EIS environment.
The Data Warehouse as a Basis for EIS
It is in the EIS environment that the data warehouse operates in its most effec-
tive state. The data warehouse is tailor-made for the needs of the EIS analyst.
Once the data warehouse has been built, the job of the EIS is infinitely easier
than when there is no foundation of data on which the EIS analyst can operate.
Figure 7.8 shows how the data warehouse supports the need for EIS data.
With a data warehouse, the EIS analyst does not have to worry about the fol-
lowing:
■■
Searching for the definitive source of data
■■
Creating special extract programs from existing systems
■■
Dealing with unintegrated data
■■
Compiling and linking detailed and summary data and the linkage between
the two
■■
Finding an appropriate time basis of data (i.e., does not have to worry
about finding historical data)
■■
Management constantly changing its mind about what needs to be looked
at next
In addition, the EIS analyst has a rich supply of summary data available.
CHAPTER 7
254
Buying and installing
the EIS software is fast
and easy.
Figure 7.6 Creating the base of data on which to do EIS is the hard part.
Uttama Reddy
Executive Information Systems and the Data Warehouse
255
mgmt
mgmt
mgmt
Management is interested in financial activities.
day 1
day 2
There is a
production
problem.
financial
day 3
production
financial
Suddenly there is a
shipment problem.
Figure 7.7 The constantly changing interests of executives.
Uttama Reddy
In short, the data warehouse provides the basis of data-the infrastructure—that
the EIS analyst needs to support EIS processing effectively. With a fully popu-
lated data warehouse in place, the EIS analyst can be in a proactive stance—not
an eternally reactive stance—with regard to answering management’s needs.
The EIS analyst’s job changes from that of playing data engineer to that of doing
true analysis, thanks to the data warehouse.
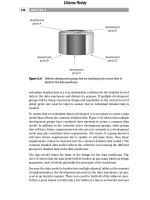
Yet another very important reason why the data warehouse serves the needs of
the world of EIS is this: The data warehouse operates at a low level of granu-
larity. The data warehouse contains—for lack of a better word—atomic data.
The atomic data can be shaped one way, then another. When management has
a new set of needs for information that has never before been encountered in
the corporation, the very detailed data found in the data warehouse sits, wait-
ing to be shaped in a manner suited to management’s needs. Because of the
granular atomic data that resides in the data warehouse, analysis is flexible and
responsive. The detailed data in the data warehouse sits and waits for future
unknown needs for information. This is why the data warehouse turns an orga-
nization from a reactive stance to a proactive stance.
Where to Turn
The EIS analyst can turn to various places in the architecture to get data. In Fig-
ure 7.9, the EIS analyst can go to the individual level of processing, the depart-
CHAPTER 7
256
mgmt
the unpredictable nature
of management’s focus
data warehouse
Figure 7.8 The data warehouse supports management’s need for EIS data.
Uttama Reddy
mental (data mart) level of processing, the lightly summarized level of process-
ing, or the archival/dormant level of data. In addition, there is a normal
sequence or hierarchy in which the EIS analyst goes after data to serve man-
agement’s needs (see Figure 7.9).
There is a very good reason for the order shown, as indicated in Figure 7.10. By
going from the individual level of processing to the archival/dormant level, the
analyst does de facto drill-down analysis. The most summarized data found in
the architected environment is at the individual level. The supporting level of
summary for the individual level is the departmental (data mart) level. Sup-
porting the summaries at the departmental (data mart) level is data at the data
warehouse lightly summarized level. Finally, the light summarization at the data
warehouse level is supported by archival/dormant data. The sequence of sum-
maries just described is precisely what is required to support drill-down EIS
analysis.
Almost by default, the data warehouse lays a path for drill-down analysis. At the
different levels of the data warehouse, and throughout the summarization
Executive Information Systems and the Data Warehouse
257
individualoper
data
warehouse
dept
(data mart)
1
lightly
summarized
3
4
true
archival
2
departmental
EIS
Figure 7.9 Where EIS goes to retrieve data.
Uttama Reddy
process, data is related by means of a key structure. The key structure itself, or
the derivations of the key structure, allow the data to be related so that drill-
down analysis is easy and natural.
The ways that EIS is supported by the data warehouse are illustrated in Fig-
ure 7.11.
The EIS function uses the following:
■■
The data warehouse for a readily available supply of summary data
■■
The structure of the data warehouse to support the drill-down process
■■
Data warehouse meta data for the DSS analyst to plan how the EIS system
is built
■■
The historical content of the data warehouse to support the trend analysis
that management wishes to see
■■
The integrated data found throughout the data warehouse to look at data
across the corporation
Event Mapping
A useful technique in using the data warehouse for EIS processing is event map-
ping. The simplest way to depict event mapping is to start with a simple trend line.
CHAPTER 7
258
1
lightly
summarized
3
4
true
archival
detailed
data
2
departmental
EIS
very
summarized
data
repetitive
summary
data
Figure 7.10 In going from individual levels of processing to true archival data, the drill-
down process is accommodated.
TEAMFLY
Team-Fly
®
Uttama Reddy
Figure 7.12 shows that corporate revenues have varied by month, as expected.
The trend has been calculated from data found in the data warehouse. The
trend of revenues in and of itself is interesting but gives only a superficial view
of what is going on with the corporation. To enhance the view, events are
mapped onto the trend line.
In Figure 7.13, three notable events have been mapped to the corporate revenue
trend line—the introduction of a “spring colors” line of products, the advent of
a sales incentive program, and the introduction of competition. Now the rela-
tionship between corporate revenue and significant events begins to take on a
different perspective. Looking at the diagram in Figure 7.13, one might draw the
conclusion that the introduction of a new line of products and a new incentive
plan have boosted revenue and that competition is starting to have an effect in
the latter part of the year.
For some sorts of events, event mapping is the only way to measure the results.
Some events and activities cannot be measured directly and have to be
Executive Information Systems and the Data Warehouse
259
m
e
t
a
d
a
t
a
1
2
3
4 5
drill
down
drill
down
history
integration
EIS
drill
down
Figure 7.11 How EIS is supported by the data warehouse.
Uttama Reddy
measured in a correlative fashion. Cost justification and actual cost benefit can-
not be measured any other way for some types of events.
Misleading conclusions can be drawn, though, by looking at correlative infor-
mation. It often helps to look at more than one set of trends that relate to the
events at hand. As an example, Figure 7.14 shows that corporate revenues are
matched against the consumer confidence index to produce a diagram packed
with even more perspective. Looking at the figure shown, the executive can
make up his or her own mind whether events that have been mapped have
shaped sales.
CHAPTER 7
260
corporate revenues
Jan Feb Mar Apr May Jun Jul Aug Sep Oct Nov
Figure 7.12 Simple trends.
corporate revenues
Jan Feb Mar Apr May Jun Jul Aug Sep Oct Nov
introduction of
“spring colors”
options
salesmen’s
new incentive
plan
competition’s next
year’s line
promotion
Figure 7.13 Mapping events against a trend line.
Uttama Reddy