Báo cáo khoa học: "Growth and development of individual Douglas-fir in stands for applications to simulation in silviculture" potx
Bạn đang xem bản rút gọn của tài liệu. Xem và tải ngay bản đầy đủ của tài liệu tại đây (912 KB, 16 trang )
Original
article
Growth
and
development
of
individual
Douglas-fir
in
stands
for
applications
to
simulation
in
silviculture
JM
Ottorini
INRA-Nancy,
Station
de
Sylviculture
et
Production,
54280
Champenoux,
France
(Received
23
May
1991;
accepted
9
September
1991)
Summary —
Growth
and
development
of
individual
Douglas-fir
(Pseudotsuga
menziesii
(Mirb)
Fran-
co)
were
studied
on
the
basis
of
a
sample
of
44
trees
felled
in
the
north
east
of
France,
taking
into
consideration
various
stand
conditions.
This
work
was
conducted
with
a
view
to
future
use
of
the
in-
formation
in
a
simulation
system,
to
predict
the
effects
of
silvicultural
treatments
on
Douglas
fir
stands.
Stem
and
branches
were
analysed
in
all
trees,
and
relationships
combining
branch
growth
with
growth
and
development
of
crown
and
stem
were
obtained.
These
relationships
give
insight
into
interactions
between
tree
growth
and
stand
dynamics.
Among
the
prediction
equations
obtained,
a
major
one
was
tested
on
a
further
12
newly
felled
trees,
analysed
for
past
bole
increments
and
crown
development
reconstruction.
This
suggested
the
use
of
a
scaling
factor
to
correct
a
possible
underestimation.
Douglas-fir
=
Pseudotsuga
menzesii /
crown
/
stem
/
growth
and
development
/
silviculture
Résumé —
Croissance
et
développement
individuels
du
douglas
en
peuplement.
Applica-
tions
à
la
simulation
en
sylviculture.
La
croissance
et
le
développement
individuels
du
douglas
(Pseudotsuga
menziesii
(Mirb)
Franco)
ont
été étudiés
à
partir
d’un
échantillon
de
44
arbres
abattus
dans
le
Nord-Est
de
la
France,
en
tenant
compte
de
différentes
conditions
de
peuplement.
Ce
travail
a
été
effectué
dans
le
cadre
d’une
exploitation
ultérieure
des
résultats
par
un
système
de
stimula-
tion,
de
façon
à
prédire
les
effets
de
traitements
syvicoles
sur
les
peuplements
de
douglas.
La
tige
et
les
branches
de
tous
les
arbres
ont
été
analysées,
et
des
relations
liant
la
croissance
des
branches
à
la
croissance
et
au
développement
du
houppier
et
de
la
tige
ont
été
obtenues.
Ces
rela-
tions
renseignent
sur
les
interactions
entre
la
croissance
individuelle
des
arbres,
et
la
dynamique
du
peuplement.
Parmi
les
équations
de
prédiction
obtenues,
l’une
d’entre
elles,
particulièrement
impor-
tante,
a
été
testée
sur
un
nouvel
échantillon
de 12
arbres
abattus,
analysés
pour
obtenir
les
accrois-
sements
de
la
tige
au
cours
du
temps,
et
reconstituer
le
développement
du
houppier.
Ce
contrôle
a
fait
apparaître
une
possible
sous-estimation,
pouvant
être
corrigée
par
un
facteur
multiplicatif.
douglas
=
Pseudotsuga
menzesii
/
croissance
et
développement
/
tige
/
houppler
/
sylvicul-
ture
INTRODUCTION
Silvicultural
studies
rely
on
long-term
records
from
permanent
spacing
and
thin-
ning
trials.
Unavoidably,
these
reflect
opin-
ions
or
concerns
for
socioeconomic
values
that
applied
20-30
years
ago
(or
more),
al-
though
they
may
include
treatments
judged
extreme
at
that
time.
In
this
do-
main,
setting
up
a
new
trial
implies
dec-
ades
of
observations
before
it
can
be
use-
ful.
To
predict
the
effects
of
recently
speculated
treatments,
it
is
necessary
to
widen
the
basis
of
the
data
provided
by
ex-
isting
permanent
stands.
This
can
be
done,
for
instance,
with
"temporary"
or
"semi-temporary"
sample
plots,
measured
once,
or
over
a
period
of
a
few
years.
Gen-
erally,
it
is
hard
to
find
contrasting
stands
in
this
case,
because
the
management
practices
tend
to
standardize
the
treat-
ments.
Moreover,
temporary
stands
of
quite
different
developments
in
fact
pro-
vide
unrelated
data
(Johnson,
1986).
Whatever
the
data
sources
used,
to
op-
timise
the
information
they
provide,
it
is
necessary
to
set
up
a
more
or
less
con-
ceptual
framework
of
inter-related
compo-
nents
which
can
be
mapped
to
a
real
stand,
and
make
use
of
the
various
meas-
urements
through
this
framework,
usually
called
a
model.
A
model
is
a
simpler
repre-
sentation
of
a
more
complex
reality,
which
allows
the
extension
of
the
validity
of
the
available
data,
based
on
some
hypothesis.
At
first,
the
basic
model
components
simply
consisted
of
stand
characteristics.
Versions
of
this
method
were
proposed,
among
others,
by
Decourt
(1972),
Hamil-
ton
and
Christie
(1974),
Curtis
et al (1981),
Ottorini
(1981).
In
the
early
models
(called
yield tables),
stand
composition
was
not
considered.
So,
there
was
no
clear
basis
to
extrapolate
the
predictions
to
growth
conditions
fundamentally
differing
from
those
observed,
and
intended
to
give
com-
pletely
new
stand
structures
and
evolution.
The
stand
composition
was
needed
for
a
better
understanding
of
growth
phenome-
na,
and
also
as
an
important
output
for
treatment
evaluations
and
decision-
making.
Originally,
diameter
distributions
were
incorporated
into
models
at
a
de-
scriptive
level.
For
example,
in
Hyink
and
Moser
(1983),
the
parameters
of
such
dis-
tributions
were
derived
from
stand
charac-
teristics,
and
in
Ek
(1974)
a
non-
parametric
principle
was
used.
Diameter
distributions
have
also
arisen
from
a
more
basic
approach,
considering
stand
devel-
opment
through
individual
tree
growth,
as
discussed
in
this
study.
To
anticipate
the
responses
of
a
wide
variety
of
treatments
that
have
never
been
put
into
practice,
there
has
been
an
in-
creasing
concern
to
rely
on
basic
informa-
tion
of
general
applicability
and
immediate
availability.
This
kind
of
information
is
best
found
at
the
level
of
individual
tree
growth.
An
advantage
of
this
approach
is
that
large
stand
data
are
not
necessarily
needed
for
the
model
construction,
and
it
is
easier
to
find
trees,
rather
than
stands,
in
practically
all
possible
growing
conditions.
Staebler
(1951)
was
the
first
to
attempt
to
relate
individual
tree
growth
to
local
stand
conditions.
Numerous
works
fol-
lowed
to
express
for
a
given
tree
the
dis-
tance
and
relative
size
of
the
surrounding
trees
with
a
single
value
in
a
"competition
index",
sometimes
used
in
a
computer
pro-
gram
to
simulate
the
development
of
a
whole
stand,
based
on
the
growth
of
indi-
vidual
trees
(Newnham,
1964;
Bella,
1970,
1971;
Hegyi,
1974;
Lin,
1974;
Daniels
and
Burkhart,
1975).
But
these
indices
(a
re-
cent
comprehensive
review
of
which
is
giv-
en
by
Tomé
and
Burkhart,
1989)
always
appear
to
be
highly
correlated
with
tree
size,
reducing
their
potential
to
improve
the
prediction
of
tree
growth.
A
parallel
less
detailed
approach
is
possible,
by
not
con-
sidering
the
positions
of
the
trees;
in
this
case,
for
each
tree
in
a
stand
local
condi-
tions
are
only
accounted
for
statistically,
by
comparison
between
the
tree
and
the
stand
characteristics
(Goulding,
1972;
Al-
der,
1979;
Arney,
1985).
It
becomes
more
apparent
that
the
stud-
ies of
stand
dynamics
that
allow
the
most
diverse
explorations
of
treatments
are
based
on
individual
tree
growth,
including
information
on
crown
development,
and
its
connections
with
stem
growth
and
devel-
opment.
This
was
done
to
some
extent
by
Mitchell
(1969)
and
Arney
(1972).
The
ex-
emplary
work
of
Mitchell
(1975a)
showed
the
full
potential
of
this
procedure.
Relying
on
stem
on
branch
analysis,
his
methods
resulted
in
relationships
expressing
laws
of
individual
tree
growth
in
general
stand
con-
ditions.
Similar
works
were
later
presented
by
Inose
(1982,
1985).
The
work
present-
ed
here
is
also
related
to
this
approach.
The
importance
of
Douglas-fir
(Pseudot-
suga
menziesii
(Mirb)
Franco)
is
growing
in
France,
where
the
total
area
occupied
by
this
species
is
estimated
to
be
300 000
ha,
with
a
steady
rate
of
10
000
ha
increase
each
year
(Bouchon,
1984).
It
is
widely
ac-
cepted
by
foresters
that
larger
initial
spac-
ings
and
heavier,
less
numerous
thinnings
should
be
used
now,
in
order
to
reduce
management
costs.
Long-term
data
are
lacking
to
rationalize
these
opinions,
and
quantify
the
effects
of
the
different
possible
treatments.
A
basic
approach
is
therefore
required
to
help
managers
and
decision-
makers
with
these
questions.
A
research
program
was
set
up
to
contribute
to
the
study
of
the
silviculture
of
Douglas
fir
in
France,
in
consideration
of
the
local
needs
and
conditions.
The
present
paper
reports
this
work,
that
has
been
concentrated
on
the
main
growth
and
development
features
of
Douglas
fir
at
the
tree
level.
Preliminary
results
of
the
work
reported
here
have
been
published
earlier
(Mitchell
et
al,
1983).
SAMPLING
AND
MEASUREMENTS
Sample
trees
were
selected
in
various
stands
of
the
northeast
of
France,
in
the
Nancy
region
(48.41°
N
lat),
at
elevations
not
exceeding
200
m.
Mean
annual
tem-
perature
is
9.1
°C
(max
Jul
17.6
°C,
min
Jan
1.3
°C),
and
mean
annual
rainfall
is
697.4
mm,
about
evenly
distributed.
In
all
the
sampling
locations,
edaphic
conditions
were
constituted
by
leached
brown
forest
soils
of
good
quality,
with
acid
mull,
occa-
sionally
not
well
drained,
where
Douglas
fir
productivity
could
be
rated
as
Decourt’s
site
class
2
(Decourt,
1967),
or
King’s
upper
site
class
3
(King,
1966).
We
select-
ed
and
felled
44
trees
(table
I)
for
the
measurements.
As
far
as
possible,
the
trees
were
chosen
with
an
approximately
circular
crown
projection,
that
is,
the
same
height
of
lower
live
branches
in
every
di-
rection.
Tree
age
extended
from
10
to
45
years,
and
the
greatest
range
of
local
stand
conditions
were
sought,
though
not
all
conditions
could
be
represented
for
each
age
class,
as
this
would
have
been
ideally
desirable.
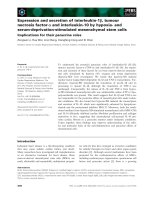
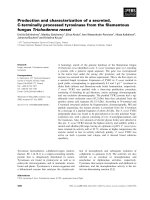
For
each
felled
tree
3
branches
were
measured
at
each
whorl,
for
the
length
(B),
and
the
spread
(BL)
(cf fig
1),
that
is,
the
distance
of
the
branch
extremity
to
the
stem
axis
(while
the
portion
of
stem
bear-
ing
the
branch
was
held
vertically).
Distinc-
tion
was
made
between
free-growing
branches
above
the
zone
of
crown
contact,
rubbed
or
broken
branches
at
this
level,
and
dying
branches
below.
The
distance
(L)
of
each
node
to
the
stem
apex
was
measured,
and
discs
were
cut
at
about
equal
spacings.
An
average
of
10
discs
per
tree
was
collected;
the
biggest
trees
were
over-sampled
toward
the
butt,
while
it
seemed
unnecessary
to
take
more
than
8
discs
on
the
smallest.
The
last
5
annual
cross-sectional
area
increments
along
the
stem
were
calculated
from
the
measure-
ments
of
each
disc
in
8
directions
forming
equal
angles.
Afterwards,
12
other
sample
trees
were
used
to
evaluate
the
prediction
potential
of
an
equation
obtained
from
the
analysis
of
the
main
sample.
These
trees,
in
similar
sites,
were
felled
and
measured
following
a
procedure
simplified
in
some
instances.
This
procedure,
suggested
by
the
results
obtained
from
the
main
sample,
is
de-
scribed
later.
RESULTS
Crown
shape
and
size
relationships
Crown
shape
and
size
result
from
the
rela-
tionship
between
branch
growth
and
height
growth.
The
following
equation,
relating
distance
L
of
branch
base
from
the
leader,
to
branch
length
B
(cf fig
1),
is
compatible
with
a
decreasing
branch
growth
rate
when
the
distance
L
is
increasing
(Mitchell,
1975a):
where
b and
c
are
scale
and
shape
param-
eters.
This
equation
proved
quite
ade-
quate,
with
the
tree
sample,
to
describe
a
component
of
the
crown
morphology.
Though
the
coefficients
b and
c
could
have
been
individually
estimated
for
each
tree,
after
a
visual
inspection
of
the
data,
it
was
judged
acceptable
to
fit
a
single
equation
for
all
trees.
Three
trees,
though,
were
dis-
carded
from
this
collective
representation,
because
a
probable
loss
of
apical
domi-
nance
gave
them
longer
branches
than
ex-
pected,
at
a
given
distance
L from
the
apex.
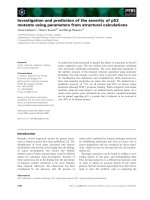
The
following
values
of
the
coeffi-
cients
were
obtained
with
a
non-linear
least
square
fitting
procedure,
based
on
a
subsample
of
17
representative
trees,
and
426
free-growing
branches
(fig
2):
The
residual
values
(observed-fitted)
were
then
examined
against
age,
height,
and
competitive
status
(measured
by
a
"com-
petition
ratio",
defined
later).
No
relation-
ship
with
these
variables
was
found,
dis-
carding,
thus,
a
possible
dependance
upon
these
characteristics
of
the
coefficients
b
and
c.
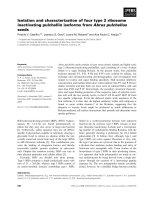
Moreover,
branch
spread
BL
is
propor-
tional
to
branch
length
B
(fig
1),
as
sug-
gested
by
the
least
squares
regression
line
through
the
origin
fitted
to
the
data
(fig
3):
The
following
value,
based
on
a
sub-
sample
of
24
trees
covering
the
range
of
branch
spreads,
and
407
free-growing
branches,
was
obtained
for
d:
From
a
static
point
of
view,
equations
(1)
and
(3)
are
an
expression
of
crown
shape
and
size.
As
for
a
given
branch
L
varies
with
tree
height
in
association
with
height
growth,
these
equations
reflect
the
process
of
radial
expansion
of
the
parts
of
a
crown
free
from
competition
from
sur-
rounding
trees.
Putting
together
equations
(1)
and
(3)
gives
the
following
equation:
Growth
and
development
relationships
between
stem
and
crown
Stem
increment
We
observed
that,
for
any
tree,
the
dimen-
sions
and
state
of
the
live
crown
control
the
volume
increment
of
the
stem
and
its
distribution.
More
precisely,
stem
(or
bole)
volume
increment
(BI)
is
related
to
foliage
quantity
of
the
live
crown;
in
consequence,
this
quantity
has
to
be
estimated,
to
predict
BI from
crown
dimensions.
The
distal
parts
of
a
branch
that
have
developed
free
from
competition
may
be
considered
as
distrib-
uted
on
a
surface
of
revolution
that
delimits
the
crown
(fig
4a).
This
"crown
surface"
is
generated
by
the
curve
delimiting
a
half
crown
profile
that
Equation
(5)
defines.
It
results
that
the
volume
(FV
i)
between
the
crown
surface
of
a
year
and
that of
the
pre-
ceding
one
is
the
volume
of
the
needle
layer
developed
in
one
growth
season.
For
each
tree
we
can
compute
a
"foliar
vol-
ume"
(FV)
(Mitchell,
1975a),
as
a
weighted
sum
of
the
volumes
FV
i
of
needle
layers
developed
in
the
last
5
years:
where,
for
year
i,
coefficients
wi
combine
a
leaf
retention
ratio
(ret)
and
a
photosyn-
thetic
efficiency
ratio
(phot).
Silver
(1962)
established
that
the
last
5
years
of
needle
contribute
to
90%
of
the
to-
tal
needle
count;
considering
the
shading
conditions
of
the
older
needles,
the
5
youngest
needle
layers
should
contribute
to
most
of
the
photosynthetic
production
of
a
tree.
A
leaf
retention
ratio
was
obtained
from
Silver’s
data
expressing
numbers
of
needles
per
inch
of
shoot.
For
the
photo-
synthetic
efficiency
ratios,
as
such
a
de-
tailed
study
as
Clark’s
(1961)
on
White
spruce
(Picea
glauca)
was
not
known,
for
Douglas
fir,
to
the
author,
a
photosynthetic
efficiency
ratio
was
derived
from
this
work,
based
on
the
evolution
of
apparent
photo-
synthesis
along
the
growth
season.
The
area
under
the
curve
of
a
given
year
was
divided
by
the
corresponding
value
for
the
current
year
curve
to
obtain
this
ratio.
The
weights
were
finally
obtained
as
shown
in
table II.
For
an
open
grown
tree
with
crown
ex-
tending
(hypothetically)
to
the
ground,
vol-
umes
FV
i
can
be
computed
by
calculus
on
the basis
of
Equation
(5).
Observations
of
crown
profiles
(fig
5)
indicate
that
the
low-
er
part
of
the
crown
of
a
stand
tree
subject
to
competition
from
the
surrounding
crowns
is
almost
cylindrical
in
shape
(fig
4b
and
c);
from
a
geometrical
argument
(Mitchell,
1975a)
it
follows
that
the
volume
FV
i
is
the
product
of
crown
projection
area
(CC)
(fig
4c)
by
height
growth
in
year
i.
In
the
study
of
relationships
between
stem
volume
increment
BI
and
foliar
vol-
ume
FV,
the
best
results
were
obtained
by
using
the
increment
preceding
the
year
of
the
tree
felling
(and
not
the
last
one,
or
the
trend
of
the
last
increments).
Figure
6a
shows
a
linear
relationship
between
Na-
perian
logarithms
of
these
values
for
the
tree
sample.
To
assess
the
effect
of
crown
state
on
stem
volume
increment,
the
po-
tential
maximum
foliar
volume
(FVmax
),
the
tree
would
have
in
open
grown
conditions
(with
crown
extending
to
the
ground),
was
computed.
The
ratio
FV/FV
max
can
be
tak-
en
as
a
measure
of
competition
effects,
or,
in
other
words,
an
expression
of
the
com-
petitive
status.
A
least
square
linear
re-
gression
line
was
fitted
to
the
data,
and
the
residuals
were
examined
against
In
(1
-In(FV/FV
max)),
showing
again
a
linear
relationship
that
appears
in
figure
6b).
This
analysis
establishes
the
possibility
of
a
lin-
ear
fit
to
express
In(BI)
as
a
function
of
In
(FV)
and
In(1-In(FV/FV
max)).
The
method
of
least-squares
gave
the
following
equa-
tion
fitted
on
the
44
sample
trees:
The
corresponding
analysis
of
variance
table
for
the
multiple
regression
(table
III)
confirms
a
significant
effect
(observed
in
figure
6b))
of
the
competitive
status
in
this
fit.
To
obtain
an
unbiased
estimate
of
BI,
the
exponential
of
the
right
side
member
of
Equation
(7)
must
be
multiplied
by
exp
(s
2
/2)
for
bias
correction,
where
s2
is
the
mean
square
error
of
the
fit
given
in
table
II
(Flewelling
and
Pienaar,
1981):
Pressler
law
(Larson,
1963),
was
ob-
served
on
the
whole
tree
sample,
with
more
or
less
typical
features.
It
is
illustrat-
ed
by
3
sample
trees
of
various
develop-
ment
stages,
and
competitive
status,
in
fig-
ure
7.
These
trees
show
the
typical
variation
scheme
of
the
stem
cross
sec-
tional
area
of
the
annual
increment,
along
the
stem.
This
area
increases
linearly
from
the
base
of
the
stem
annual
shoot;
then
it
stays
equal
to
the
value
reached
at
the
base
of
the
live
crown,
and
increases
again
toward
the
tree
foot
to
contribute
to
the
butt
swell.
The
successive
additions
of
stem
annual
increments
following
this
scheme,
in
varying
stand
conditions,
result
ultimately
in
the
bole
size
and
shape.
Stem
height
growth
Individual
height
growth
is
reduced
when
competition
is
severe.
This
effect
is
notice-
ably
visible
on
height
growth
curves
of
in-
termediate
or
suppressed
trees,
when
height
growth
is
steadily
decreasing,
to
eventually
reach
a
virtually
null
value.
Po-
tential
height
growth
rate
(Hg0)
is
the
height
growth
rate
in
absence
of
competi-
tion.
It
could
be
estimated
on
the
height
growth
curves
of
the
sample
trees
by
the
slope
of
the
curves,
prior
to
the
competi-
tion
effects.
Potential
height
growth
rate
is
possibly
equal
to
the
observed
growth
rate
(Hg),
when
competition
by
the
surrounding
trees
is
low.
Figure
8
shows
the
variation
of
the
ratio
Hg
/Hg0
with
the
competition
ratio
FV/FV
max
.
As
no
single
functional
ex-
pression
was
available
to
represent
the
ob-
served
response,
a
piecewise
function
was
constructed.
It
needed
to
be
continuous
and
smooth,
and
to
eventually
be
constant
with
the
value
1,
to
be
consistent
with
the
well-known
effect
of
no
height
growth
rate
reduction
for
the
dominant
trees,
that
ap-
pears
in
figure
8.
The
function
was
fitted
using
the
non-linear
least-squares
proce-
dure,
that
resulted
in
the
following
equa-
tion:
Validation
of
the
relationship
between
crown
state
and
stem
increment
To
evaluate
Equation
(8)
validity,
a
further
12
felled
trees
of
ages
ranging
from
20
to
37
years
were
used.
The
new
sample
of
trees,
in
site
conditions
similar
to
those
of
the
first
sample,
included
dominant,
co-
dominant,
and
intermediate
trees,
from
stands
of
initial
density
ranging
between
1
100
stem
per
ha
and
4
400
stem
per
ha,
with
various
thinning
regimes.
On
each
tree,
a
disc
was
cut
at
each
internode,
and
4
radii
were
measured
in
2
perpendicular
directions,
to
estimate
the
cross
sectional
area
under
bark
of
the
stem
for
all
succes-
sive
years.
From
these
measurements,
stem
increment
of
the
tree
at
any
age
could
be
obtained.
Moreover,
graphic
in-
spection
of
the
variation
of
annual
ring
areas
along
the
stem
allowed,
using
Press-
ler
law,
to
trace
crown
recession.
Then,
by
application
of
Equations
(2)
and
(4),
the
fo-
liar
volumes
FV and
FV
max
,
corresponding
to
each
annual
bole
increment
of
a
given
tree,
were
obtained
(beginning
at
6
years
of
age,
for
compatibility
with
Equation
(6)).
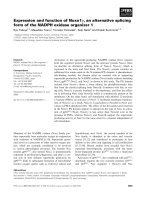
The
results
are
presented
in
figure
9,
where
for
each
tree
of
this
new
sample
the
mean
of
observed
stem
increments
is
plot-
ted
against
the
mean
of
the
stem
incre-
ments
predicted
by
Equation
(8).
The
coor-
dinates
of
the
points
are
averaged
from
15
to
32
years,
depending
on
tree
age.
The
position
of
all
points,
relative
to
the
first
quadrant
bisector
indicate
some
degree
of
under-estimation,
though
the
overall
order
to
magnitude,
and
the
accordance
of
all
but
2
points
seem
quite
acceptable.
APPLICATIONS
TO
SIMULATION
Mitchell
(1975a)
gave
a
detailed
diagram
of the
processes
involved
in
the
growth
and
development
of
a
tree
in
a
stand,and
Inose
(1982),
a
limited
linear
one.
Our
con-
text
being
more
similar
to
that of
the
former
author,
to
obtain
a
simplified
description
of
these
processes,
we
have
enriched
Inose’s
diagram
(fig
10).
For
each
tree
in
a
stand,
crown
expansion
depends
on
height
growth,
through
branch
extension,
follow-
ing
Equations
(3)
and
(4),
when
it
is
not
hampered
by
some
obstacle,
as
a
neigh-
boring
crown.
Otherwise,
the
expansion
is
stopped
at
the
contact
region.
This
growth
and
development
scheme
results
in
a
crown
state
and
a
foliar
volume,
that
deter-
mine
a
given
bole
increment
volume,
and
possibly
some
height
growth
reduction,
predicted
by
Equations
(8)
and
(9).
As
demonstrated
by
Mitchell
(1971,
1975a,
b),
a
computer
can
be
used
to
sim-
ulate
the
whole
growth
and
development
process
depicted
here,
for
all
the
trees
of
a
stand,
allowing
to
study
stand
dynamics
under
various
silviculture
treatments.
More
precisely,
at
any
development
stage
of
the
stand,
the
programmed
computer
(that
be-
comes
a
simulation
system)
can
store
the
state
of
all
tree
crowns
by
means
of
a
stand
map,
and
the
various
corresponding
stem
increments
can
be
computed.
Then
stand
state
for
the
next
stage
is
obtained
when
the
state
of
each
tree
crown
is
estab-
lished
from
the
radial
expansion
following
height
growth,
allowing
for
the
obstruction
from
the
surrounding
crowns.
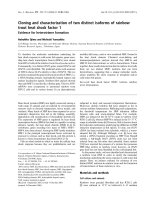
We
are
working
on a
similar
computer
program.
Figure
11
shows
the
crown
map
of
a
portion
(≈
17
m
on
one
side)
of
a
larg-
er
stand
in
a
simulation
trial
submitted
to
this
simulation
system,
whose
completion
of
a
preliminary
version
is
under
way.
In
this
map
only
the
crown
projections
ap-
pear.
But
the
elevation
of
crown
exterior
part,
at
the
vertical
of
any
point
of
the
stand
pertaining
to
a
crown
projection,
is
stored
in
the
simulation
system
and
used
when
needed
by
the
simulation
process.
Further
work
is
needed
to
derive
tree
char-
acteristics
for
the
crown
dimensions,
to
process
inputs
for
various
thinning
treat-
ments,
and
to
repeatedly
submit
simula-
tions
to
the
system.
DISCUSSION
AND
CONCLUSION
The
methods
described
in
this
paper
rely
on
a
crown
architecture
structured
by
a
main
axis,
with
branches
and
shoots
about
evenly
occupying
space
with
circular
sym-
metry
at
each
whorl.
As
they
also
assume
that
stem
extension
growth
controls
branch
growth
(named
apical
control;
after
Wilson,
1984),
they
are
specific
to
coni-
fers.
It
has
to
be
stressed
that
the
most
im-
portant
aspects
of
Douglas-fir
individual
growth,
in
various
stand
conditions,
de-
scribed
by
the
relationships
established
by
Mitchell
(1975)
have
been
confirmed.
No
formal
comparison
of
both
sets
of
relation-
ships,
for
local
conditions
in
British
Colum-
bia
and
in
France,
is
feasible
without
the
possibility
of
pooling
the
data.
Neverthe-
less,
it
seems
through
a
cursory
compari-
son
of
the
equations
obtained
that
crown
diameter
at
a
given
distance
of
the
apex
is
smaller
in
the
first
case,
while
bole
incre-
ment
for
given
crown
dimensions
is
great-
er.
This
could
result
partly
from
the
com-
bined
effects
of
provenance
and
climate.
The
foliar
volume,
derived
from
geomet-
rical
arguments,
might
be
an
estimate
of
the
leaf
area -
or
possibly
a
weighted
sum
version
of
this -
commonly
used
by
physi-
ologists
(for
instance,
Waring
et
al,
1980;
Vose
and
Allen,
1988).
Experimental
work
could
establish
a
correspondance
between
these
quantities
to
unify
the
results
of
both
origins.
Moreover,
the
estimation
of
weighting
factors
used
to
calculate
the
fo-
liar
volume
could
benefit
from
the
methods
where
in
"process-based"
models
(Grace,
1990),
used
canopy
structure
and
light
in-
terception,
are
taken
into
account.
Equations
(8)
and
(9),
expressing
the
effect
of
crown
absolute
and
relative
di-
mensions
upon
stem
volume
increment
on
one
hand,
and
upon
height
increment
on
the
other
hand,
should
be
considered
as
fundamental,
because
they
give
insight
into
the
relationships
between
individual
tree
growth
and
the
surrounding
tree
com-
petition,
which
is
of
major
concern
in
silvi-
culture.
Concerning
Equation
(8),
it
is
prob-
ably
unnecessary
to
use
an
expression
combining
the
most
recent
increments
to
relate
stem
volume
increment
to
crown
di-
mensions,
because
height
growth
in
the
last
5
years,
used
to
compute
foliar
vol-
ume,
should
account
for
climatic
varia-
tions.
As
already
stated,
the
best
results
to
fit
Equation
(8)
were
obtained
with
the
incre-
ment
of
the
year
preceding
the
last
one.
This
could
be
attributed
to
a
large
part
of
determinacy
of
the
growth
of
the
last
year
by
the
preceding
one
(Wilson,
1984),
com-
bined
with
a
somehow
intermediate
posi-
tion
of
this
year,
which
would
better
reflect
the
state
of
the
crown
(whose
foliar
volume
is
based
on
the
last
5
years).
Equation
(8)
expresses
that
for
a
given
foliar
volume,
the
crowns
with
smaller
competitive
status
FV/FV
max
are
more
productive
considering
stem
increment.
This
could
arise
from
smaller
maintenance
needs
of
these
crowns,
and
was
already
noticed
by
Hamil-
ton
(1969).
Concerning
the
validation
attempted
for
Equation
(8),
it
should
be
noted
that
the
correction
for
inverse
transformation
of
Equation
(7)
was
not
the
uniform
multipli-
cation
by
a
factor
applied
above,
but the
full
correction
which
depends
on
the
val-
ues
at
which
the
prediction
is
to
be
made
(see
Flewelling
and
Pienaar,
1981;
or
the
original
paper
by
Bradu
and
Mundlack,
1970).
The
bias
observed
is
possibly
caused
partly
by
the
positioning
of
the
mid-
dle
part
of
the
zone
of
crown
contact,
on
the
test
trees,
for
the
past
years
(we
recall
that
this
position
was
presumably
set
at
the
point
of
stabilization
of
the
annual
ring
area
of
stem
cross
section,
but
not
directly
observed).
This
could
be
amplified
be-
cause
the
successive
annual
increments
concerning
a
given
test
tree
are
dependent
on
the
pecularities
of
this
tree.
Neverthe-
less,
in
figure
9,
this
bias
appears
as
a
lin-
ear
deviation
that
could
be
corrected
by
a
mere
scaling
factor.
This
last
question
will
be
best
ap-
proached
in
the
application
of
this
study
to
the
stimulation
of
growth
and
development
of
trees
in
stands,
by
means
of
the
stimula-
tion
system
discussed
in
the
preceding
section,
that
should
be
soon
operational.
We
plan
to
present
the
results
of
such
sim-
ulations,
compared
to
data
of
observed
permanent
stands,
in
a
subsequent
paper.
ACKNOWLEDGMENTS
This
work
was
carried
out
with
the
technical
as-
sistance
of
M
Ravart
and
R
Canta,
INRA-
Nancy.
The
comments
and
suggestions
of
2
anonymous
reviewers
are
gratefully
acknow-
ledged.
REFERENCES
Alder
D
(1979)
A
distance-independent
tree
model
for
exotic
conifer
plantations
in
East
Africa.
For
Sci 25, 59-71
Amey
J
(1972)
Computer
simulation
of
Douglas-
fir
tree
and
stand
growth.
Ph
D
Thesis,
Ore-
gon
State
University,
79
pp
Arney
JD
(1985)
A
modeling
strategy
for
the
growth
projection
of
managed
stands.
Can
J
For
Res
15,
511-518
Bella
IE
(1970)
Simulation
of
growth
yield,
and
management
of
aspen.
Ph
D
thesis,
Fac
For,
Univ BC, 190 pp
Bella
IE
(1971)
A
new
competition
model
for
in-
dividual
trees.
For Sci 17,
364-372
Bouchon
J
(1984)
Importance
des
plantations
de
Douglas
et
Épicéa
en
France.
Rev
For
Fr
26, 254-258
Bradu
D,
Mundlack
Y
(1970)
Estimation
in
log-
normal
linear
models.
J
Am
Stat
Assoc
65,
198-211
Clark
J
(1961)
Photosynthesis
and
Respiration
in
White
Spruce
and
Balsam
Fir.
State
Univ
Coll
For
Syracuse,
NY,
Tech
Publ 85,
72
pp
Curtis
RO,
Clendenen
GW,
DeMars
DJ
(1981)
A
new
stand
simulator
for
coast
Douglas
fir.
In:
DFSIM
User’s
Guide.
USDA
For
Serv
Gen
Tech
Rep
PNW-128.
Pac
Northwest
For
Range
Exp
Stn,
Portland,
OR,
79
pp
Daniels
RF,
Burkhart
HE
(1975)
Simulation
of
Individual
Tree
Growth
and
Stand
Develop-
ment
in
Managed
Loblolly
Pine
Plantations.
Div
For
Wildl
Res,
Virginia
Polytechnic
Insti-
tute
and
State
University,
Doc
FWS-5-75,
69 pp
Decourt
N
(1967)
Le
Douglas
dans
le
nord-est
du
Massif
Central.
Ann
Sci
For
24, 45-54
Decourt
N
(1972)
Méthode
utilisée
pour
la
cons-
truction
rapide
de
tables
de
production
provi-
soires
en
France.
Ann
Sci
For
29,
35-48
Ek
AR
(1974)
Nonlinear
models
for
stand
table
projection
in
northern
hardwood
stands.
Can
J
For
Res
4,
23-27
Flewelling
JW,
Plenaar
LV
(1981)
Multiplicative
regression
with
log-normal
errors.
For
Sci
27,
281-289
Goulding
CJ
(1972)
Simulation
techniques
for
a
stochastic
model
of
the
growth
of
Douglas-fir.
Ph
D
Thesis,
Univ
Br
Columbia,
234
p
Grace
CG
(1990)
Modeling
the
interception
of
solar
radiant
energy
and
net
photosynthesis.
In:
Process
Modeling
of
Forest
Growth
Re-
sponses
to
Environmental
Stress
(Dixon
RK,
Meldahl
RS,
Ruark
GA,
Warren
WG,
eds)
Timber
Press,
Portand,
OR,
142-158
Hamilton
JM
(1969)
The
dependance
of
volume
increment
of
individual
trees
on
dominance,
crown
dimensions,
and
competition.
Forestry
42, 131-144
Hamilton
GJ,
Christie
JM
(1974)
Construction
and
application
of
stand
yield
models.
In:
Growth
Models
for
Tree
and
Stand
Simula-
tion
(Fries
J,
eds)
Dept
For
Yield
Res,
R
Coll
For,
Stockholm,
Res
Notes
30,
223-239
Hegyi
(1974)
A
simulation
model
for
managing
Jack-pine
stands.
In:
Growth Models
for
Tree
and
Stand
Simulation
(Fries
J,
ed)
Dep
For
Yield
Res,
R
Coll
For
(Stockholm)
Res
Notes
30, 74-90
Hyink
DM,
Moser
JW
Jr
(1983)
A
generalized
framework
for
projecting
forest
yield
and
stand
structure
using
diameter
distributions.
For
Sci 29,
85-95
Inose
M
(1982)
Tree
growth
model
based
on
crown
competition
in
Todomatsu
(Abies
sa-
chalinensis).
I.
The
relationship
between
crown
development
and
volume
increment.
Bull
For
For
Prod
Res
Inst 318, 103-127
Inose
M
(1985)
Tree
growth
model
based
on
the
crown
competition
of
Todomatsu
(Abies
sachalinensis).
II.
Estimation
of
the
diameter
increment
and
bark
thickness.
Bull
For
For
Prod
Res Inst
334, 1-20
Johnson
GP
(1986)
Evaluation
of
current
Doug-
las-fir
growth
models:
a
user’s
perspective.
In:
Douglas-Fir:
Stand
Management
for
the
Future
(Oliver
CD,
Hanley
DP,
Johnson
JA,
eds)
Coll
For
Res,
Univ
of
Washington
Co,
For
Res
Contribution
No
55
(388
pp)
360-363
King
JE
(1966)
Site
Index
Curves
for
Douglas
Fir
in
the
Pacific
Northwest.
Weyerhauser
Co,
For
Res
Cent
For
Pap
8,
49
Larson
PR
(1963)
Stem
form
development
of
forest
trees.
For
Sci
Monogr 5,
42
Lin
JY
(1974)
Stand
growth
simulation
models
for
Douglas-fir
and
western
hemlock
in
the
Nortwestern
United
States.
In:
Growth
Mod-
els for
Tree
and
Stand
Simulation
(Fries
J,
ed)
Dep
For
Yield
Res,
R
Coll
For,
Stock-
holm,
Res
Notes
30,
74-90
Mitchell
KJ
(1969)
Simulation
of
growth
of
even-
aged
stands
of
white
spruce.
Yale
Univ
School
For
Bull 75,
48
Mitchell
KJ
(1971)
Description
and
Growth
Sim-
ulation
of
Douglas-Fir
Stands.
Canadian
Fo-
restry
Service,
Department
of
the Environ-
ment,
Victoria,
British
Columbia
(Canada).
Int
Rep
BC-25,
34
pp
Mitchell
KJ
(1975a)
Dynamics
and
simulated
yield
of
Douglas-fir.
For
Sci
Monogr
17,
39
p
Mitchell
KJ
(1975b)
Stand
description
and
growth
simulation
from
low-level
photos
of
tree
crowns.
J
For 73
(12-16),
45
Mitchell
KJ,
Oswald
H,
Ottorini
JM
(1983)
Mod-
elling
the
growth
of
Douglas-fir
in
France.
In:
Mitt
Forstl
Bundesversuchsanst
Wien
147,
25-39
Newnham
R
(1964)
The
development
of
a
stand
model
for
Douglas-fir.
Ph
D
Thesis,
Universi-
ty
of
Britisch
Columbia,
201
pp
Ottorini
JM
(1981)
Application
des
données
de
l’IFN
à l’étude
de
la
production
du
Pin
sylves-
tre
en
Margeride.
B.
Production
totale
en
vol-
ume.
Ann
Sci
For 38,
487-502
Silver
GT
(1962)
The
distribution
of
Douglas-fir
foliage
by
age.
For
Chron
38,
433-438
Staebler
GR
(1951)
Growth
and
spacing
in
an
even-aged
stand
of
Douglas-fir.
Ph
D
thesis,
University
of
Michigan,
46
pp
Tomé
M,
Burkhart
HE
(1989)
Distance-
dependent
competition
measures
for
predict-
ing
growth
of individual
trees.
For
Sci
35,
816-831
Vose
JM,
Allen
HL
(1988)
Leaf
area,
stemwood
growth,
and
nutrition
relationships
in
loblolly
pine.
For
Sci
34,
547-563
Waring
RH,
Thies
WG,
Muscato D
(1980)
Stem
growth
per
unit
of
leaf
area:
a
measure
of
tree
vigor.
For
Sci
26, 112-117
Wilson
BF
(1984)
The
Growing
Tree.
The
Uni-
versity
of
Massachusetts
Press,
Amherst,
MA