Báo cáo y học: "Reliability of computerized image analysis for the evaluation of serial synovial biopsies in randomized controlled trials in rheumatoid arthritis" pps
Bạn đang xem bản rút gọn của tài liệu. Xem và tải ngay bản đầy đủ của tài liệu tại đây (327.26 KB, 6 trang )
Open Access
Available online />R862
Vol 7 No 4
Research article
Reliability of computerized image analysis for the evaluation of
serial synovial biopsies in randomized controlled trials in
rheumatoid arthritis
Jasper J Haringman
1
, Marjolein Vinkenoog
1
, Danielle M Gerlag
1
, Tom JM Smeets
1
,
Aeilko H Zwinderman
2
and Paul P Tak
1
1
Division of Clinical Immunology and Rheumatology, Academic Medical Center/University of Amsterdam, The Netherlands
2
Department of Clinical Epidemiology and Biostatistics, Academic Medical Center/University of Amsterdam, The Netherlands
Corresponding author: Paul P Tak,
Received: 14 Sep 2004 Revisions requested: 4 Nov 2004 Revisions received: 13 Apr 2005 Accepted: 14 Apr 2005 Published: 12 May 2005
Arthritis Research & Therapy 2005, 7:R862-R867 (DOI 10.1186/ar1757)
This article is online at: />© 2005 Haringman et al. licensee BioMed Central Ltd.
This is an Open Access article distributed under the terms of the Creative Commons Attribution License ( />2.0), which permits unrestricted use, distribution, and reproduction in any medium, provided the original work is properly cited.
Abstract
Analysis of biomarkers in synovial tissue is increasingly used in
the evaluation of new targeted therapies for patients with
rheumatoid arthritis (RA). This study determined the intrarater
and inter-rater reliability of digital image analysis (DIA) of
synovial biopsies from RA patients participating in clinical trials.
Arthroscopic synovial biopsies were obtained before and after
treatment from 19 RA patients participating in a randomized
controlled trial with prednisolone. Immunohistochemistry was
used to detect CD3
+
T cells, CD38
+
plasma cells and CD68
+
macrophages. The mean change in positive cells per square
millimetre for each marker was determined by different
operators and at different times using DIA. Nonparametric tests
were used to determine differences between observers and
assessments, and to determine changes after treatment. The
intraclass correlations (ICCs) were calculated to determine the
intrarater and inter-rater reliability. Intrarater ICCs showed good
reliability for measuring changes in T lymphocytes (R = 0.87),
plasma cells (R = 0.62) and macrophages (R = 0.73). Analysis
by Bland–Altman plots showed no systemic differences
between measurements. The smallest detectable changes were
calculated and their discriminatory power revealed good
response in the prednisolone group compared with the placebo
group. Similarly, inter-rater ICCs also revealed good reliability for
measuring T lymphocytes (R = 0.68), plasma cells (R = 0.69)
and macrophages (R = 0.72). All measurements identified the
same cell types as changing significantly in the treated patients
compared with the placebo group. The measurement of change
in total positive cell numbers in synovial tissue can be
determined reproducibly for various cell types by DIA in RA
clinical trials.
Introduction
Rheumatoid arthritis (RA) is characterized by chronic and sym-
metric inflammation of synovial joints [1,2]. Although the aeti-
ology of RA is still unknown, it is thought of as an autoimmune
disease with the synovial tissue (ST) being its primary target.
The microscopic appearance of RA ST includes marked inti-
mal lining layer hyperplasia due to increased numbers of fibob-
last-like synoviocytes and intimal macrophages, and
accumulation of macrophages, T cells, B cells, plasma cells,
dendritic cells, mast cells, natural killer cells and neutrophils in
the synovial sublining layer [3]. Developments in synovial
biopsy techniques, especially arthroscopy, have resulted in
easier access to human ST. It is now possible to select ST
from many sites within large and small joints, even in the earli-
est phases of disease, enhancing studies of aetiology, progno-
sis and response to treatment [4].
Analysis of biomarkers in ST is increasingly being used in the
evaluation of new targeted therapies in RA patients [5].
Numerous studies have suggested consistent associations
between rapidity and magnitude of both clinical and immuno-
histological responses. It was shown that, especially within the
ST, the number of infiltrating sublining macrophages can be
used as a biomarker of clinical efficacy in relatively small stud-
ies of short duration [6,7]. Therefore, change in synovial sub-
lining macrophages may be used as a biomarker for the
DIA = digital image analysis; ICC = intraclass correlation coefficient; RA = rheumatoid arthritis; SDC = smallest detectable change; ST = synovial
tissue.
Arthritis Research & Therapy Vol 7 No 4 Haringman et al.
R863
evaluation of novel antirheumatic therapies. In addition to
screening for possible efficacy, this approach provides insight
into the mechanism of action of treatment.
Within this setting, reliable and validated methods for studying
the ST are pivotal. The use of computerized or digital image
analysis (DIA) has greatly facilitated the evaluation of ST. The
major advantage of DIA is standardization of image acquisition
and processing, minimizing variance, and the ability to quantify
the actual stained area together with staining intensity in a time
efficient manner [8,9]. This allows analysis of large numbers of
stained sections. Strong correlations were observed between
CIA, semiquantitative scoring and manual counting for analy-
sis of ST cellular markers, cytokines and adhesion molecules
[10,11]. Although the reproducibility of measuring cytokine
and cell adhesion molecule staining by DIA was reported to be
within 10% [8], no formal studies investigating intrarater and
inter-rater variability have yet been reported. Therefore, we
designed a study to determine the intrarater and inter-rater reli-
ability of this approach for the analysis of synovial biopsies
from RA patients participating in clinical trials.
Materials and methods
Patients and samples
Arthroscopic synovial biopsies were obtained before and 2
weeks after treatment in 19 patients who participated in a dou-
ble-blind, placebo-controlled, single-centre study with pred-
nisolone, as reported earlier [6]. All patients included had RA
according to the 1987 criteria proposed by the American Col-
lege of Rheumatology [12] and were on a stable regimen of
disease-modifying antirheumatic drugs (methotrexate, sul-
phasalazine, hydroxychloroquine or leflunomide, or a combina-
tion of these) for at least 28 days before inclusion in the study.
Ten out of the 19 patients received prednisolone and nine
received placebo treatment. Needle arthroscopy of an actively
inflamed joint (knee, ankle, or wrist) was performed under local
anaesthesia in all patients before treatment and in the same
joint after treatment. The procedures for needle arthroscopy
were performed as described previously in detail [13,14]. Dur-
ing each procedure, biopsies were taken from six or more sites
throughout the joint to minimize sampling error [15,16]. These
specimens were directly collected en bloc in a mold embed-
ded in Tissue Tek OCT (Miles diagnostics, Elkhart, IN, USA)
and subsequently snap frozen by immersion in methylbutane (-
80°C). The frozen blocs were stored in liquid nitrogen until
they were processed. The study was approved by the Medical
Ethics Committee of the Academic Medical Center, Amster-
dam, The Netherlands, and all patients provided informed con-
sent before start of the study.
Immunohistochemical analysis
From each tissue sample, consisting of six different biopsy
samples, serial sections were cut with a cryostat (5 µm) and
stained with the following antibodies to analyze the major cell
populations in the synovium: anti-CD68 (EMB11; Dako, Glos-
trup, Denmark), anti-CD38 (HB-7; Becton Dickinson) and anti-
CD3 (SK7; Becton Dickinson, Erembodegem, Belgium). Sec-
tions with nonassessable tissue, defined as the absence of an
intimal lining layer, were not analyzed. For control sections, the
primary antibodies were omitted or irrelevant antibodies were
applied. Staining for cellular markers was performed using a
three-step immunoperoxidase method, as was previously
described [17].
Digital image analysis
After immunohistochemical staining, all coded sections were
randomly analyzed by computer-assisted image analysis (Fig.
1). For all markers, 18 high-power fields were analyzed. The
images of the high-power fields were analyzed using the Qwin
analysis system (Leica, Cambridge, UK), as described previ-
ously in detail [10,11].
For determination of intrarater reliability, one observer per-
formed the acquisition and analysis twice with an interval of 4
weeks in between (OB1 t0 and OB1 t1, respectively). To
determine the inter-rater reliability, acquisition of images and
analysis were performed independently by two other experi-
enced observers (OB2 and OB3). All observers were blinded
regarding clinical data. For each measurement all observers
independently set their own threshold levels regarding the
detection of stained antigen, nuclear staining and background
staining. After the analysis, all observers independently calcu-
lated the mean change in the total number of positive cells per
square millimetre of ST for each marker.
Statistical analysis
The nonparametric Friedman test and the Wilcoxon signed
rank test were used to identify differences in the detection of
the change in positive cell numbers per marker in the whole
patient group, between observers and between assessments.
The intrarater and inter-rater reliability was quantified by means
of the intraclass correlation coefficient (ICC) of agreement
[18]. In addition, scatter plots, in accordance with methods
reported by Bland and Altman [19], were constructed to show
differences in the change in positive cells between two meas-
urements from one observer. The smallest detectable changes
(SDCs), representing the smallest change in scores that can
be deemed to be a 'real' change [20], for the intra-observer
variances was calculated and used to evaluate their discimina-
tory power. The nonparametric Mann–Whitney U-test was
used to determine whether each analysis detected differences
in the change of positive cell numbers when the placebo group
was compared with the prednisolone-treated group.
Results
Intrarater reliability
The mean numbers of CD3
+
T lymphocytes, CD38
+
plasma
cells and CD68
+
sublining macrophages before and after
intervention for two analyses by the same observer at different
time points (OB1 t0 and OB1 t1) are shown in Table 1. There
Available online />R864
were no significant differences in the mean change in T cells,
plasma cells and macrophages in the total population between
the two measurements.
The overall correlations between the first and second analysis
by the same observer were good. For the measurement of the
change in CD3
+
T lymphocytes, CD38
+
plasma cells and
CD68
+
macrophages, the single rater and average of rater
ICCs were calculated and are shown in Table 2. The relations
between the two measurements by the single observer are
plotted in Fig. 2. There were no systemic differences between
the two measurements for each marker, but the variation was
rather large. An analysis of the between patient variances and
within patient variances is provided in Table 2.
The SDC, averaged for the number of readings, for CD3
+
lym-
phocytes was 182, for CD38
+
plasma cells it was 128, and for
CD68
+
macrophages it was 306. When these estimates were
used to identify those patients who responded to the treat-
ment (i.e. had a reduction in positive cell numbers exceeding
the SDC), for CD3
+
lymphocytes four of the 10 patients in the
prednisolone group responded versus none of the nine
patients in the placebo group; for CD38
+
plasma cells four of
the 10 patients in the prednisolone group responded versus
one of the nine patients in the placebo group; and for CD68
+
macrophages seven out of the 10 patients in the prednisolone
group responded versus none of the nine patients in the pla-
cebo group.
To determine whether the same observer identified the same
differences in the synovial infiltrate after treatment at different
time points, we determined whether there were significant dif-
ferences in the change in T cells, plasma cells and macro-
phages between the placebo group and the prednisolone-
treated group for each measurement. At both time points there
was, on average, a significant reduction in the number of CD3
+
lymphocytes and CD68
+
macrophages in the prednisolone-
treated patients as compared with placebo (Table 1), whereas
on average there were no significant changes in the number of
CD38
+
plasma cells.
Interrater reliability
The mean number of T cells, plasma cells and macrophages
before and after intervention measured by the other two
observers (OB2 and OB3) are also shown in Table 1. There
were no statistically significant differences in the mean change
in positive cells between the analyses by the three observers
(OB1 t0, OB2 and OB3).
When the overall correlations between the analyses of the
three observers were calculated the ICCs (single and average
of raters) appeared to be good for CD3
+
lymphocytes, CD38
+
plamsa cells and CD68
+
macrophages (Table 2). An analysis
of between patient variances and the within patient variances
is also provided in Table 2.
To determine whether all three observers identified the same
differences in the synovial infiltrate after treatment, we deter-
mined whether there were significant differences in the
change in T cells, plasma cells and macrophages between the
placebo group and the prednisolone-treated group for each
measurement. The measurements by all three observers
showed, on average, a significant reduction in the number of
CD3
+
lymphocytes and CD68
+
macrophages in the pred-
nisolone-treated patients versus placebo (Table 1), whereas,
on average, there were no significant changes in the number
of CD38
+
plasma cells.
Discussion
This study investigated the intra- and interobserver reliability of
assessment of the change in ST T cells, plasma cells, and
macrophages quantified by DIA. Tissue samples were
obtained from RA patients participating in a single-centre, pla-
cebo-controlled clinical trial with prednisolone. There were no
significant differences in measurement of the mean change in
T cells, plasma cells and macrophages between the three
observers, or for different measurements by one observer.
ICCs revealed good agreement between measurements. All
observers and all measurements identified, on average,
significant reductions in T cells and macrophages but not in
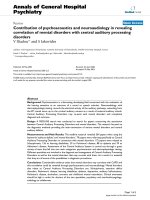
Figure 1
Acquisition, analysis and output for a digital image analysis systemAcquisition, analysis and output for a digital image analysis system.
Acquisition and analysis of immunohistochemical staining of CD3
+
T
lymphocytes in synovial tissue using a digital image analysis system
[10]. Three different areas from each biopsy sample, which are repre-
sentative of the whole tissue section are selected. During analysis,
staining thresholds are set for primary staining (i.e. CD3
+
T lym-
phocytes), nuclear staining and background staining. The output is gen-
erated in a spreadsheet as the total number of positive cells per square
millimetre of synovial tissue.
Arthritis Research & Therapy Vol 7 No 4 Haringman et al.
R865
plasma cells in the prednisolone group compared with
placebo.
It can be anticipated that there will be an upsurge in rand-
omized controlled trials investigating novel biological agents
and small molecules in terms of their safety and efficacy. Thus,
sensitive, validated and reliable measurements to screen for
potential efficacy in an early phase of drug development are
clearly needed. Clinical outcome measures have historically
been used as primary end-points, but their reliability may be
limited in small proof-of-principle studies. For clinical measure-
ments such as the tender and swollen joint count, ICCs have
been reported to vary between 0.15 and 0.85 for inter-rater
variability and between 0.67 and 0.95 for intrarater variability
[21]. Radiographic measurements, with the use of conven-
tional X-ray films, show good reliability in most studies but they
are not useful in short-term clinical trials [21]. The use of mag-
netic resonance images is promising, with acceptable inter-
rater ICC for global synovitis scores and bone erosions,
although optimal scoring systems are yet to be developed
[22].
In light of the need to screen various compounds for potential
efficacy in small numbers of patients and because of recent
technical developments, we believe that our thinking about
clinical trials is about to change dramatically. Clinical studies
conducted during early phases of drug development will
increasingly consist of small trials with a high density of biolog-
ical data [23]. Consistent with this notion, serial ST analysis
with evaluation of biomarkers was recently included in several
randomized clinical trials of both disease-modifying anti-rheu-
matic drugs and biological agents [6,13,24-27]. These and
other studies showed consistent relationships between the
magnitude of synovial changes and clinical response. In partic-
Table 1
Numbers of positive cells before and after intervention
Cell type Treatment Observer 1 t0 Observer 1 t1 Intra-observer
comparison
Observer 2 Observer 3 Inter-
observer
comparison
Placebo Prednisol
one
P
a
Placebo Prednisol
one
P
a
P
b
Placebo Prednisol
one
P
a
Placebo Prednisol
one
P
a
P
c
CD3
+
T
lymphocytes
Before 192 ±
246
358 ±
413
<0.0
5
110 ±
140
227 ±
225
<0.0
5
NS 179 ±
185
285 ±
250
<0.0
5
89 ± 110 112 ± 98 <0.0
5
NS
After 387 ±
391
140 ±
150
299 ±
356
44 ± 62 470 ±
618
101 ± 94 196 ±
224
54 ± 66
CD38
+
plasma
cells
Before 56 ± 87 99 ± 130 NS 73 ± 134 116 ±
166
NS NS 246 ±
307
397 ±
498
NS 145 ±
151
309 ±
380
NS NS
After 96 ± 127 37 ± 57 119 ±
149
42 ± 78 335 ±
411
132 ±
187
315 ±
416
83 ± 121
CD68
+
macrophages
Before 804 ±
422
973 ±
419
<0.0
3
441 ±
422
572 ±
404
<0.0
3
NS 937 ±
292
1151 ±
254
<0.0
3
621 ±
445
724 ±
360
<0.0
3
NS
After 972 ±
151
553 ±
342
632 ±
686
222 ±
278
984 ±
354
796 ±
306
720 ±
527
313 ±
291
Shown are the mean numbers (± standard deviation) of CD3
+
T lymphocytes, CD38
+
plasma cells and CD68
+
sublining macrophages per square
millimetre of synovial tissue before and after intervention, measured by one observer at two different time points (OB1 t0 and OB1 t1) and by two
other observers (OB2 and OB3) for placebo-treated patients and prednisolone-treated patients.
a
Nonparametric, unpaired, Mann–Whitney U-test
for the comparison between placebo and prednisolone treatment.
b
Nonparametric, paired, Wilcoxon signed rank test, for the comparison between
OB1 t0 and OB1 t1 (intra-observer comparison).
c
Nonparametric, paired, Friedman test, for the comparsion between the three observers (OB1 t0,
OB2 and OB3).
Table 2
Estimates of the variance components (between and within patients) and of the intraclass correlations (single rater and average of
raters)
Cell type Intra-observer Inter-observer
Between patients Within patients ICC ICC of the mean of
two observations
Between patients Within patients ICC ICC of the mean of
three observations
CD3
+
cells 11.59 1.73 0.87 0.93 10.13 4.85 0.68 0.86
CD38
+
cells 1.35 0.82 0.62 0.77 8.65 3.83 0.69 0.87
CD68
+
cells 20.32 7.35 0.73 0.85 18.92 7.19 0.72 0.89
ICC, intraclass correlation coefficient.
Available online />R866
ular, the change in infiltrating sublining macrophages was
identified to be a potent and sensitive synovial biomarker [6,7].
ST can easily and safely be obtained as a result of the intro-
duction of small-bore arthroscopes and the development of
local and regional anaesthesia protocols. Despite heterogene-
ity in the ST within a single joint, it has been shown that repre-
sentative measures of synovial inflammation can be obtained
by examining a limited area of tissue [15,28,29]. Previous work
[10,11] has also shown that DIA is a sensitive, time efficient
method for quantifying both the number of stained cells and
the staining intensity, with good correlations with both manual
counting and semiquantative scoring.
Although DIA is described as reliable and objective, little is
known about the variability and reliability of this tool. Variation
in measurements may result from a limited number of factors
with this approach. In our system the observer selects three
different areas of each six high-power fields from one slide,
which is composed of six biopsy samples from six different
sites in the joint. This is done in such a way that a representa-
tive area is selected, and this requires extensive training and
experience with the histopathological morphology of ST. After
scanning the representative high-power fields, the images are
analyzed by setting threshold values for the stained antigen,
nuclear staining and background staining [10]. These thresh-
olds are kept constant for all measurements with the same
marker within a study, but could theoretically give rise to varia-
tion when set by different observers or by one observer at dif-
ferent times. In the present study it was shown that these
variables did not result in different outcomes. There were good
ICCs when the findings of three experienced observers or the
findings of the same observer at different times were com-
pared. Analysis by Bland–Altman plots showed no systemic
differences with regard to the intra-observer measurements,
and the SDCs showed good discriminatory power when
applied to the treatment groups. In addition, all observers and
all measurements identified the same cell types (T cells and
macrophages) as decreasing significantly in the active treat-
ment group compared with placebo. All measurements also
identified a consistent trend toward reduced plasma cell num-
bers after corticosteroid treatment, which did not reach statis-
tical significance, possibly because of the relative small
number of patients included. Although this method does
exhibit good agreement in detecting changes in histological
markers, this does not necessarily mean that these results can
be extrapolated to the expression of a given marker at a given
time point, as used in cross-sectional studies of ST. In addi-
tion, it remains to be seen whether the same reliability holds
true for determination of changes in secreted proteins, such as
cytokines and chemokines.
Conclusion
In conclusion, the findings of the present study show the relia-
bility of ST analysis using a DIA system for the evaluation of
serial synovial biopsy samples before and after treatment. This
approach may be used for efficient quantification of synovial
biomarkers in small proof-of-principle clinical trials.
Competing Interests
The author(s) declare that they have no competing interests.
Authors' contributions
JJH contributed to experiments, was responsible for data anal-
ysis and interpretation, and wrote the manuscript. MV and
TJMS were responsible for both the set-up and performance
of the experiments. DMG was responsible for including
patients and collecting materials and data. AHZ coordinated
and assisted in the statistical analysis of the data. PPT was
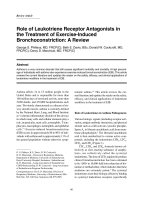
Figure 2
Mean change in number of positive cells versus the difference in change in positive cellsMean change in number of positive cells versus the difference in change in positive cells. Shown are scatter plots of the mean change in the number
of positive cells versus the difference in change of positive cells between two measurements by observer 1 for (a) CD3
+
lymphocytes, (b) CD38
+
plasma cells and (c) CD68
+
macrophages. The dotted line represents the mean ± 2 × standard deviation.
Arthritis Research & Therapy Vol 7 No 4 Haringman et al.
R867
responsible for planning the work and contributed to data anal-
ysis, interpretation and write up.
Acknowledgements
This study was supported by a grant from Zon-Mw (The Netherlands
Organisation for Health Research and Development), grant number
902-37-123.
References
1. O'Dell JR: Therapeutic strategies for rheumatoid arthritis. N
Engl J Med 2004, 350:2591-2602.
2. Firestein GS: Evolving concepts of rheumatoid arthritis. Nature
2003, 423:356-361.
3. Tak PP, Bresnihan B: The pathogenesis and prevention of joint
damage in rheumatoid arthritis: advances from synovial
biopsy and tissue analysis. Arthritis Rheum 2000,
43:2619-2633.
4. Bresnihan B, Tak PP: Synovial tissue analysis in rheumatoid
arthritis. Baillieres Best Pract Res Clin Rheumatol 1999,
13:645-659.
5. Tak PP: Lessons learnt from the synovial tissue response to
anti-rheumatic treatment. Rheumatology (Oxford) 2000,
39:817-820.
6. Gerlag DM, Haringman JJ, Smeets TJ, Zwinderman AH, Kraan MC,
Laud PJ, Morgan S, Nash AF, Tak PP: Effects of oral pred-
nisolone on biomarkers in synovial tissue and clinical
improvement in rheumatoid arthritis. Arthritis Rheum 2004,
50:3783-3791.
7. Haringman JJ, Gerlag DM, Zwinderman AH, Smeets TJ, Kraan MC,
Baeten D, McInnes IB, Bresnihan B, Tak PP: Synovial tissue mac-
rophages: highly sensitive biomarkers for response to treat-
ment in rheumatoid arthritis patients. Ann Rheum Dis 2005,
64:834-838.
8. Youssef PP, Triantafillou S, Parker A, Coleman M, Roberts-Thom-
son PJ, Ahern MJ, Smith MD: Variability in cytokine and cell
adhesion molecule staining in arthroscopic synovial biopsies:
quantification using color video image analysis. J Rheumatol
1997, 24:2291-2298.
9. Norazmi MN, Hohmann AW, Jarvis LR, Skinner JM, Stoll P, Bradley
J: The use of computer-assisted video image analysis in the
enumeration of immuno-stained cells in tissue sections. J
Immunol Methods 1990, 131:223-227.
10. Kraan MC, Haringman JJ, Ahern MJ, Breedveld FC, Smith MD, Tak
PP: Quantification of the cell infiltrate in synovial tissue by dig-
ital image analysis. Rheumatology (Oxford) 2000, 39:43-49.
11. Kraan MC, Smith MD, Weedon H, Ahern MJ, Breedveld FC, Tak
PP: Measurement of cytokine and adhesion molecule expres-
sion in synovial tissue by digital image analysis. Ann Rheum
Dis 2001, 60:296-298.
12. Arnett FC, Edworthy SM, Bloch DA, McShane DJ, Fries JF, Cooper
NS, Healey LA, Kaplan SR, Liang MH, Luthra HS, et al.: The Amer-
ican Rheumatism Association 1987 revised criteria for the
classification of rheumatoid arthritis. Arthritis Rheum 1988,
31:315-324.
13. Kraan MC, Reece RJ, Barg EC, Smeets TJ, Farnell J, Rosenburg R,
Veale DJ, Breedveld FC, Emery P, Tak PP: Modulation of inflam-
mation and metalloproteinase expression in synovial tissue by
leflunomide and methotrexate in patients with active rheuma-
toid arthritis. Findings in a prospective, randomized, double-
blind, parallel-design clinical trial in thirty-nine patients at two
centers. Arthritis Rheum 2000, 43:1820-1830.
14. Kraan MC, Reece RJ, Smeets TJ, Veale DJ, Emery P, Tak PP: Com-
parison of synovial tissues from the knee joints and the small
joints of rheumatoid arthritis patients: Implications for patho-
genesis and evaluation of treatment. Arthritis Rheum 2002,
46:2034-2038.
15. Dolhain RJ, Ter Haar NT, De Kuiper R, Nieuwenhuis IG, Zwinder-
man AH, Breedveld FC, Miltenburg AM: Distribution of T cells
and signs of T-cell activation in the rheumatoid joint: implica-
tions for semiquantitative comparative histology. Br J
Rheumatol 1998, 37:324-330.
16. Boyle DL, Rosengren S, Bugbee W, Kavanaugh A, Firestein GS:
Quantitative biomarker analysis of synovial gene expression
by real-time PCR. Arthritis Res Ther 2003, 5:R352-R360.
17. Tak PP, van der Lubbe PA, Cauli A, Daha MR, Smeets TJ, Kluin PM,
Meinders AE, Yanni G, Panayi GS, Breedveld FC: Reduction of
synovial inflammation after anti-CD4 monoclonal antibody
treatment in early rheumatoid arthritis. Arthritis Rheum 1995,
38:1457-1465.
18. Deyo RA, Diehr P, Patrick DL: Reproducibility and responsive-
ness of health status measures. Statistics and strategies for
evaluation. Control Clin Trials 1991, 12:142S-158S.
19. Bland JM, Altman DG: Statistical methods for assessing agree-
ment between two methods of clinical measurement. Lancet
1986, 1:307-310.
20. Bruynesteyn K, Boers M, Kostense P, van der LS, van der HD:
Deciding on progression of joint damage in paired films of
individual patients: smallest detectable difference or change.
Ann Rheum Dis 2005, 64:179-182.
21. Lassere MN, van der HD, Johnson KR, Boers M, Edmonds J: Reli-
ability of measures of disease activity and disease damage in
rheumatoid arthritis: implications for smallest detectable dif-
ference, minimal clinically important difference, and analysis
of treatment effects in randomized controlled trials. J
Rheumatol 2001, 28:892-903.
22. Lassere M, McQueen F, Ostergaard M, Conaghan P, Shnier R,
Peterfy C, Klarlund M, Bird P, O'Connor P, Stewart N, et al.:
OMERACT Rheumatoid Arthritis Magnetic Resonance Imaging
Studies. Exercise 3: an international multicenter reliability
study using the RA-MRI Score. J Rheumatol 2003,
30:1366-1375.
23. Liu ET, Karuturi KR: Microarrays and clinical investigations. N
Engl J Med 2004, 350:1595-1597.
24. Cunnane G, Madigan A, Murphy E, Fitzgerald O, Bresnihan B: The
effects of treatment with interleukin-1 receptor antagonist on
the inflamed synovial membrane in rheumatoid arthritis. Rheu-
matology (Oxford) 2001, 40:62-69.
25. Smeets TJ, Kraan MC, van Loon ME, Tak PP: Tumor necrosis fac-
tor alpha blockade reduces the synovial cell infiltrate early
after initiation of treatment, but apparently not by induction of
apoptosis in synovial tissue. Arthritis Rheum 2003,
48:2155-2162.
26. Haringman JJ, Kraan MC, Smeets TJ, Zwinderman KH, Tak PP:
Chemokine blockade and chronic inflammatory disease: proof
of concept in patients with rheumatoid arthritis. Ann Rheum
Dis 2003, 62:715-721.
27. Katrib A, Smith MD, Ahern MJ, Slavotinek J, Stafford L, Cuello C,
Bertouch JV, McNeil HP, Youssef PP: Reduced chemokine and
matrix metalloproteinase expression in patients with rheuma-
toid arthritis achieving remission. J Rheumatol 2003, 30:10-21.
28. Rooney M, Condell D, Quinlan W, Daly L, Whelan A, Feighery C,
Bresnihan B: Analysis of the histologic variation of synovitis in
rheumatoid arthritis. Arthritis Rheum 1988, 31:956-963.
29. Bresnihan B, Cunnane G, Youssef P, Yanni G, Fitzgerald O, Mul-
herin D: Microscopic measurement of synovial membrane
inflammation in rheumatoid arthritis: proposals for the evalu-
ation of tissue samples by quantitative analysis. Br J
Rheumatol 1998, 37:636-642.