Introduction to IP and ATM Design Performance - Part 3 doc
Bạn đang xem bản rút gọn của tài liệu. Xem và tải ngay bản đầy đủ của tài liệu tại đây (539.41 KB, 74 trang )
PART III
IP Performance and
Traffic Management
Introduction to IP and ATM Design Performance: With Applications Analysis Software,
Second Edition. J M Pitts, J A Schormans
Copyright © 2000 John Wiley & Sons Ltd
ISBNs: 0-471-49187-X (Hardback); 0-470-84166-4 (Electronic)
14
Basic Packet Queueing
the long and short of it
THE QUEUEING BEHAVIOUR OF PACKETS IN AN IP ROUTER
BUFFER
In Chapters 7 and 8, we investigated the basic queueing behaviour found
in ATM output buffers. This queueing arises because multiple streams of
cells are being multiplexed together; hence the need for (relatively short)
buffers. We developed balance equations for the state of the system at the
end of any time slot, from which we derived cell loss and delay results.
We also looked at heavy-traffic approximations: explicit equations which
could be rearranged to yield expressions for buffer dimensioning and
admission control, as well as performance evaluation.
In essence, packet queueing is very similar. An IP router forwards
arriving packets from input port to output port: the queueing behaviour
arises because multiple streams of packets (from different input ports) are
being multiplexed together (over the same output port). However, a key
difference is that packets do not all have the same length. The minimum
header size in IPv4 is 20 octets, and in IPv6, it is 40 octets; the maximum
packet size depends on the specific sub-network technology (e.g. 1500
octets in Ethernet, and 1000 octets is common in X.25 networks). This
difference has a direct impact on the service time; to take this into account
we need a probabilistic (rather than deterministic) model of service, and
a different approach to the queueing analysis.
As before, there are three different types of behaviour in which we are
interested:
ž the state probabilities, by which we mean the proportion of time that
a queue is found to be in a particular state (being in state k means the
queue contains k packets atthe timeat which it is inspected, andmeasu-
red over a very long period of time, i.e. the steady-state probabilities);
Introduction to IP and ATM Design Performance: With Applications Analysis Software,
Second Edition. J M Pitts, J A Schormans
Copyright © 2000 John Wiley & Sons Ltd
ISBNs: 0-471-49187-X (Hardback); 0-470-84166-4 (Electronic)
230 BASIC PACKET QUEUEING
ž the packet loss probability, by which we mean the proportion of
packets lost over a very long period of time;
ž the packet waiting-time probabilities, by which we mean the proba-
bilities associated with a packet being delayed k time units.
It turns out that accurate evaluation of the state probabilities is paramount
in calculating the waiting times and loss too, and for this reason we focus
on finding accurate and simple-to-use formulas for state probabilities.
BALANCE EQUATIONS FOR PACKET BUFFERING:
THE GEO/GEO/1
To analyse these different types of behaviour, we are going to start by
following the approach developed in Chapter 7, initially for a very simple
queue model called the Geo/Geo/1, which is the discrete-time version
of the ‘classical’ queue model M/M/1. One way in which this model
differs from that of Chapter 7 is that the fundamental time unit is reduced
from a cell service time to the time to transmit an octet (byte), T
oct
.Thus
we have a ‘conveyor belt’ of octets – the transmission of each octet of a
packet is synchronized to the start of transmission of the previous octet.
Using this model assumes a geometric distribution as a first attempt at
variable packet sizes:
bk D Prfpacket size is k octetsgD1 q
k1
Ð q
where
q D Prfa packet completes service at the end of an octet slotg
We use a Bernoulli process for the packet arrivals, i.e. a geometrically
distributed number of slots between arrivals (the first Geo in Geo/Geo/1):
p D Prfa packet arrives in an octet slotg
Thus we have an independent and identically distributed batch of k octets
(k D 0, 1, 2, ) arriving in each octet slot:
a0 D Prfno octets arriving in an octet slotgD1 p
ak D Prfk > 0octetsinanoctetslotgDp Ð bk
The mean service time for a packet is simply the mean number of octets
(the inverse of the exit probability for the geometric distribution, i.e. 1/q)
multiplied by the octet transmission time.
s D
T
oct
q
BALANCE EQUATIONS FOR PACKET BUFFERING: THE GEO/GEO/1 231
giving a packet service rate of
D
1
s
D
q
T
oct
The mean arrival rate is
D
p
T
oct
and so the applied load is given by
D
D
p
q
This is also the utilization, assuming an infinite buffer size and, hence, no
packet loss. We define the state probability, i.e. the probability of being
in state k,as
sk D Prfthere are k octets in the queueing system at the
end of any octet slotg
As before, the utilization is just the steady-state probability that the
system is not empty, so
D 1 s0
and therefore
s0 D 1
p
q
Calculating the state probability distribution
As in Chapter 7, we can build on this value, s0, by considering all the
ways in which it is possible to reach the empty state:
s0 D s0 Ð a0 C s1 Ð a0
giving
s1 D s0 Ð
1 a0
a0
D
1
p
q
Ð
p
1 p
Similarly, we find a formula for s2 by writing the balance equation for
s1, and rearranging:
s2 D
s1 s0 Ð a1 s1 Ð a1
a0
232 BASIC PACKET QUEUEING
which, after substituting in
a0 D 1 p
a1 D p Ð q
gives
s2 D s1 Ð
1 q
1 p
D
1
p
q
Ð
p
1 p
Ð
1 q
1 p
D
1
p
q
Ð
p
1 q
Ð
1 q
1 p
2
By induction, we find that
sk D
1
p
q
Ð
p
1 q
Ð
1 q
1 p
k
for k > 0
As in Chapter 7, the state probabilities refer to the state of the queue at
moments in time that are the ‘end of time unit instants’.
We can take the analysis one step further to find an expression for the
probability that the queue exceeds k octets, Qk:
Qk D 1 s0 s1 ÐÐÐsk
This gives a geometric progression which, after some rearrangement,
yields
Qk D
p
q
Ð
1 q
1 p
k
To express this in terms of packets, x, (recall that it is currently in terms
of octets), we can simply substitute
k D x Ð(mean number of octets per packet) D x Ð
1
q
giving an expression for the probability that the queue exceeds x packets:
Qx D
p
q
Ð
1 q
1 p
x
q
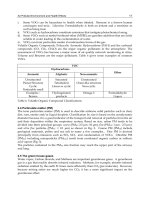
So, what do the results look like? Let’s use a load of 80%, for comparison
with the results in Chapter 7, and assume an average packet size of
BALANCE EQUATIONS FOR PACKET BUFFERING: THE GEO/GEO/1 233
500 octets. Thus
D
p
q
D 0.8
1
q
D 500 ) q D 0.002
p D 0.8 ð0.002 D 0.0016
The results are shown in Figure 14.1, labelled Geo/Geo/1. Those
labelled ‘Poisson’ and ‘Binomial’ are the results from Chapter 7
0 5 10 15 20 25
Buffer capacity, X
10
−6
10
−5
10
−4
10
−3
10
−2
10
−1
10
0
Pr{queue size > X}
Geo/Geo/1
Poisson
Binomial
q:D
1
500
p:D 0.8 Ð q
packetQ x :D
p
q
Ð
1 q
1 p
x
q
k:D 0 30
x
k
:D k
y1 :D packetQ x
Figure 14.1. Graph of the Probability that the Queue State Exceeds X,andthe
Mathcad Code to Generate (x, y) Values for Plotting the Geo/Geo/1 Results. For
Details of how to Generate the Results for Poisson and Binomial Arrivals to a
Deterministic Queue, see Figure 7.6
234 BASIC PACKET QUEUEING
(Figure 7.6) for fixed service times at a load of 80%. Notice that the
variability in the packet sizes (and hence service times) produces a
flatter gradient than the fixed-cell-size analysis for the same load. The
graph shows that, for a given performance requirement (e.g. 0.01), the
buffer needs to be about twice the size (X D 21) of that for fixed-size
packets or cells (X D 10). This corresponds closely with the difference, in
average waiting times, between M/D/1 and M/M/1 queueing systems
mentioned in Chapter 4.
DECAY RATE ANALYSIS
One of the most important effects we have seen so far is that the state
probability values we are calculating tend to form straight lines when the
queue size (state) is plotted on a linear scale, and the state probability is
plotted on a logarithmic scale. This is a very common (almost universal)
feature of queueing systems, and for this reason has become a key result
that we can use to our advantage.
As in the previous section, we define the state probability as
sk D Prfthere are k units of data – packets,
octets – in the queueing systemg
We define the ‘decay rate’ (DR) as the ratio:
sk C 1
sk
However, this ratio will not necessarily stay constant until k becomes
large enough, so we should actually say that:
DR D
sk C 1
sk
as k !1
as illustrated in Figure 14.2.
From the form of the equation, and the example parameter values in
Figure 14.1, we can see that the decay rate for the Geo/Geo/1 model is
constant from the start:
sk C 1
sk
D
1
p
q
Ð
p
1 q
Ð
1 q
1 p
kC1
1
p
q
Ð
p
1 q
Ð
1 q
1 p
k
D
1 q
1 p
DECAY RATE ANALYSIS 235
0 5 10 15 20 25 30
Queue size - linear scale
10
−5
10
−4
10
−3
10
−2
10
−1
10
0
State probability - logarithmic scale
90% load
80% load
Here we see a constant decay rate
Figure 14.2. The Decay Rate of the State Probabilities for the M/D/1 Queueing
System
But, as we mentioned previously, this is not true for most queueing
systems. A good example of how the decay rate takes a little while to
settle down can be found in the state probabilities generated using the
analysis, developed in Chapter 7, for an output buffer. Let’stakethecase
in which the number of arriving cells per time slot is Poisson-distributed,
i.e. the M/D/1, and choose an arrival rate of 0.9 cells per time slot. The
results are shown in Table 14.1.
The focus of buffer analysis in packet-based networks is always to
evaluate probabilities associated with information loss and delay. For
this reason we concentrate on the state probabilities as seen by an arriving
Table 14.1. Change in
Decay Rate for M/D/1
with 90% Load
Radio DR
s(1)/s(0) 1.4596
s(2)/s(1) 0.9430
s(3)/s(2) 0.8359
s(4)/s(3) 0.8153
s(5)/s(4) 0.8129
s(6)/s(5) 0.8129
s(7)/s(6) 0.8129
236 BASIC PACKET QUEUEING
packet.Thisisincontrasttothoseas seen by a departing packet, as in classical
queueing theory, or as left at random instants as we used in the time-slotted
ATM buffer analysis of Chapter 7. The key idea is that, by finding the
probability of what is seen ahead of an arriving packet, we have a very
good indicator of both:
ž the waiting time – i.e. the sum of the service time of all the packets
ahead in the queue
ž the loss – the probability that the buffer overflows a finite length is
often closely approximated by the probability that the infinite buffer
model contains more than would fit in the given finite buffer length.
Using the decay rate to approximate the buffer overflow probability
Having a constant decay rate is just the same as saying that we have a
geometric progression for the state probabilities:
PrfkgD 1 p Ð p
k
To find the tail probability, i.e. the probability associated with values
greater than k,wehave
Prf>kgD1 Prf0gPrf1gÐÐÐPrfkg
Buffer capacity
10
−3
10
−2
10
−1
10
0
Overflow probability
constant multiplier
decay rate
010203040
constant multiplierConstant multiplier
decay rateDecay rate
Figure 14.3. Decay Rate Offset by a Constant Multiplier
DECAY RATE ANALYSIS 237
After substituting in the geometric distribution, and doing some algebraic
manipulation we have
Prf>kgD1 1 p 1 p Ð p ÐÐÐ1 p Ð p
k
p Ð Prf>kgDp 1 p Ð p ÐÐÐ 1 p Ð p
k
1 p Ðp
kC1
1 p Ð Prf>kgD1 1 p p C 1 p Ð p
kC1
0.0
0.1 0.2 0.3 0.4 0.5 0.6 0.7 0.8 0.9 1.0
Load
Loss probability
exact packet loss probability
approx. buffer overflow
10
0
10
−1
10
−2
10
−3
10
−4
10
−5
10
−6
10
−7
10
−8
10
−9
10
−10
Q X, s :D qx
0
1 s
0
for i 2 1 XifX> 0
qx
i
qx
i1
s
i
qx
X
i:D 10
j:D 0 14
k:D 0 30
load
j
:D
j
20
C 0.25
aP
k,j
:D Poisson k, load
j
x
j
:D load
j
y1
j
:D finiteQloss i, aP
hji
, x
j
yP
j
:D infiniteQ i, aP
hji
, x
j
y2
j
:D Q i, yP
j
Figure 14.4. Comparison of Qx and Loss Probability for the M/D/1 Queue Model,
with a Finite Buffer Capacity of 10 Packets
238 BASIC PACKET QUEUEING
which, after dividing through by (1 p), yields
Prf>kgDp
kC1
However, many of the buffer models we have to deal with are best
modelled by a constant decay rate, d
r
, that is offset by another constant
multiplier, C
m
. This is illustrated in Figure 14.3. If we know both the
value of the decay rate and the constant multiplier then we can estimate
the buffer overflow probability from:
Prfbuffer overflowg³C
m
Ð d
XC1
r
where X is the buffer length in packets.
This ties in very nicely with our earlier work in Chapter 9 on the
burst-scale loss and burst-scale delay models for ATM buffering, where
the value of the constant was evaluated via the probability that ‘acell
needs a buffer’. We use a similar approach in Chapter 15 for evaluating
the resource implications of many ON–OFF sources being multiplexed
in an IP router.
At this stage it is worth looking at some numerical comparisons
for typical queueing systems, plotting the probability of buffer over-
flow against the packet loss probability. Figure 14.4 compares these
two measures for the M/D/1 system. This comparison (i.e. using state
probabilities seen by arrivals) shows that Prfinfinite buffer contains > Xg
is a good approximation for the loss probability. This is the sort of
simplification that is frequently exploited in buffering analyses.
BALANCE EQUATIONS FOR PACKET BUFFERING: EXCESS-RATE
QUEUEING ANALYSIS
The advantage of the Geo/Geo/1 is that it is simple, and the high
variability in its service times have allowed some to claim it is a ‘worst-
case’ model. We need to note two points: the Bernoulli input process
assumes arrivals as an instantaneous batch (which, as we will see in the
next chapter, has a significant effect); and the geometric distribution of
the packet lengths is an overestimation of the amount of variation likely
to be found in real IP networks. The second of these problems, that the
geometric is an unrealistic model of IP packets as it gives no real upper
limit on packet lengths, can be overcome by more realistic packet-size
distributions.
To address this, we develop an analytical result into which a variety
of different packet-size distributions can be substituted relatively simply.
To begin with, we assume fixed-size packets (i.e. the M/D/1 queue) and
derive a formula that is more convenient to use than the recurrence equa-
tions of Chapter 7 and significantly more accurate than the heavy-traffic
BALANCE EQUATIONS FOR PACKET BUFFERING: EXCESS-RATE QUEUEING ANALYSIS 239
approximations of Chapter 8. This formula can be applied to cell-scale
queueing in ATM as well as to packet queueing for real-time services
such as voice-over-IP (which have fixed, relatively short, packet lengths).
Then we show how this formula can be applied for variable-size
packets of various distributions. One particular distribution of interest is
the bi-modal case: here, the packet lengths take one of two values, either
the shortest possible or the longest possible. The justification for this is
that in real IP networking situations there is a clear division of packets
along these lines; control packets (e.g. in RSVP and TCP) tend to be very
short, and data packets tend to be the maximum length allowable for the
underlying sub-network technology.
Theexcess-rateM/D/1,forapplicationtovoice-over-IP
We introduced the notion of ‘excess-rate’ arrivals in Chapter 9 when we
considered burst-scale queueing behaviour. Then, we were looking at
the excess of arrival rate over service rate for durations of milliseconds
ormore,i.e.multiplecellslots.IntheexampleofFigure9.2,theexcess
rate was 8% of the service capacity over a period of 24 cell slots, i.e.
approx. 2 cells in 68
µs. Typical bursts last for milliseconds, and so if this
excess rate lasts for 2400 time slots, then about 200 cells must be held
temporarily in the output buffer, or they are lost if there is insufficient
buffer space.
Now, suppose we reduce the duration over which we define excess-
rate arrivals to the time required to serve a fixed-length packet. Let
this duration be our fundamental unit of time. Thus, ‘excess-rate’ (ER)
packets are those which must be buffered as they represent an excess of
instantaneous arrival rate over the service rate; if N packets arrive in any
time unit, then that time unit experiences N 1excesspackets.
Why should we do this? Well, for two reasons. First, we get a clearer
idea of how the queue changes in size: for every excess-rate packet,
the queue increases by one; a single packet arrival causes no change
in the queue state (because one packet is also served), and the queue
only decreases when there are no packets arriving in any time unit (see
Figure 14.5). We can then focus on analysing the behaviour that causes
the queue to change in size. Instead of connecting ‘end of slot k’ with
‘end of slot k C 1’ via a balance equation (i.e. using an Imbedded Markov
Chain at ends of slots, as in Chapter 7), we connect the arrival of excess-
rate packets via the balance equations (in a similar way to the discrete
fluid-flow approach in Chapter 9).
Secondly, it gives us the opportunity to use a form of arrival process
which simplifies the analysis. We alter the Poisson process to produce
a geometric series for the tail of the distribution (Figure 14.6), giving a
geometrically distributed number of ER packets per time unit. We call
240 BASIC PACKET QUEUEING
Time unit = mean packet service time
IMC
Single packet
arrival causes no
change in the
queue state
Excess arrivals cause
queue level to increase
No arrival during time
unit causes queue
level to decrease
Figure 14.5. Excess-Rate Queueing Behaviour
012345
Number of arrivals, k, per time unit
10
−3
10
−2
10
−1
10
0
Probability of k arrivals per time unit
Under load
No change
Excess arrivals
q
q
q
l − e
−λ
− λ⋅e
−λ
e
−λ
λ⋅e
−λ
q
Figure 14.6. The Geometrically Approximated Poisson Process
this the Geometrically Approximated Poisson Process (GAPP) and define
the conditional probability
q D Prfanother ER packet arrives in a time unitjjust had oneg
Thus the mean number of ER packets in an excess-rate batch, E[B], is
given by
E[B] D
1
1 q
BALANCE EQUATIONS FOR PACKET BUFFERING: EXCESS-RATE QUEUEING ANALYSIS 241
But we can find an expression for E[B] based on the arrival probabilities:
E[B] D
1
iD2
i 1 Ð ai
1 a0 a1
where
ak D Prfk arrivals in a packet service timeg
The numerator weights all the probabilities of having i packets arriving
by the number that are actually excess-rate packets, i.e. i 1. This ranges
over all situations in which there is at least one excess-rate packet arrival.
The denominator normalizes the probabilities to this condition (that there
are ER arrivals). A simple rearrangement of the numerator gives
E[B] D
1
iD1
i Ð ai
1
iD1
ai
1 a0 a1
D
E[a] 1 a0
1 a0 a1
where E[a] is the mean number of packets arriving per unit time. We now
have an expression for the parameter of the geometric ER series:
q D 1
1
E[B]
D 1
1 a0 a1
E[a] 1 Ca0
Consider now how the queue increases in size by one packet. We define
the state probability as
pk D Prfan arriving excess-rate packet finds k packets in the bufferg
Remember that we are creating an Imbedded Markov Chain at excess-
rate arrival instants. Thus to move from state k to k C1 either we need
another ER packet in the same service time interval, with probability q,
or for the queue content to remain unchanged until the next ER packet
arrival. To express this latter probability we need to define
dk D Prfqueue content decreases by k packets between ER arrivalsg
and
Dk D Prfqueue content decreases by at least k packets
between ER arrivalsg
242 BASIC PACKET QUEUEING
The queue size decreases only when there is no arrival, and it remains
the same only when there is one arrival. For the queue to decrease
by k packets between excess arrivals, there must be k slots with no
arrivals, with probability a0, any number of slots with one arrival, with
probability a1, and then a slot with excess arrivals, with probability
1 a0 a1.Sodk is given by
dk D
1
nDk
n
C
k
Ð a0
k
Ð a1
nk
Ð 1 a0 a1
In fact, we only need d0 in the queue analysis, and this is simply
d0 D
1
nD0
a1
n
Ð 1 a0 a1
which reduces to
d0 D
1 a0 a1
1 a1
We also require
D1 D 1 d 0 D
a0
1 a1
Now, for the balance equations: in a similar way to the discrete fluid-flow
analysis in Chapter 9, we develop these by equating the up and down
probabilities of crossing between adjacent queue states. As before, we are
concerned with the state as seen by an excess-rate arrival, so we must
consider arriving packets one at a time. Thus the state can only ever
increase by one.
Initially, let the buffer capacity be X packets. To cross between states
X 1andX, an arriving excess-rate packet sees X 1, taking the queue
state up to X, and another excess-rate packet follows to see the queue in
state X. This happens either immediately, with probability q,orafterany
number of time units in which the queue state stays the same, i.e. with
probability 1 q Ð d0. So the probability of going up is
Prfgoing upgDq C 1 q Ð d 0 ÐpX 1
To go down, an arriving excess-rate packet sees X in the queue and is
lost (because the buffer is full) and then there is a gap containing any
number of time units, at least one of which is empty and the rest in which
the queue state does not change. Then the next excess-rate arrival sees
fewer than X in the queue. For this to happen, it is simply the probability
that the next ER packet does not see X,or,putanotherway,oneminus
BALANCE EQUATIONS FOR PACKET BUFFERING: EXCESS-RATE QUEUEING ANALYSIS 243
the probability that the next ER packet does see X. This latter probability
has the same conditions as the up transition, i.e. either another ER packet
follows immediately, or it follows after any number of time units in which
the queue state stays the same. So
Prfgoing downgD1 q C 1 q Ð d0 Ð pX
Equating the probabilities of going up and down gives
q C 1 q Ð d0 Ð pX 1 D 1 q C1 q Ð d0 Ð pX
For a line between X 1andX 2, equating probabilities gives
q C 1 q Ð d0 Ð pX 2 D 1 q C1 q Ð d0 ÐD1 Ð pX
C 1 q C1 q Ð d0 ÐD1 Ð pX 1
The left-hand side is the probability of going up, and has the same
conditions as before. The probability of coming down, on the right-hand
side of the equation, contains two possibilities. The first term is for an
arriving ER packet which sees X in the queue and is lost (because the
buffer is full) and the second term is for an arriving ER packet which
sees X 1 in the queue, taking the state of the queue up to X. Then, in
both cases, there is a period without ER packets during which the queue
content decreases by at least two empty time units, so that the next ER
arrival sees fewer than X 1 in the queue.
Substituting for pX, and rearranging gives
q C 1 q Ð d0 Ð pX 2 D D1 Ð pX 1
In the general case, for a line between X i C1andX i, the probability
of going up remains the same as before, i.e. the only way to go up is
for an ER packet to see X i, and to be followed (either immediately
or after a period during which the queue state remains the same) by
another ER packet which sees X i C1. The probability of going down
consists of many components, one for each state above X i,butthey
can be arranged in two groups: the probability of coming down from
X i C 1 itself; and the probability of coming down to below X i C 1
from above X i C1. This latter is just the probability of going down
between X i C2andX i C1 multiplied by D1,whichisthesame
as going up from X i C 1 multiplied by D1.Thisispreciselythesame
grouping as illustrated in Figure 9.10 for the discrete fluid-flow approach.
The general equation then is
q C 1 q Ð d0 Ð pX i D D1 Ð pX i C 1
244 BASIC PACKET QUEUEING
so
pX D p0 Ð
q C 1 q Ð d0
D1
X
The state probabilities must sum to 1, so
X
iD0
pi D p0 Ð
X
iD0
q C 1 q Ð d0
D1
i
D 1
and we can find p0 thus
p0 D
1
q C 1 q Ð d0
D1
1
q C 1 q Ð d0
D1
XC1
Now, although we have assumed a finite buffer capacity of X packets, let
us now assume X !1. The term in the denominator for p0 tends to 1,
and so the state probabilities can be written
pk D
1
q C 1 q Ð d0
D1
Ð
q C 1 q Ð d0
D1
k
Substituting for q, d0 and D1 gives
pk D
1
E[a] Ð 1 a1 1 C a1 Ca0
2
a0 ÐE[a] 1 Ca0
Ð
E[a] Ð 1 a1 1 C a1 Ca0
2
a0 ÐE[a] 1 Ca0
k
Now, although this expression looks rather messy, its structure is quite
simple:
pk D 1 decay rate Ð [decay rate]
k
The probability that the queue exceeds k packets is then a geometric
progression which, after rearrangement, yields
Qk D [decay rate]
kC1
i.e.
Qk D
E[a] Ð 1 a1 1 C a1 Ca0
2
a0 ÐE[a] 1 Ca0
kC1
BALANCE EQUATIONS FOR PACKET BUFFERING: EXCESS-RATE QUEUEING ANALYSIS 245
These then are the general forms for pk and Qk, into which we can
substitute appropriate expressions from the Poisson distribution, i.e.
E[a] D
a0 D e
a1 D Ð e
to give
pk D
1
Ð e
e
2
C C e
1 Ce
Ð
Ð e
e
2
C C e
1 C e
k
Qk D
Ð e
e
2
C C e
1 C e
kC1
Well, was it really worth all the effort? Let’s take a look at some results.
Figure 14.7 shows the queue state probabilities for three different values
of D 0.55, 0.75, 0.95. In the figure, the lines are the exact results found
using the approach developed in Chapter 7, with Poisson input, and the
markers show the results from the excess-rate analysis with GAPP input.
Note that the results from the exact analysis are discrete, not continuous,
but are shown as continuous lines for clarity.
Figure 14.8 shows the results for Qk, the probability that the queue
exceeds k, comparing exact and excess-rate GAPP analyses. Figure 14.9
compares the excess-rate GAPP results with those from the heavy-traffic
analysis in Chapter 8. It is clear that the excess-rate GAPP provides a
very accurate approximation to the exact results across the full range of
load values, and it is significantly more accurate than the heavy-traffic
approximation.
The excess-rate solution for best-effort traffic
But how can we use the excess-rate analysis if we have variable-length
packets, as is typical with current best-effort IP networks? The key here is
to go back to the definition of ak, the probability of k arrivals in a packet
service time, because it is from a0, a1 and the mean of this distribution,
E[a], that we derive the excess-rate queueing behaviour (see Figures 14.5
and 14.6).
Previously, we assumed a constant service time, T D 1timeunit.Thus,
for packets arriving at an average rate of packets per time unit, the
probability that there are no packets arriving in one packet service time
is given by
a0 D
ÐT
0
0!
Ð e
ÐT
D e
246 BASIC PACKET QUEUEING
01020
30
40
Queue size
State probability
Exact 95%
ER GAPP 95%
Exact 75%
ER GAPP 75%
Exact 55%
ER GAPP 55%
10
0
10
−1
10
−2
10
−3
10
−4
10
−5
10
−6
10
−7
10
−8
10
−9
10
−10
k:D 0 40
aP95
k
:D Poisson k, 0.95
aP75
k
:D Poisson k, 0.75
aP55
k
:D Poisson k, 0.55
GAPPMDI k,:D
1
Ðe
e
2
C C e
1 C e
Ð
Ðe
e
2
C C e
1 C e
k
x
k
:D k
y1 :D infiniteQ 40, aP95, 0.95
y2 :D GAPPMDI x, 0.95
y3 :D infiniteQ 40, aP75, 0.75
y4 :D GAPPMDI x, 0.75
y5 :D infiniteQ 40, aP55, 0.55
y6 :D GAPPMDI x, 0.55
Figure 14.7. State Probability Distributions at Various Load Levels, Comparing the Exact Analysis
and Excess-Rate Analysis Methods
BALANCE EQUATIONS FOR PACKET BUFFERING: EXCESS-RATE QUEUEING ANALYSIS 247
0 10203040
Buffer capacity, X
10
−10
10
−9
10
−8
10
−7
10
−6
10
−5
10
−4
10
−3
10
−2
10
−1
10
0
Pr{queue size > X}
Exact 95%
ER GAPP 95%
Exact 75%
ER GAPP 75%
Exact 55%
ER GAPP 55%
k:D 0 40
GAPPMD1Q k,:D
Ðe
e
2
C C e
1 Ce
kC1
x
k
:D k
yP1 :D infiniteQ 40, aP95, 0.95
y1 :D Q 40, yP1
y2 :D GAPPM1Q x, 0.95
yP3 :D infiniteQ 40, aP75, 0.75
y3 :D Q 40, yP3
y4 :D GAPPMD1Q x, 0.75
yP5 :D infiniteQ 40, aP55, 0.55
y5 :D Q 40, yP5
y6 :D GAPPMD1Q x, 0.55
Figure 14.8. Probability that the Queue Exceeds X for Various Load Levels,
Comparing the Exact Analysis and Excess-Rate Analysis Methods
But what if 50% of the packets are short, say 40 octets, and 50% of the
packets are long, say 960 octets? The average packet length is 500 octets,
equivalent to one time unit. The probability that there are no packets
arriving in one packet service time is now a weighted sum of the two
possible situations, i.e.
248 BASIC PACKET QUEUEING
0 10203040
Buffer capacity, X
10
−10
10
−9
10
−8
10
−7
10
−6
10
−5
10
−4
10
−3
10
−2
10
−1
10
0
Pr{queue size > X}
Heavy Traffic 95%
ER GAPP 95%
Heavy Traffic 75%
ER GAPP 75%
Heavy Traffic 55%
ER GAPP 55%
k:D 0 40
HeavyTrafficMD1Q k,:D e
2ÐkÐ
1
x
k
:D k
y1 :D HeavyTrafficMD1Q x, 0.95
y2 :D GAPPMD1Q x, 0.95
y3 :D HeavyTrafficMD1Q x, 0.75
y4 :D GAPPMD1Q x, 0.75
y5 :D HeavyTrafficMD1Q x, 0.55
y6 :D GAPPMD1Q x, 0.55
Figure 14.9. Probability that the Queue Exceeds X for Various Load Levels,
Comparing the Excess-Rate and Heavy Traffic Approximation Methods
a0 D 0.5 Ð
Ð
40
500
0
0!
Ð e
Ð
40
500
C 0.5 Ð
Ð
960
500
0
0!
Ð e
Ð
960
500
giving
a0 D 0.5 Ð e
Ð
2
25
C 0.5 Ðe
Ð
48
25
The same approach applies for a1,i.e.
a1 D 0.5 Ð Ð
2
25
Ð e
Ð
2
25
C 0.5 Ð Ð
48
25
Ð e
Ð
48
25
BALANCE EQUATIONS FOR PACKET BUFFERING: EXCESS-RATE QUEUEING ANALYSIS 249
Let’s make this more general. Assume we have short packets of length 1
time unit, and long packets of length n time units. The proportion of short
packets is p
s
, and so the proportion of long packets is (1 p
s
). Packets
arrive at a rate of packets per time unit. The mean service time (in time
units) is then simply
s D p
s
Ð 1 C1 p
s
Ð n
and mean number of arrivals per packet service time (i.e. the utilization)
is given by
E[a] D D Ðs D Ðfp
s
C 1 p
s
Ð ng
The general form for the probability of k arrivals in a packet service time
is then given by
ak D p
s
Ð
k
k!
Ð e
C 1 p
s
Ð
n Ð
k
k!
Ð e
nÐ
So for bi-modal packet-size distributions, we have the following expres-
sions
E[a] D Ðp
s
C 1 p
s
Ð n
a0 D p
s
Ð e
C 1 p
s
Ð e
nÐ
a1 D p
s
Ð Ð e
C 1 p
s
Ð n Ð Ð e
nÐ
which we can substitute into the general forms for pk and Qk from the
previous section. Note that n does not have to be integer-valued.
It is not necessary to limit the packet sizes to two distinct values,
though. The above process can be generalized further to the case of the
general service-time distribution, hence providing an excess-rate solution
for the M/G/1 queueing system.
E[a] D Ð
1
iD1
gi D
a0 D
1
iD1
gi Ðe
iÐ
a1 D
1
iD1
gi Ði Ð Ð e
iÐ
where
gk D Prfapacketrequiresk time units to be servedg
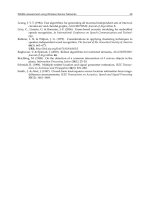
But for now, let’s keep to the bi-modal case and look at some results
(in Figure 14.10) for different lengths and proportions of short and long
packets. We fix the short packet length to 40 octets, the mean packet
250 BASIC PACKET QUEUEING
010203040
Buffer capacity, X
10
−7
10
−6
10
−5
10
−4
10
−3
10
−2
10
−1
10
0
Pr{queue size > X}
Geo/Geo/1
Bi-modal 960
Bi-modal 540
M/D/1
Bi-modal 2340
k:D 0 40
longandshortQ k,,ps, n :D
ps C 1 ps Ðn
Ea
a0 ps Ðe
C 1 ps Ðe
nÐ
a1 ps Ð Ð e
C 1 ps Ð n Ð Ð e
nÐ
decayrate
Ea Ð1 a1 1 C a1 C a0
2
a0 Ð Ea 1 C a0
decayrate
kC1
x
k
:D k
y1 :D GAPPMD1Q x, 0.8
y2 :D longandshortQ x, 0.8, 0.08, 13.5
y3 :D longandshortQ x, 0.8, 0.5, 24
y4 :D longandshortQ x, 0.8, 0.8, 58.5
y5 :D packetQ x
Figure 14.10. Probability that the Queue Exceeds X for Different Service Distribu-
tions (Geometric, Deterministic and Bi-modal)
BALANCE EQUATIONS FOR PACKET BUFFERING: EXCESS-RATE QUEUEING ANALYSIS 251
length to 500 octets and the load to 0.8 packets arriving per mean service
time. We set the time unit to be the time to serve a short packet, so
s D
500
40
D p
s
Ð 1 C1 p
s
Ð n
Figure 14.10 shows results for three different lengths for the long packets:
2340, 960, and 540 octets. These give values of n D 58.5, 24 and 13.5
with corresponding values of p
s
D 0.8, 0.5 and 0.08 respectively. Also
in the figure are the results for the M/D/1 with the same load of 0.8,
and the Geo/Geo/1 results from Figure 14.1 (a load of 0.8 and mean
packet-size of 500 octets). Note that the M/D/1 gives a lower bound on
the probabilities, but the Geo/Geo/1 is not the worst case. Introducing
a small proportion of short packets, and hence slightly increasing the
length of the long packets (to maintain an average of 500 octets) results
in a decay rate only a little higher than the M/D/1. When there are equal
proportions of short and long packets, the decay rate approaches that for
the Geo/Geo/1. However, when most of the packets are short, and only
20% are (very) long packets, the decay rate is rather worse than that for
the Geo/Geo/1 queue.
15
Resource Reservation
go with the flow
QUALITY OF SERVICE AND TRAFFIC AGGREGATION
In recent years there have been many different proposals (such as Inte-
grated Services [15.1], Differentiated Services [15.2], and RSVP [15.3]) for
adding quality of service (QoS) support to the current best-effort mode of
operation in IP networks. In order to provide guaranteed QoS, a network
must be able to anticipate traffic demands, assess its ability to supply the
necessary resources, and act either to accept or reject these demands for
service. This means that users must state their communications require-
ments in advance, in some sort of service request mechanism. The details
of the various proposals are outside the scope of this book, but in
this chapter we analyse the key queueing behaviours and performance
characteristics underlying the resource assessment.
To be able to predict the impact of new demands on resources, the
network needs to record state information. Connection-orientated tech-
nologies such as ATM record per-connection information in the network
as ‘hard’ state. This information must be explicitly created for the duration
of the connection, and removed when no longer needed. An alternative
approach (adopted in RSVP) is ‘soft’ state, where per-flow information is
valid for a pre-defined time interval, after which it needs to be ‘refreshed’
or, if not, it lapses.
Both approaches, though, face the challenge of scalability. Per-flow
or per-connection behaviour relates to individual customer needs. With
millions of customers, each one initiating many connections or flows,
it is important that the network can handle these efficiently, whilst still
providing guaranteed QoS. This is where traffic aggregation comes in.
ATM technology introduces the concept of the virtual path – a bundle of
virtual channels whose cells are forwarded on the basis of their VPI value
Introduction to IP and ATM Design Performance: With Applications Analysis Software,
Second Edition. J M Pitts, J A Schormans
Copyright © 2000 John Wiley & Sons Ltd
ISBNs: 0-471-49187-X (Hardback); 0-470-84166-4 (Electronic)