Báo cáo y học: "Heterogeneity of psychophysiological stress responses in fibromyalgia syndrome patients" pps
Bạn đang xem bản rút gọn của tài liệu. Xem và tải ngay bản đầy đủ của tài liệu tại đây (190.83 KB, 10 trang )
Open Access
Available online />Page 1 of 10
(page number not for citation purposes)
Vol 8 No 1
Research article
Heterogeneity of psychophysiological stress responses in
fibromyalgia syndrome patients
Kati Thieme
1,2
and Dennis C Turk
2
1
Department of Neuropsychology at the University of Heidelberg, Central Institute of Mental Health, J5, 68169 Mannheim, Germany
2
Department of Anesthesiology at the University of Washington, NE Pacific Street, Seattle, WA 98195-6540, USA
Corresponding author: Kati Thieme,
Received: 22 Apr 2005 Revisions requested: 24 May 2005 Revisions received: 19 Oct 2005 Accepted: 4 Nov 2005 Published: 30 Nov 2005
Arthritis Research & Therapy 2006, 8:R9 (doi:10.1186/ar1863)
This article is online at: />© 2005 Thieme and Turk; licensee BioMed Central Ltd.
This is an open access article distributed under the terms of the Creative Commons Attribution License ( />),
which permits unrestricted use, distribution, and reproduction in any medium, provided the original work is properly cited.
Abstract
Dysregulated psychophysiological responses have been
observed in patients with fibromyalgia syndrome (FMS),
although the results are inconsistent. Surface
electromyographic (EMG), systolic and diastolic blood
pressure, heart rate (HR), and skin conductance levels (SCLs)
were continuously recorded at baseline, and during a series of
stress and relaxation tasks in 90 FMS patients and 30 age and
sex matched healthy controls (HCs). The patient sample
demonstrated lower baseline EMG levels compared to the HCs
on all tasks. In contrast, the patients displayed elevated HR and
SCL (sympathetic vasomotor and sudomotor indices,
respectively) during both stress tasks. A cluster analysis
identified four psychophysiological response patterns: 63.3% of
HCs showed increased muscle tension and stable
cardiovascular responses; 34.8% of FMS patients showed a
pattern of increased sympathetic vasomotor reactivity with
stable sudomotor and reduced muscular response; 12.2% of
FMS patients showed a pattern of increased sympathetic
sudomotor reactivity connected with increased sympathetic
vasomotor response and reduced muscular response; and, in
contrast, 46.7% of FMS patients showed a pattern of
parasympathetic vasomotor reactivity and reduced sudomotor
as well as muscular response. The identification of low baseline
muscle tension in FMS is discrepant with other chronic pain
syndromes and suggests that unique psychophysiological
features may be associated with FMS. The different
psychophysiological response patterns within the patient
sample support the heterogeneity of FMS.
Introduction
Fibromyalgia syndrome (FMS) is defined as widespread pain
combined with tenderness at 11 or more of 18 specific 'tender
points' [1]. There is no consensus regarding the mechanisms
underlying the set of symptoms reported by FMS sufferers.
Additionally, several studies suggest heterogeneity in the diag-
nosis of FMS. For example, subgroup differences in biological
variables such as positive antinuclear antibodies connected
with features of connective tissue disease, interleukin 1β,
interleukin-6, and tumor necrosis factor-alpha in skin (for exam-
ple, see [2-4]), depression and cytokine abnormalities (for
example, see [5,6]), and responses to pharmacological inter-
ventions (for example, see [7,8]) have been reported. Sub-
groups based on psychosocial responses have also been
demonstrated [9]. Although abnormal responses to stress
have been suggested to occur through a pathophysiological
mechanism [10], research examining the influence of stress in
FMS has yielded inconsistent results.
The majority of published studies evaluated the responses of
the autonomic nervous system to physical stressful situations.
This approach was used to test stress-reactivity as a potential
cause of the maintenance of FMS symptoms. Several studies
reported increased skin conductance levels (SCLs) [11],
decreased heart rate (HR) variability [12], blood pressure
(BP), and skin temperature [11] in response to physical stres-
sors. These studies suggest an association between FMS and
neurally mediated hypotension [13].
Although several studies that investigated surface electromyo-
graphic (EMG) activity failed to find differences between FMS
patients and healthy controls (HCs) [14,15], others reported
BL = baseline phase; BP = blood pressure; DBP = diastolic blood pressure; EMG = electromyographic activity; FMS = fibromyalgia syndrome; HC
= healthy control; HR = heart rate; MA = mental arithmetic phase; REL = relaxation phase phase; SBP = systolic blood pressure; SC = social conflict
phase; SCL = skin conductance level.
Arthritis Research & Therapy Vol 8 No 1 Thieme and Turk
Page 2 of 10
(page number not for citation purposes)
lower than average muscle tension levels in FMS patients in
contrast to HCs during isometric exercises (for example, see
[16,17]), following injection of hypertonic saline, or in antago-
nistic muscles [18,19]. Our own study used psychological
stressors (for example, mental and social stress), and meas-
ured a complex physiological pattern consisting of EMG lev-
els, BP, HR and SCLs. FMS patients displayed reduced
muscle tension and increased heart rate. In contrast, HCs
showed a modest HR response to stress. Furthermore, as a
group the FMS patients demonstrated significant variability in
stress reactivity and thus do not appear to be a homogeneous
group when it comes to stress reactivity [20,21].
These results support the suggestion of autonomic response
specificity [22,23] as an explanation for the different response
patterns observed in FMS. Furthermore, the results suggest
that patients who have the same diagnosis may have different
psychophysiological response patterns.
The primary aim of the present study was to identify psycho-
physiological characteristics of FMS patients by examining
BP, HR, SCLs, and surface EMG levels during baseline (BL)
and stress conditions [23]. Based on the assumption of heter-
ogeneity (for example, see [3,5,8,9]) and the studies by Qiao
and colleagues. [11], Graven-Nielson and colleagues. [18],
Sorensen and colleagues. [19], and Sprott and colleagues.
[24], and our own study [20], we predicted enhanced auto-
nomic system (for example, SCL, HR, and BP) responses, and
lowered muscle tension (for example, EMG levels) and differ-
ent psychophysiological response patterns within the FMS
sample.
Materials and methods
Participants
Ninety female FMS patients recruited from a pain clinic, rheu-
matology outpatient departments and a hospital and thirty age
and sex-matched HCs recruited from acquaintances of the
investigated patients participated in the study. All patients met
the American College of Rheumatology FMS criteria [1]. The
exclusion criteria consisted of: inflammatory cause of the pain;
neurological complications; pregnancy; concomitant severe
disease; intake of muscle relaxants and opioids; major psychi-
atric disorder; and lack of language fluency. An institutional
review board approved the study, which adhered to the Dec-
laration of Helsinki and informed consent was obtained from all
study participants.
Table 1 contains demographic and diagnostic information
about the FMS patients and HCs. The sex-matched female
HCs and FMS patients were comparable with respect to age
and occupational status despite the fact that 25% of the FMS
patients were receiving workers' compensation (chi(4) = 8.52,
p = 0.074).
Procedure
Clinical assessment
A physician performed an examination that included laboratory
measures (for example, rheumatoid factor, antinuclear antibod-
ies, erythrocyte sedimentation rate), and the evaluation of ten-
der points (manual tender point survey [25]) on all FMS
patients. The manual tender point survey was also performed
on the HCs.
Table 1
Demographic and clinical variables of the fibromyalgia syndrome patients and healthy controls
FMS (n = 90) (mean ± SD (range)) HC (n = 30) (mean ± SD (range))
Age (years) 48.17 ± 10.32 (21–68) 48.22 ± 9.02 (22–65)
Duration of pain (years) 9.28 ± 9.23 (0.5–45)
Painful regions 6.80 ± 2.05 (3–12)
Number of tender points 16.09 ± 3.33 (14–18) 2 ± 0.33 (0–4)
Mean tender points pain severity
a
5.89 ± 2.27 (2–10) 3.13 ± 1.06 (0–3)
Use of antidepressive medications (number) 0.36 ± 0.52 (0–3) 0.21 ± 0.03 (0–2)
Occupational status N (%) N (%)
Working 39 (43.3) 17 (56.8)
Unemployed 20 (22.2) 9 (30.0)
Workers' compensation 24 (26.7) 0 (0.0)
Retired 6 (6.7) 2 (6.6)
Student 1 (1.1) 2 (6.6)
a
Visual analogue scale ranges from 0 = no pain to 10 = most intense pain. FMS, fibromyalgia syndrome; HC, healthy control; SD, standard
deviation.
Available online />Page 3 of 10
(page number not for citation purposes)
Psychophysiological assessment
Patients and HCs were instructed not to consume any analge-
sic or antidepressant medication for one day prior to their
scheduled psychophysiological assessment. A 90 minute psy-
chophysiological protocol was conducted subsequent to the
medical and psychological assessments. The protocol con-
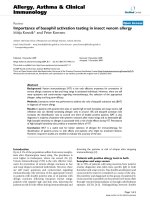
sisted of 7 phases (Figure 1):
1. Adaptation (30 minutes): sitting quietly in a chair with eyes
open.
2. Resting BL (4 minutes): sitting quietly with eyes open and
to move as little as possible.
3. Relaxation (REL1, 4 minutes): pleasant music played
through headphones with eyes closed.
4. Mental arithmetic (MA, 4 minutes): add 10 one-figure num-
bers in the presence of white noise (60 db). On 30% of the
answers the participants were informed that their answer was
'incorrect' independent of their response. An additional white
noise (60 db) stressor was delivered to the participants
through headphones.
5. REL2: as described in 3.
6. Social conflict (SC, 4 minutes): discuss a SC from the list
of unsolvable problems identified during the initial assessment
[26].
7. REL3: as described in 3.
The stressor conditions were presented in a counter-balanced
order to reduce any order effects.
Immediately following each phase, participants were asked to
rate the intensity of their pain and perceived stress on an 11
point scale with the endpoints 'no pain' to 'very intense pain',
and 'not at all stressful' to 'very stressful'.
Psychophysiological recordings
Participants were seated and positioned in a straight back
chair and were instructed to move as little as possible. A video
camera located in the experimental room was activated
throughout the psychophysiology protocol. All instructions
were presented on a video screen.
EMG activity was recorded from the left and right m. trapezius
according to the positioning recommended by Fridlund and
Cacioppo [27]. BP was continuously monitored using an
Ohmeda Finapres BP monitor (Datex-Ohmeda, Louisville, CO,
USA). A MEDAT 6020 B Amplifier (Insight Instruments,
Vienna, Austria) was used to record EMG, SCL, and HR. The
presentation of the instructions, data acquisition, and data
storage were computer-controlled. The sampling frequency of
EMG signals was 3,000 Hz. The raw EMG was amplified by a
factor of 100,000, passed through a bandpass filter (25 to
1,000 Hz), and integrated using contour-following integrators
with a time constant of 70 ms.
BP was measured with a photoplethysmographic device on
the fourth digit of the left hand (the accuracy of this procedure
is ± 2 mmHg ± 0.25 kPa). A computer program that summed
the digitized beat-by-beat waveforms averaged the sample
time synchronized to the R-wave of the electrocardiogram, and
divided them by the number of cardiac cycles. HR was deter-
mined with a multi-miniature transmitter using photoplethys-
mography of HR waveforms positioned on the tip of the fourth
digit of the right hand. HR in beats per minutes was deter-
mined from this calculation [28]. SCL was measured through
two electrodes in a multi-miniature sensor with a surface of
50.3 mm
2
on the second digit of the right hand about a con-
stant current procedure of 4 µA [29,30]. All physiological
measurements were continuously recorded like a 24 h BP
monitoring.
Data analysis
Data analyses were performed in several sequential steps. The
first analyses assessed BL differences between the FMS and
HC groups for the self-report and the psychophysiological var-
iables. The second step examined differences in psychophys-
iological responses by the FMS and HC groups, using
repeated measures analyses of variance (ANOVAs or ANCO-
VAs) depending on baseline differences with all six phases as
within and the two groups as between factors. Significant
ANOVA and ANCOVA effects were followed up by post hoc t
tests in a third step. These post hoc analyses were used to cal-
culate: (1) group differences over all six phases; (2)
Figure 1
The design of the studyThe design of the study.
Arthritis Research & Therapy Vol 8 No 1 Thieme and Turk
Page 4 of 10
(page number not for citation purposes)
differences between the phases across both groups in order
to test the stress induction; and (3) between group differences
in stress reactivity. The stress and the relaxation phases were
compared with the baseline for each group in the case of com-
parable baseline values. When there were baseline
differences between the groups, ANCOVAs were performed.
Significant effects were followed up by post hoc t tests to
compare relaxation with stress phases. Bonferroni corrections
were used to control for the large number of analyses (p <
0.005).
To identify psychophysiological response patterns we per-
formed a z-transformation of all psychophysiological variables
to create a common metric and thereby permit integration of
the data as a fourth step. The z-transformations were per-
formed for the overall sample to permit comparison of FMS
patients and HCs. Finally, in order to examine the heterogene-
ity in physiological responding between and within the FMS
and HC group, we performed a k-means cluster analysis [31].
The cluster analyses with z-transformed physiological varia-
bles permits identification of groups within the sample, the so-
called 'psychophysiological patterns', and allows determina-
tion of the most stress-reactive physiological variable for each
psychophysiological pattern. The cluster analysis used the
means of all z-transformed physiological data collected during
the BL, stress, and relaxation phases. The cluster analysis
reveals an order of different psychophysiological variables
with comparable z-scores. The variable with the highest z-
score in each cluster characterizes the most reactive physio-
logical system. The algebraic sign shows the direction of the
stress response [32].
Results
Pain and stress response
Subjective pain ratings
As the BL pain ratings varied between the groups, an
ANCOVA was performed. The results of this analyses
revealed a significant main effect for groups (F(1,118) =
26.14, p < 0.001), indicating significantly higher pain ratings
in the patient group than the HCs. A significant phase effect
(F(5,114) = 7.79, p < 0.001) revealed that the pain ratings
were higher in the stress than the REL phases (all ps < 0.01).
The significant group × phase interaction (F(5,114) = 6.69, p
< 0.001) indicated significant differences in pain ratings
across phases for all FMS patients and the HCs controlled by
covariate BL pain ratings.
Subjective stress ratings
As the BL values were different between groups (FMS and
HC), an ANCOVA was performed with the BL scores as the
covariate. The results of this analyses revealed that the group
(F(1,118) = 52.27, p < 0.001), phase (F(5,114) = 32.43, p <
0.001), and a group × phase interaction (F(5,114) = 7.56, p
< 0.001) were all statistically significant. FMS patients dis-
played significantly higher stress ratings than the HCs (all ps
< 0.001; Table 2). The stress ratings were significantly higher
in the stress compared to the REL phases (all ps < 0.001)
controlled by covariate BL stress ratings.
Table 2
Comparison of self-reported pain and stress between fibromyalgia syndrome patients and healthy controls
Phase FMS (N = 90) HC (N = 30) p value
Mean SD Mean SD
Pain
Baseline 4.70 (2.30) 0.00 (0.00) <0.001
Relax 1 4.75 (2.14) 0.00 (0.00) <0.001
Arithmetic 5.60 (2.19) 0.07 (0.25) <0.001
Relax 2 5.33 (1.70) 0.00 (0.00) <0.001
Conflict 5.63 (2.03) 0.34 (0.71) <0.001
Relax 3 5.40 (1.79) 0.23 (0.50) <0.001
Stress
Baseline 2.65 (0.92) 1.17 (0.79) <0.001
Relax 1 2.22 (0.85) 0.17 (0.38) <0.001
Arithmetic 4.70 (2.01) 2.37 (0.72) <0.001
Relax 2 3.10 (1.10) 0.10 (0.31) <0.001
Conflict 5.60 (1.88) 3.33 (1.03) <0.001
Relax 3 3.04 (0.98) 0.57 (0.68) <0.001
FMS, fibromyalgia syndrome; HC, healthy controls; SD, standard deviation.
Available online />Page 5 of 10
(page number not for citation purposes)
Table 3
Differences in physiological variables between fibromyalgia syndrome patients and healthy controls
Phase FMS (N = 90) HC (N = 30) p value
Mean SD Mean SD
EMG
Baseline 8.97 (4.75) 14.52 (5.12) <0.001
Relax 1 8.77 (4.83) 15.83 (5.23) <0.001
Mental arithmetic 10.44 (5.89) 17.10 (9.07) <0.001
Relax 2 8.91 (4.91) 17.60 (9.44) <0.001
Social conflict 9.59 (5.59) 17.04 (8.92) <0.001
Relax 3 9.63 (6.33) 18.50 (10.51) <0.001
SCL
Baseline 1.81 (1.70) 1.65 (0.64) ns
Relax 1 1.89 (1.78) 1.59 (0.62) ns
Mental arithmetic 2.81 (2.65) 1.92 (0.74) <0.005
Relax 2 2.31 (2.01) 1.76 (0.69) ns
Social conflict 2.76 (2.11) 1.79 (0.72) <0.005
Relax 3 2.41 (2.15) 1.69 (0.71) ns
HR
Baseline 77.07 (11.22) 68.56 (22.49) ns
Relax 1 75.45 (10.54) 65.68 (21.11) <0.005
Mental arithmetic 78.32 (13.64) 75.85 (24.72) ns
Relax 2 73.36 (10.86) 66.47 (19.55) ns
Social conflict 77.88 (10.64) 66.85 (20.88) ns
Relax 3 73.96 (9.59) 62.79 (18.11) <0.005
SBP
Baseline 133.5 (19.03) 132.9 (13.40) ns
Relax 1 131.4 (16.65) 130.4 (11.58) ns
Mental arithmetic 141.7 (19.52) 140.8 (14.35) ns
Relax 2 128.1 (13.20) 124.9 (21.00) ns
Social conflict 146.5 (15.09) 139.7 (18.29) ns
Relax 3 135.6 (14.31) 131.9 (23.38) ns
DBP
Baseline 78.43 (13.89) 77.10 (8.83) ns
Relax 1 76.23 (8.27) 76.24 (7.79) ns
Mental arithmetic 81.11 (10.80) 82.51 (10.83) ns
Relax 2 76.82 (14.54) 73.37 (7.61) ns
Social conflict 85.81 (9.33) 83.74 (10.29) ns
Relax 3 77.57 (7.75) 78.04 (9.60) ns
DBP, diastolic blood pressure; EMG, electromyographic activity; FMS, fibromyalgia syndrome; HC, healthy controls; HR, heart rate; ns, not
significant; SBP, systolic blood pressure; SCL, skin conductance level.
Arthritis Research & Therapy Vol 8 No 1 Thieme and Turk
Page 6 of 10
(page number not for citation purposes)
Psychophysiological data
Electromyographic changes
There were no significant differences between the left and
right trapezius across any of the phases, thus combined
means are reported. As the between group BL values were
significantly different, an ANCOVA was performed. The group
main effect (F(1,118) = 10.29, p < 0.005) was significant.
FMS patients displayed significantly lower trapezius EMG
activity than the HCs (p < 0.001). There were no statistically
significant differences in EMG between BL, stress, and REL
phases for either group when BL EMG was used as a covari-
ate (Table 3).
Skin conductance level
A statistically significant phase effect (F(5,114) = 7.49, p <
0.001) indicated higher SCLs in the stress than the REL
phases (all ps < 0.001). The significant group × phase inter-
action (F(5,114) = 3.84, p < 0.005) indicated that the FMS
patients showed a significant increase from BL to REL1, and
a significant increase from BL to MA and SC phases, in con-
trast to HC with no significant changes (Table 3).
Heart rate
HR showed a statistically significant group main effect
(F(3,116) = 14.94, p < 0.001), indicating higher HR in FMS
patients compared to the HCs (p < 0.001). The significant
phase effect (F(5,114) = 15.08, p < 0.001) showed that HR
increased in stress and decreased in REL phases across all
FMS subgroups and the HCs (p < 0.001) (Table 3).
Blood pressure
A statistically significant phase effect (systolic blood pressure
(SBP), F(5,114) = 30.92, p < 0.001; diastolic blood pressure
(DBP), F(5,114) = 41.95, p < 0.001) indicated that SBP and
DBP increased in stress and decreased in REL phases across
the groups (p < 0.001). In contrast to SBP, DBP showed a
statistically significant group × phase interaction (F(5,115) =
4.16, p < 0.005). The level of DBP in FMS patients decreased
from BL to REL1 (p < 0.001), and increased from BL to MA
and SC (all, ps < 0.001). The level of DBP increased in HCs
from BL to MA and SC (all, ps < 0.005) (Table 3).
Psychophysiological patterns
Characteristics of psychophysiological response patterns
The k-means cluster analysis (Table 4) yielded four clusters.
The means of SBP (p < 0.001), DBP (p < 0.001), HR (p <
0.01), SCL (p < 0.001), and EMG (p < 0.001) were signifi-
cantly different between the psychophysiological patterns
(Table 4). The largest psychophysiological subgroup (n = 48)
was characterized by a low autonomic and muscular response
pattern with reduced SBP, DBP and HR and by very low SCLs
and EMG levels. The low BP was the most reactive physiolog-
ical system of the largest psychophysiological response pat-
tern (for example, hypotensive reactivity). The second
subgroup (n = 39) showed a high cardiovascular response
pattern with elevated DBP, SBP, and HR, a moderate SCL
response, and reduced EMG levels. The high BP was the most
reactive physiological system. Elevated EMG levels and aver-
age responses in all other physiological data characterized the
third subgroup (n = 22) with an enhanced muscular reactivity.
The fourth pattern (n = 11) was characterized by a high auto-
nomic and low muscular response pattern with high SCLs,
increased cardiovascular variables and reduced EMG levels.
The smallest pattern was characterized by SCL reactivity. The
low autonomic and muscular stress response pattern with
hypotensive BP reactivity was shown by 46.7% of FMS
patients. The high cardiovascular response pattern with
enhanced BP reactivity was shown by 37.8%, and the high
SCL pattern with SCL reactivity by 12.2% of FMS patients.
The high muscular response pattern with enhanced muscle
reactivity was shown by 63.3% of HCs in contrast to only
3.3% of FMS patients (Table 5).
Associations between psychophysiological response
and self-reported measures
An ANOVA showed significant differences between the psy-
chophysiological response patterns in pain (all F(3,117) =
7.46–12.31, p < 0.001) and stress ratings (F(3,117) = 4.06–
13.25, p < 0.01) for all phases, as well as in the duration of
Table 4
Z-scores of the four psychophysiological response patterns
Variable Physiological response pattern F p value
1234
Z-DBP-M -0.69 0.70 0.18 0.48 31.044 <0.001
Z-SBP-M -0.71 0.65 0.14 0.57 38.079 <0.001
Z-HR-M -0.02 0.45 -0.04 0.21 4.612 0.005
Z-SCL-M -0.43 -0.10 -0.18 2.71 131.298 <0.001
Z-EMG-M -0.22 -0.35 1.34 -0.40 43.799 <0.001
Bold text indicates the highest values of each group. DBP, diastolic blood pressure; EMG, electromyographic activity; HR, heart rate; SBP,
systolic blood pressure; SCL, skin conductance level.
Available online />Page 7 of 10
(page number not for citation purposes)
pain (F(3,117) = 3.38, p < 0.05), although the latter two did
not reach the Bonferroni-adjusted levels of statistical
significance.
The high muscle response pattern showed significantly lower
pain (p < 0.001), and the shortest duration of pain (p < 0.005)
in contrast to the other psychophysiological response patterns
(Table 6). There were no significant differences in pain and
stress ratings between the other psychophysiological
response patterns.
Discussion
The results of this study demonstrate different physiological
stress responses within FMS patients and between FMS
patients and HC. The significant increase of BP, HR, and
SCLs in the stress compared to the BL phase and the reduc-
tion in the REL phases indicates that stress and relaxation
were induced, confirming the ecological validity of the stres-
sors (compare to [33]).
Consistent with other studies [18,34], in the FMS patients,
muscle tension at the BL and the experimental phases were
significantly lower compared to the HCs. Moreover, although
the FMS patients rated the SC and MA tasks as stressful, their
muscle tension levels did not display elevations comparable to
the HCs. It appears that neither mental stress nor pain inten-
sity influence muscle tension in FMS patients.
Studies with P magnetic resonance imaging have reliably iden-
tified several abnormalities in the muscles of patients with
FMS, including low levels of phosphocreatine and ATP at rest,
low phosphorylation potential and total oxidative capacity, and
a reduced number and size of mitochondria [23,35]. Addition-
ally, the slower degradation of acetylcholine [36], which is
involved in the production of corticosteroids and growth hor-
mones [10,36], is an important regulator of muscle remodeling
and performance [37]. Taken together, the results of the
present study and other physiological studies [16-19,32] sug-
gest that FMS is characterized by decreased muscle activity
connected with an inability to respond adaptively to stress and
relaxation. The reason for the decreased muscle activity in
FMS does not appear to be only the result of physical decon-
ditioning; ultrastructural changes in the muscle also appear to
be involved [23,31]. Further investigations are needed to
examine the interactions between muscle and the endocrine
[37] and central nervous systems [38].
The four psychophysiological stress response patterns identi-
fied differentiated among the FMS sample and the HCs. The
HCs were included to examine the diagnosis specificity of
each of the FMS patterns. If the HCs had not been included in
the analyses, it would not have been possible to interpret the
three psychophysiological FMS patterns as we would not have
known whether any of these three clusters reflected a normal
stress reaction. The inclusion of the HCs permitted us to dem-
onstrate that the FMS patterns were all completely different
when compared to the response pattern showed by the HCs.
These differences are important because autonomic variables
may be involved in the development and maintenance of
chronic disease [21,22]. Flor and colleagues [39] found
increased muscle reactivity in back pain patients following a
psychological stress induction. Johannes and colleagues [32]
found greater BP reactivity in patients with hypertension com-
pared to HCs. The largest percentage of the FMS sample
(46.7%) in the present study showed hypotensive reactivity
within a stress response pattern that is characterized by
decreased cardiovascular, SCL, and EMG values. The signifi-
cantly lower BP suggests that the influence of parasympa-
thetic reactivity may be extended during stress situations.
Based on the the endocrine influence on the autonomic nerv-
ous system [40-42] and the central sensitization of FMS [43],
a parasympathetic response pattern seems to be connected
with the enhanced adrenocorticotrophic hormone production
described in FMS (for example, see [10,36]).
Table 5
Psychophysiological response patterns in fibromyalgia syndrome patients and healthy controls
Group PRP
1
HC (N = 30) FMS (N = 90) Total
N%N%N%
1Low BP 620.04246.7 48 40.0
2High BP516.73437.8 39 32.5
3High EMG1963.3 33.32218.3
4High SCL00.01112.2119.2
Total 30 100.0 90 100.0 120 100.0
Bold text indicates the highest values of each group.
1
Psychophysiological response patterns: Low BP: low systolic blood pressure (SBP),
diastolic blood pressure (DBP), heart rate (HR), skin conductance level (SCL) and electromyographic activity (EMG); High BP: enhanced SBP,
DBP, HR as well as moderate SCL and low EMG; High EMG: enhanced EMG as well as stable physiological response; High SCL: enhanced
SCL as well as enhanced BP, moderate HR and reduced EMG. HC, healthy control; FMS, fibromyalgia syndrome.
Arthritis Research & Therapy Vol 8 No 1 Thieme and Turk
Page 8 of 10
(page number not for citation purposes)
The second largest response pattern (37.8%) of FMS patients
was exemplified by increased BP reactivity. Increased cardio-
vascular stress responses and decreased SCLs and EMG lev-
els also characterized this response pattern. The increased
cardiac response suggests a tendency for higher peripheral
sympathetic tones under stress. This psychophysiological
response pattern replicates the results reported by Martinez-
Lavin [44], who discussed FMS as a sympathetically main-
tained pain syndrome. Increased DBP appears to be con-
nected to pain intensity (r = 0.32, p < 0.05). It is comparable
to the stress response observed in rheumatoid arthritis
patients who also showed enhanced BP reactivity [32]. Addi-
tional studies are necessary to confirm these results and to
determine the mechanisms underlying these patterns.
The third largest response pattern of FMS (12.2%) was char-
acterized by elevated SCL reactivity as sympathetic sudomo-
tor reactivity and increased cardiovascular response as
sympathetic vasomotor response as well as the FMS specific
reduction in muscle tension. Patients with acute musculoskel-
etal injury also showed elevated sympathetic vaso- and sudo-
motor responses [45]. These sympathetic response patterns
suggest that there is an interaction between cutaneous and
vasomotor sympathetic neurons in response to acute muscu-
loskeletal injury or to chronic pain. This is reflected by
increased afferent input from sensitized nociceptors and other
sensory neurons, resulting in alterations in autonomic function
[45].
Johannes and colleagues [32] also found sympathetic and
parasympathetic response patterns in the comparison of
patients with hypertension, rheumatoid arthritis, and systemic
lupus erythematosus. As the sympathetic and parasympa-
thetic response patterns are present in FMS as well, it may be
that these response patterns are relatively independent of the
specific disease entity.
Moreover, the patients were medication-free only one day
before the study. It is known that antidepressant medication
affects autonomic nervous system activity. However, a com-
parison of the physiological stress responses of the sub-
groups of patients with (n = 20) and without (n = 60)
antidepressant medication did not yield significant effects
(parasympathetic DBP, t(46) = 0.08, p = 0.94); sympathetic
stress response t(37) = 1.15, p = 0.26). Antidepressant use
was not associated with altered stress response. Further, the
physiological response did not show significant differences
between patients with and without antidepressant use.
Table 6
Self-reported pain and stress during the experiment and significant differences between psychophysiological response patterns
Phase Low BP (N = 48) High BP (N = 39) High EMG (N = 22) High SCL (N = 11) Significant difference
Mean SD Mean SD Mean SD Mean SD F p
Pain
Baseline 3.36 (2.46) 3.73 (2.53) 1.00 (2.05) 5.17 (3.19) 7.46 <0.001
Relax 1 3.18 (2.45) 3.39 (2.32) 0.92 (1.90) 5.06 (3.06) 7.52 <0.001
Arithmetic 4.02 (2.86) 4.61 (2.56) 0.95 (1.93) 6.11 (3.06) 11.02 <0.001
Relax 2 3.64 (2.50) 4.26 (2.48) 0.95 (2.04) 5.50 (2.84) 10.12 <0.001
Conflict 3.88 (2.51) 4.69 (2.67) 0.92 (2.02) 6.06 (3.00) 12.12 <0.001
Relax 3 4.15 (2.56) 4.43 (2.31) 1.00 (2.00) 6.17 (3.10) 12.30 <0.001
Stress
Baseline 2.40 (1.18) 2.31 (0.95) 1.58 (0.96) 3.11 (1.96) 4.06 0.009
Relax 1 1.79 (0.99) 2.00 (1.13) 0.47 (0.84) 3.11 (1.96) 13.25 <0.001
Arithmetic 4.40 (2.32) 4.84 (1.84) 3.00 (1.20) 5.94 (2.21) 5.52 0.001
Relax 2 2.57 (1.55) 2.69 (1.37) 0.53 (1.07) 3.44 (1.88) 12.81 <0.001
Conflict 5.25 (1.94) 6.08 (2.09) 3.84 (1.77) 6.56 (2.24) 6.41 0.001
Relax 3 2.83 (1.53) 2.62 (1.23) 1.00 (1.11) 3.33 (2.23) 8.75 <0.001
Duration of pain 8.35 (10.61) 7.16 (6.80) 1.33 (3.24) 5.33 (2.54) 3.38 0.022
BP, blood pressure; EMG, electromyographic activity FMS, fibromyalgia syndrome; HC, healthy controls; SCL, skin conductance level; SD,
standard deviation.
Available online />Page 9 of 10
(page number not for citation purposes)
Conclusion
The results of this study support the suggestion of heteroge-
neity of the mechanisms involved in FMS. They suggest further
that differential treatment strategies matched to different pat-
terns may be appropriate [46,47].
Although the overall sample size for the patient group appears
reasonable, subdividing the total sample into four
psychophysiological patterns produced relatively small
groups. Thus, the interpretation of the results of the cluster
analysis on the subgroups must be treated with caution.
Research with larger samples is needed to replicate auto-
nomic response specificity observed in the different psycho-
social subgroups. Moreover, studies are needed to compare
the psychophysiological reactivity in FMS with other chronic
pain conditions to determine if the patterns observed are
unique to FMS or are characteristic of chronic pain. Further,
future research is needed to test endocrine predictors of
stress reactivity in FMS to determine if the endocrine reaction
is the cause or the consequence of FMS.
Competing interests
The authors declare that they have no competing interests.
Authors' contributions
KT: recruitment of the patients, organization and realization of
the experimental design, statistical analyses, preparation of
the manuscript. DCT: statistical analyses, preparation of the
manuscript.
Acknowledgements
The author's work on psychophysiological response patterns in FMS
has been supported by grants from the Deutsche Forschungsgemein-
schaft to KT (Th 899-1/2 and 899-2/2), and grants from the National
Institute of Arthritis and Musculoskeletal and Skin Diseases (AR44724
and AR 47298) to DCT.
References
1. Wolfe F, Smythe HA, Yunus MB, Benett RM, Bombardier C, Gold-
enberg DL, Tugwell P, Campbell SM, Abeles M, Clark P, et al.: The
American College of Rheumatology 1990 Criteria for the clas-
sification of Fibromyalgia. Report of the Multicenter Criteria
Committee. Arthritis Rheum 1990, 33:160-172.
2. Al-Allaf AW, Ottewell L, Pullar T: The prevalence and signifi-
cance of positive antinuclear antibodies in patients with fibro-
myalgia syndrome: 2–4 years' follow-up. Clin Rheumatol 2002,
21:472-477.
3. Russell AS: Effect of gamma-hydroxybutyrate on pain, fatigue,
and alpha sleep anomaly in patients with fibromyalgia. J
Rheumatol 1999, 26:2712.
4. Salemi S, Rethage J, Wollina U, Michel BA, Gay RE, Gay S, Sprott
H: Detection of interleukin 1beta (IL-1beta), IL-6, and tumor
necrosis factor-alpha in skin of patients with fibromyalgia. J
Rheumatol 2003, 30:146-150.
5. Gur A, Karakoc M, Nas K, Remzi FH, Cevik C, Denli A, Sarac J:
Cytokines and depression in cases with fibromyalgia. J
Rheumatol 2002, 29:358-361.
6. Wallace DJ, Linker-Israeli M, Hallegua D, Silverman S, Silver D,
Weisman MH: Cytokines play an aetiopathogenetic role in
fibromyalgia: a hypothesis and pilot study. Rheumatology
(Oxford) 2001, 40:743-749.
7. Rossy LA, Buckelew SP, Dorr N, Hagglund KJ, Thayer JF, McIn-
tosh MJ, Hewett JE, Johnson JC: A meta-analysis of fibromyalgia
treatment interventions. Ann Behav Med 1999, 21:180-191.
8. Wolfe F, Zhao S, Lane N: Preference for nonsteroidal antiin-
flammatory drugs over acetaminophen by rheumatic disease
patients: a survey of 1,799 patients with osteoarthritis, rheu-
matoid arthritis and fibromyalgia. Arthritis Rheum 2000,
43:378-385.
9. Turk DC, Okifuji A, Sinclair JD, Starz TW: Pain, disability, and
physical functioning of patients with fibromyalgia. J Rheumatol
1996, 23:1255-1262.
10. Crofford LJ, Young EA, Engleberg NC, Korszun A, Brucksch CB,
McClure LA, Brown MB, Demitrack MA: Basal circadian and pul-
satile ACTH and cortisol secretion in patients with fibromyal-
gia and/or chronic fatigue syndrome. Brain Behav Immun
2004, 18:314-325.
11. Qiao ZG, Vaeroy H, Morkrid L: Electrodermal and microcircula-
tory activity in patients with fibromyalgia during baseline,
acustic stimulation and cold pressor tests. J Rheumatol 1991,
18:1383-1389.
12. Martinez-Lavin M, Hermosillo AG, Rosas M, Soto ME: Circadian
studies of autonomic nervous balance in patients with fibro-
myalgia: a heart rate variability analysis. Arthritis Rheum 1998,
41:1966-1971.
13. Bou-Holaigah I, Calkins H, Flynn JA, Tunin C, Chang HC, Kan JS,
Rowe PC: Provocation of hypotension and pain during upright
tilt table testing in adults with fibromyalgia. Clin Exp
Rheumatol 1997, 15:239-246.
14. Elert JE, Rantapaa-Dahlqvist SB, Henriksson-Larsen K, Lorentzon
R, Gerdle BU: Muscle performance, electromyography and
fibre type composition in fibromyalgia and work-related
myalgia. Scand J Rheumatol 1992, 21:28-34.
15. Svebak S, Anjia R, Karstad SI: Task-induced electromyographic
activation in fibromyalgia subjects and controls. Scand J
Rheumatol 1993, 22:124-130.
16. Elam M, Johansson G, Wallin BG: Do patients with primary
fibromyalgia have an altered muscle sympathetic nerve
activity? Pain 1992, 48:371-375.
17. Vestergaard-Poulsen P, Thomsen C, Norregaard J, Bulow P, Sink-
jaer T, Henriksen O: 31P NMR spectroscopy and electromyog-
raphy during exercise and recovery in patients with
fibromyalgia. J Rheumatol 1995, 22:1544-1551.
18. Graven-Nielsen T, Svensson P, Arendt-Nielsen L: Effects of
experimental muscle pain on muscle activity and co-ordina-
tion during static and dynamic motor function. Electroencepha-
logr Clin Neurophysiol 1997, 105:156-164.
19. Sorensen J, Graven-Nielson T, Henriksson KG, Bengtsson M,
Arendt-Nielson L: Hyperexcitability in fibromyalgia. J Rheumatol
1998, 25:152-155.
20. Thieme K, Rose U, Pinkpank T, Spies C, Flor H, Turk DC: Psycho-
physiological Responses in Patients with Fibromyalgia
Syndrome. Psychother Psychosom in press.
21. Turk DC, Flor H: Primary fibromyalgia is greater than tender
points: toward a multiaxial taxonomy. J Rheumatol Suppl 1989,
19:80-86.
22. Wenger MA, Clemens TL, Coleman DR, Cullen TD, Engel BT:
Autonomic response specificity. Psychosom Med 1961,
23:185-193.
23. Lacey JI: Individual differences in somatic response patterns. J
Comp Physiol Psychol 1950, 43:338-350.
24. Sprott H, Salemi S, Gay RE, Bradley LA, Alarcon GS, Oh SJ,
Michel BA, Gay S: Increased DNA fragmentation and
ultrastructural changes in fibromyalgic muscle fibres. Ann
Rheum Dis 2004, 63:245-251.
25. Okifuji A, Turk DC, Sinclair JD, Starz TW, Marcus DA: A standard-
ized manual tender point survey. I. Development and determi-
nation of a threshold point for the identification of positive
tender points in fibromyalgia syndrome. J Rheumatol 1997,
24:377-383.
26. Hahlweg K: Fragebogen zur Partnerschaftsdiagnostik [Ques-
tionnaire for the assessment of spousal relationships]. Göttin-
gen: Hogrefe; 1996.
27. Fridlund AJ, Cacioppo JT: Guidelines for human electromyo-
graphic research. Psychophysiology 1986, 23:567-589.
28. Jennings JR, Berg WK, Hutcheson JS, Obrist P, Porges S, Turpin
G: Committee report. Publication guidelines for heart rate
studies in man. Psychophysiology 1981, 18:226-231.
Arthritis Research & Therapy Vol 8 No 1 Thieme and Turk
Page 10 of 10
(page number not for citation purposes)
29. Boucsein W: Elektrodermale Aktivitaet [Electrodermal
activity]. Berlin, Heidelberg, New York: Springer; 1988.
30. Fowles DC, Christie MJ, Edelberg R, Grings WW, Lykken DT, Ven-
ables PH: Committee report. Publication recommendations for
electrodermal measurements. Psychophysiology 1981,
18:232-239.
31. Everitt B: Cluster analysis is a generic term for a wide range of
numerical methods for examining data. Stat Methods Med Res
2004, 13:343-345.
32. Johannes B, Salnitski VP, Thieme K, Kirsch KA: Differences in the
autonomic reactivity pattern to psychological load in patients
with hypertension and rheumatic diseases. Aviakosm Ekolog
Med 2003, 37:28-42.
33. Flor H, Turk DC: Psychophysiology of chronic pain: do chronic
pain patients exhibit symptom-specific psychophysiological
responses? Psychol Bull 1989, 105:215-259.
34. Bansevicius D, Westgaard RH, Stiles T: EMG activity and pain
development in fibromyalgia patients exposed to mental
stress of long duration. Scand J Rheumatol 2001, 30:92-98.
35. Jubrias SA, Bennett RM, Klug GA: Increased incidence of a res-
onance in the phosphodiester region of 31P nuclear magnetic
resonance spectra in the skeletal muscle of fibromyalgia
patients. Arthritis Rheum 1994, 37:801-807.
36. Neeck G: Neuroendocrine and hormonal perturbations and
relations to the serotonergic system in fibromyalgia patients.
Scand J Rheumatol Suppl 2000, 113:8-12.
37. Sheffield-Moore M, Urban RJ: An overview of the endocrinology
of skeletal muscle. Trends Endocrinol Metab 2004, 15:110-115.
38. Zidar J, Backman E, Bengtsson A, Henriksson KG: Quantitative
EMG and muscle tension in painful muscles in fibromyalgia.
Pain 1990, 40:249-254.
39. Flor H, Birbaumer N, Schugens MM, Lutzenberger W: Symptom-
specific psychophysiological responses in chronic pain
patients. Psychophysiology 1992, 29:452-460.
40. Schommer NC, Hellhammer DH, Kirschbaum C: Dissociation
between reactivity of the hypothalamus-pituitary-adrenal axis
and the sympathetic-adrenal-medullary system to repeated
psychosocial stress. Psychosom Med 2003, 65:450-460.
41. Ayala AR, Pushkas J, Higley JD, Ronsaville D, Gold PW, Chrousos
GP, Pacak K, Calis KA, Gerald M, Lindell S, et al.: Behavioral,
adrenal, and sympathetic responses to long-term administra-
tion of an oral corticotropin-releasing hormone receptor
antagonist in a primate stress paradigm. J Clin Endocrinol
Metab 2004, 89:5729-5737.
42. Andersson IJ, Barlind A, Nystrom HC, Olsson B, Skott O, Mobini
R, Johansson M, Bergstrom G: Reduced sympathetic respon-
siveness as well as plasma and tissue noradrenaline concen-
tration in growth hormone transgenic mice. Acta Physiol
Scand 2004, 182:369-378.
43. Staud R, Cannon RC, Mauderli AP, Robinson ME, Price DD, Vierck
CJ Jr: Temporal summation of pain from mechanical stimula-
tion of muscle tissue in normal controls and subjects with
fibromyalgia syndrome. Pain 2003, 102:87-95.
44. Martinez-Lavin M: Fibromyalgia as a sympathetically main-
tained pain syndrome. Curr Pain Headache Rep 2004,
8:385-389.
45. Grimm DR, Cunningham BM, Burke JR: Autonomic nervous sys-
tem function among individuals with acute musculoskeletal
injury. J Manipulative Physiol Ther 2005, 28:44-51.
46. Thieme K, Gromnica-Ihle E, Flor H: Operant behavioral treatment
of fibromyalgia: a controlled study. Arthritis Rheum 2003,
49:314-320.
47. Turk DC, Okifuji A, Sinclair JD, Starz TW: Differential responses
by psychosocial subgroups of fibromyalgia syndrome patients
to an interdisciplinary treatment. Arthritis Care Res 1998,
11:397-404.