Báo cáo y học: "dentification of blood biomarkers of rheumatoid arthritis by transcript profiling of peripheral blood mononuclear cells from the rat collagen-induced arthritis model" doc
Bạn đang xem bản rút gọn của tài liệu. Xem và tải ngay bản đầy đủ của tài liệu tại đây (1.35 MB, 14 trang )
Open Access
Available online />Page 1 of 14
(page number not for citation purposes)
Vol 8 No 1
Research article
Identification of blood biomarkers of rheumatoid arthritis by
transcript profiling of peripheral blood mononuclear cells from the
rat collagen-induced arthritis model
Jianyong Shou
1,2
, Christopher M Bull
1
, Li Li
1
, Hui-Rong Qian
3
, Tao Wei
1
, Shuang Luo
1
,
Douglas Perkins
1
, Patricia J Solenberg
1
, Seng-Lai Tan
4
, Xin-Yi Cynthia Chen
4
, Neal W Roehm
5
,
Jeffrey A Wolos
1
and Jude E Onyia
1
1
Integrative Biology, Lilly Research Laboratories, Indianapolis, Indiana, USA
2
Angiogenesis and Tumor Microenvironment Biology, Lilly Research Laboratories, Indianapolis, Indiana, USA
3
Statistics, Lilly Research Laboratories, Indianapolis, Indiana, USA
4
Cancer Inflammation and Cell Survival, Lilly Research Laboratories, Indianapolis, Indiana, USA
5
Platform/CFARS, Lilly Research Laboratories, Indianapolis, Indiana, USA
Corresponding author: Jianyong Shou,
Received: 28 Sep 2005 Revisions requested: 25 Nov 2005 Revisions received: 7 Dec 2005 Accepted: 9 Dec 2005 Published: 10 Jan 2006
Arthritis Research & Therapy 2006, 8:R28 (doi:10.1186/ar1883)
This article is online at: />© 2006 Shou et al.; licensee BioMed Central Ltd.
This is an open access article distributed under the terms of the Creative Commons Attribution License ( />),
which permits unrestricted use, distribution, and reproduction in any medium, provided the original work is properly cited.
Abstract
Rheumatoid arthritis (RA) is a chronic debilitating autoimmune
disease that results in joint destruction and subsequent loss of
function. To better understand its pathogenesis and to facilitate
the search for novel RA therapeutics, we profiled the rat model
of collagen-induced arthritis (CIA) to discover and characterize
blood biomarkers for RA. Peripheral blood mononuclear cells
(PBMCs) were purified using a Ficoll gradient at various time
points after type II collagen immunization for RNA preparation.
Total RNA was processed for a microarray analysis using
Affymetrix GeneChip technology. Statistical comparison
analyses identified differentially expressed genes that
distinguished CIA from control rats. Clustering analyses
indicated that gene expression patterns correlated with
laboratory indices of disease progression. A set of 28 probe
sets showed significant differences in expression between
blood from arthritic rats and that from controls at the earliest
time after induction, and the difference persisted for the entire
time course. Gene Ontology comparison of the present study
with previous published murine microarray studies showed
conserved Biological Processes during disease induction
between the local joint and PBMC responses. Genes known to
be involved in autoimmune response and arthritis, such as those
encoding Galectin-3, Versican, and Socs3, were identified and
validated by quantitative TaqMan RT-PCR analysis using
independent blood samples. Finally, immunoblot analysis
confirmed that Galectin-3 was secreted over time in plasma as
well as in supernatant of cultured tissue synoviocytes of the
arthritic rats, which is consistent with disease progression. Our
data indicate that gene expression in PBMCs from the CIA
model can be utilized to identify candidate blood biomarkers for
RA.
Introduction
Rheumatoid arthritis (RA) is a chronic autoimmune disease of
unknown etiology that affects 0.5–1% of the population [1]. It
is a polyarthritis characterized by inflammation, altered
humoral and cellular immune responses, and synovial hyper-
plasia, leading to destruction and subsequent loss of function
of multiple joints [1-4]. Although the exact pathogenesis of RA
is not fully understood, the immune and inflammatory systems
are intimately linked. Studies on affected joints focusing on
cartilage, bone, and synovial tissues have yielded important
insights into the mechanisms of disease initiation and progres-
sion. Initially, T cell recruitment and recognition of autologous
or cross-reacting antigens in the joint produce a variety of
mediators, some of which facilitate the development of autoan-
ANOVA = analysis of variance; CIA = collagen-induced arthritis; CII = type II collagen; DEG = differentially expressed gene; FDR (fdrate) = false
discovery rate; GO = Gene Ontology; IL = interleukin; PBMC = peripheral blood mononuclear cell; RA = rheumatoid arthritis; RT-PCR = reverse
transcriptase polymerase chain reaction; TNF = tumor necrosis factor.
Arthritis Research & Therapy Vol 8 No 1 Shou et al.
Page 2 of 14
(page number not for citation purposes)
tibodies that are detectable in the serum of RA patients [5].
The ensuing inflammatory responses, induced by tumor necro-
sis factor (TNF)-α and other proinflammatory cytokines, lead to
synovial fibroblast hyperplasia, destruction of the extracellular
matrix, and eventual damage to the affected joints [5,6].
Although there have been many studies of cells within the
arthritic joint, the responses of the peripheral blood leukocytes
are not well understood. An examination of the circulating lym-
phocytes may provide an important alternative perspective of
the processes that underlie RA and complement local charac-
terization of affected joints [7].
Circulating leukocytes provide an important source for biomar-
ker discovery for RA. Emerging high content approaches such
as genomics and proteomics have radically changed the ways
in which biomarkers are being studied [8-10]. The genomic
approaches have been used to elucidate the pathogenesis of
inflammatory diseases, including RA, and to identify novel drug
targets for RA treatment [3,11-15]. In contrast to target tissue
biopsy based approaches, which are often limited by
restricted access to target tissues, profiling peripheral blood
cells has emerged as an attractive biomarker discovery strat-
egy [10,16-22]. Another added advantage to analyzing periph-
eral blood cells is the fact that blood is a highly dynamic
environment, communicating with practically every tissue in
the body, and is thus proposed as a 'sentinel tissue' that
reflects disease progression in the body [21,23]. Profiling
peripheral blood cells has indeed been used to elucidate
autoimmune diseases [7,24].
The rat model of collagen-induced arthritis (CIA) has many
similarities to RA [25]. In this model (also demonstrable in
mice and monkeys), immunization with type II collagen (CII) –
the collagen found in joint cartilage – induces T cell activation,
anti-CII autoantibody production, and inflammation and joint
destruction similar to that observed in human RA [25,26].
Although there are clearly differences between RA and CIA,
changes in peripheral blood gene expression during the devel-
opment of CIA may suggest potential novel biomarkers for RA.
This could be of value both in monitoring the effects of drugs
on disease progression and in discovering potential biomark-
ers, particularly for individuals with early RA. The latter is major
problem in RA biomarker identification efforts because human
studies are often limited by the late diagnosis relative to the
early disease onset. Studying CIA with gradual induction of
arthritis could potentially reveal early biomarkers for RA. More-
over, gene expression profiling in animal model holds great
promise for our understanding of human pathogenesis. For
example, profiling gene expression in a rat model of inflamma-
tion using SAGE (serial analysis of gene expression) has pro-
vided novel insights into mast cell activation [27].
In the present study, we profiled gene expression in rat periph-
eral blood mononuclear cells (PBMCs) during the develop-
ment of CIA. We established the method for blood collection,
cell fractionation, RNA isolation, and microarray analysis using
the Affymetrix GeneChip technology (Affymetrix, Santa Clara,
CA, USA). We identified a large number of genes that were
differentially expressed between blood from control and
arthritic animals. The gene expression signature in blood
appeared to correlate with laboratory indices of disease induc-
tion. Using bioinformatics and statistical analyses, we identi-
fied a subset of putative biomarkers, which were subsequently
validated using TaqMan RT-PCR and immunoblot analyses.
Materials and methods
Rat collagen-induced arthritis model, blood collection,
and peripheral blood mononuclear cell isolation
The protocol for the in vivo studies was approved by the Lilly
Institutional Animal Care and Use Committee. Adult (approxi-
mately 8 weeks old) female Lewis rats weighing approximately
150 g were obtained from Charles River (Wilmington, MA,
USA), housed under standard conditions, and given free
access to food and water. Animals were acclimated to the
holding room for at least 7 days before initiation of the studies.
For the induction of CIA, CII (Elastin Products Company,
Owensville, MO, USA) was dissolved in sterilized 0.01 mol/l
acetic acid (Sigma-Aldrich, St. Louis, MO, USA) to a final con-
centration of 2 mg/ml. The mixture was stirred at 4°C overnight
until the CII was completely dissolved. CII (2 mg/ml) and
incomplete Freund's adjuvant were homogenized at a 1:1 ratio
using a PowerGen 125 (Fisher Scientific, Pittsburgh, PA,
USA). Each rat was injected intradermally at multiple sites on
the back with a total of 0.3 ml of the emulsion (day 0). Seven
days later (day 7) this immunization protocol was repeated.
Induction and severity of arthritis was determined by change in
ankle weight, measured using calipers. Based on previous
experience, arthritis (as determined by the first signs of red-
ness or swelling of the ankle joints) is observed approximately
12 days after the first CII immunization. By day 21 the inflam-
matory response in the ankles has reached its peak, and by
day 28 there is significant joint pathology. For these reasons,
samples were collected on day 0 (baseline), and on days 10,
21, and 28. Ten rats were collected at each time point. We
also included non-immunized animals as negative controls on
days 10, 21, and 28. Because of the loss of a few samples due
to sample processing or raw chip data quality assurance, the
actual number of chips that were statistically analyzed were
(respectively) 10, 5, 4, and 5 for control rats on days 0, 10, 21,
and 28; and 9, 2, and 8 for arthritic rats on days 10, 21, and
28.
For gene expression analysis, on days 0, 10, 21, and 28, a vol-
ume of 3–5 ml blood from individual animals at time of sacrifice
was collected by cardiac puncture into heparinized vacutainer
tubes (Becton Dickenson, San Jose, CA, USA). Leukocyte
counts were determined using a Hemovet 950 (Drew Scien-
tific, Oxford, CT, USA). For PBMC isolation, blood was centri-
fuged at 1500 g for 20 minutes to remove the plasma. The cell
pellet was resuspended in Hanks' balanced salt solution
Available online />Page 3 of 14
(page number not for citation purposes)
(Gibco BRL/Invitrogen, Carlsbad, CA, USA) to the original vol-
ume and the cell suspension was carefully layered over the top
of 5 ml of Lympholyte-Rat (Cedarlane Labs, Hornby, Ontario,
Canada) in a 15 ml Falcon tube. The tubes were centrifuged
for 40 minutes at 1500 g and the white cell layer was collected
using a Pasteur pipette. PBMCs were rinsed twice with cold
Hanks' balanced salt solution and stored in RNAlater (Ambion
Inc., Austin, TX) until RNA isolation.
RNA isolation and microarray experiments
RiboPure-Blood Kit (Ambion Inc., Austin, TX, USA) was used
for isolation of high quality total RNA from PBMCs. After
removing RNAlater by centrifugation, blood cell pellets were
lysed in lysis buffer with sodium acetate solution, in accord-
ance with the manufacturer's instruction. RNA was isolated by
acid-phenol:chloroform extraction and further purified on a col-
umn with glass fiber filter. RNA was then eluted in RNase-free
water. Samples were run on a RNA 6000 Nano Gel System
(Agilent Technologies Inc., Palo Alto, CA, USA) using Agilent
2100 Bioanalyzer (Agilent) for RNA quality determination.
RNA was further purified by using the RNeasy spin column
(QIAGEN Inc., Valencia, CA, USA), and then cDNA was gen-
erated and labeled for Affymetrix GeneChip according to the
standard Affymetrix approach and as previously described
[28,29]. Two micrograms of total RNA was used per labeling
reaction. cDNA and labeled in vitro transcription product were
purified using the GeneChip Sample Clean Module (Affyme-
trix). We obtained an average in vitro transcription product
yield of about 26.8 ± 9.7 µg/2 µg input RNA, which is suffi-
cient for chip hybridization. Biotin labeled RNA was frag-
mented and hybridized to rat genome RAE230A chips. Chip
processing, image capturing, and raw data analyses were per-
formed using the Affymetrix Microarray Suite MAS5. Probe set
signal intensities of each hybridized gene chip were extracted
using MAS5 and were normalized using all probe sets to reach
the overall 2% trimmed mean of 1,500 for each chip. Chip per-
formance of both control and arthritic samples met standard
quality assurance criteria. The chips had an average back-
ground of 61.3 ± 8.2, a Raw Q of 2.5 ± 0.4, and percent
present call of 46.8 ± 3.3%.
Statistical analysis to identify differentially expressed
genes
The signal intensity data were fitted to an analysis of variance
(ANOVA) model to compare the CIA treated samples with
control samples at each time point. For a particular probe set,
let Y
ijk
be the normalized signal of sample k in treatment j at
time I (specifically, i = 1, 2, 3, and 4 for days 0, 10, 21, and 28,
respectively; j = 1 and 2 for control and CII injected rats,
respectively; and k = 1 10 for rats in each treatment group
at each time point). The data were fitted to the following statis-
tical model:
Y
ijk
= µ + β
i
+ τ
j
+ β τ
ij
+ ε
ijk
, ε
ijk
~ N(0,σ
2
)
This ANOVA model uses data from all the samples for each
probe set to estimate accurately the sample variance to reach
robust hypothesis testing. It applies the time effects of sample
collection for both CIA and control animals when identifying
changes in gene expression after CII injection. This model
allows identification of gene expression changes between CIA
and control samples at each matched time points, as well as
gene expression changes over time in the control samples.
The gene expression fold change is the ratio of the average
signals of samples in the comparison (for example, treated/
control); if the fold change is less than 1, then the ratio is
reversed and a '-' added (for example, minus control/treated).
Data from each probe set were fitted to the above model inde-
pendently as is done in other studies [30,31].
To control the false positive rate of testing the expression
change of thousands of genes simultaneously, false discovery
rate (fdrate or FDR) was estimated using an algorithm derived
by Benjamini and Hochberg [32]. FDR estimates the false
positive rate of a 'significant' gene list. Suppose that P
i
(i = 1,
2 m) are the P values resulting from testing m expression
changes. Sort P
i
from the smallest to the largest, and let P
(i)
be
the i
th
sorted P value and i its rank. Then, the FDR for each
sorted P value was calculated by timing the P value with m/i,
and monotonizing all of the FDRs from the largest to the small-
est:
fdrate P
fdrate
m
i
Pfdrate
mm
iii
() ()
() () ( )
;
min , ,
=
=
=
+1
for i 112 1, …m −
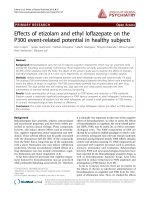
Figure 1
Inflammatory response in the ankles of rats during the development of CIAInflammatory response in the ankles of rats during the development of
CIA. Ankle diameters were measured in naïve (n = 5) and CII immu-
nized (n = 10) rats on the indicated days, before blood collection and
sacrifice of the animals. Each time point represents a different set of
animals. CIA, collagen-induced arthritis; CII, collagen type II.
Arthritis Research & Therapy Vol 8 No 1 Shou et al.
Page 4 of 14
(page number not for citation purposes)
Bioinformatics analyses
Clustered correlation analysis
Cluster correlation analysis was performed with an R script
written in-house, in accordance with the method proposed by
Weinstein and coworkers [33].
Ortholog mapping and Gene Ontology analyses
Genbank accessions or gene identifications were retrieved
from published papers or online supplementary materials, and
their rat orthologs were obtained by querying NCBI Homolo-
Gene database [34]. The Gene Ontology (GO) analysis was
carried out by using GoMiner, developed by Weinstein and
colleagues [35]. Briefly, retrieved gene symbols were input
into GoMiner, which maps them onto the GO tree, in particular
the ontology Biological Process, using organism-specific
information provided by NCBI GoMiner server. Percentages of
differentially expressed genes were calculated for 10 selected
entries within the ontology Biological Process at the third or
fourth GO level.
Quantitative real-time RT-PCR validation
RNA from an independent CIA life phase study was used to
validate microarray data. Before cDNA synthesis, RNA sam-
ples were DNase treated to remove genomic DNA contamina-
tion by using Ambion's DNA-free Kit (Ambion Inc., Austin, TX,
USA), in accordance with the manufacturer's instructions.
cDNA was prepared from total RNA using Superscript III (InV-
itrogen, Carlsbad, CA, USA) with random primers as
described by the manufacturer. Real-time PCR was performed
on an ABI 7900HT from Applied Biosystems (ABI, Foster City,
CA, USA) with gene expression assays or with primers and
probes from Biosource International (Camarillo, CA). Primers
and probes were designed using Primer Express (ABI). Briefly,
cDNA templates for real-time PCR were prepared by diluting
1:100 with 10 mmol/l Tris (pH 7.5). The 20 µl TaqMan reac-
tion consisted of 1 × Universal Master Mix (ABI), 1 × Gene
Expression Assay (ABI), and 4 µl diluted cDNA. TaqMan reac-
tions for genes that were assayed with primers and probes
consisted of 1 × Universal Master Mix (ABI), 0.8 µmol/l for-
ward and reverse primers, 0.2 µmol/l probe, and 4 µl diluted
cDNA in a final volume of 20 µl.
Five replicates of each RT-PCR reaction were assembled in
384-well plates, on a Tecan Genesis 150 (Maennedorf, Swit-
zerland) liquid handling robot. Each plate included no RT con-
trols for each sample and no template control. Raw data were
analyzed using a macro created in Microsoft Excel. Briefly, the
high and low values from each of the five replicates were dis-
carded and the remaining three values averaged. The average
values were normalized to 18s rRNA relative expression val-
ues. Data analysis was conducted in JMP 5.1.1 (SAS Institute,
Cary, NC, USA). Best Box-Cox transformation was used in
order to fit the model. For comparing the means of groups with
the control group, the data for different time points were tested
through Dunnet's test. Conventional alpha (a = 0.05) is
regarded as significant.
Gene expression assays (ABI) were included for the following
genes: Galectin-3 (Lgals3, Rn_00582910_m1) and Cish3
(Rn00585674_s1). Primers and probes for Versican (Cspg2)
and IL-6 were purchased from Biosource International.
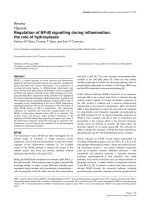
Figure 2
Identification of differentially expressed genes between the rats with CIA and the control ratsIdentification of differentially expressed genes between the rats with
CIA and the control rats. (a) Number of significantly changed probe
sets over time. Statistical pair-wise comparisons and empirical filtering
were applied to identify differentially expressed genes (FDR <0.05, fold
change >1.4, signal difference >250), as described in the Materials
and methods and Results sections. Pink bars represent the number of
probe sets that are significantly different from the day 0 control at the
indicated time points. Blue bars represent the number of probe sets
that are significantly different from the day 0 control as well as the time-
matched control at the indicated time points. Red bars represent the
number of probe sets that are significantly different from the day 0 con-
trol as well as the time-matched control at indicated time points, with
the probe sets that fluctuated in control animals excluded. (b) Venn dia-
gram of the differentially expressed genes. Probe sets identified as sig-
nificantly changed genes at each time point were examined for
overlapping over time. There are a total of 28 probe sets that signifi-
cantly changed at all three time points. Note that there is a considera-
ble amount of overlapping between day 10 and day 21; half of the
genes identified at day 28 are also included in the day 10 and day 21
gene lists. CII, collagen type II; FDR, false discovery rate.
Available online />Page 5 of 14
(page number not for citation purposes)
Sequences for the Cspg2 primers were as follows: forward,
5'-CGCCTAAGACACTACGTATGCTTGT-3'; reverse, 5'-
TTGGTCCTATGTTGACTGTTTCTCA-3'; and probe, 5'-
AGCATAGTCATTCCCTCTAAGCCAAAGAAGGTTC-3',
labeled with 6-FAM and BHQ-1. IL-6 primers were as follows:
forward, 5'-CATAGTCGTGCCTGTGTGCTTAG-3'; reverse,
5'-AGGTCTCGTTTATTAAAGCAGAACAAG-3'; and probe,
5' TTTCCTCCTGACAACGCTGCTGGG-3', labeled with 6-
FAM and BHQ-1.
Synovial tissue culture and Western blot analysis for
Galectin-3
Synovial tissue from the arthritic rats at different times after CII
immunization were dissected and collected in the collecting
Table 1
Genes that changed significantly in all the arthritic rat blood samples
Probe set Fold change (CIA/control) Gene description
Day 10 Day 21 Day 28
1367612_at 4.94 4.31 2.10 Mgst1: microsomal glutathione S-transferase 1
1367816_at 1.89 2.58 1.51 GIIg15b: protein similar to 2300002F06Rik
1367900_at 4.93 4.56 2.93 Gyg: glycogenin (glycogenin glucosyltransferase)
1367904_at 1.84 1.76 1.49 Resp18: regulated endocrine-specific protein 18
1369584_at 1.76 2.32 1.91 Socs3 (Cish3): suppressor of cytokine signaling 3
1369956_at 2.81 2.82 1.98 Ifngr: similar to interferon gamma receptor
1370119_at 3.10 2.73 1.86 Lst1: member of the LST-1 protein family
1370249_at 3.01 3.99 1.92 Bzrp: peripheral-type benzodiazepine receptor
1371916_at 2.64 3.29 1.60 Sepr: selenoprotein R
1372150_at 2.24 2.39 1.72 Usp10: human ubiquitin specific protease 10 like
1372248_at 1.88 3.11 1.76 SESN1: p53 regulated PA26 nuclear protein
1372691_at 4.46 6.19 2.32 Upp1: uridine phosphorylase 1
1373656_at 2.83 4.03 1.74
1374375_at 3.45 5.60 2.21 2610034M16Rik
1377092_at 3.61 2.38 3.71
1377110_at 1.49 2.60 1.48 Plxdc1: plexin repeat containing family member
1386052_at 1.80 2.70 1.58
1386879_at 3.35 5.20 2.36 Lgals3: Galectin-3
1386908_at 2.66 2.32 1.61 Glrx1: Glutaredoxin
1387568_at 3.68 4.65 1.82 Pirb: paired immunoglobulin-like receptor-B
1387599_a_at 2.73 4.12 1.76 Nqo1: NADH:NADPH diaphorase
1388054_a_at 3.64 3.31 1.98 Cspg2: chondroitin sulfate proteoglycan 2 (versican)
1388142_at 3.82 3.15 1.90 Cspg2: chondroitin sulfate proteoglycan 2 (versican)
1388265_x_at 1.75 2.60 2.28 Cspg2: chondroitin sulfate proteoglycan 2 (versican)
1388416_at 3.10 2.03 1.99
1388528_at 1.50 2.24 1.43 Fbl: Fibrillarin
1389006_at 2.15 1.89 1.46 Mpeg1: member of the membrane attack complex
1389408_at 2.91 3.09 1.58
Listed are probe sets for genes that showed significant difference between the arthritic and control rat blood identified by analysis of variance and
filtered by empirical cutoffs. Probe set: identification of known genes and expressed sequence tags on the chip; Fold change: fold change values
that was calculated between the arthritic samples and the time-matched controls; gene description: description of the genes encoded by the
corresponding probe set.
Arthritis Research & Therapy Vol 8 No 1 Shou et al.
Page 6 of 14
(page number not for citation purposes)
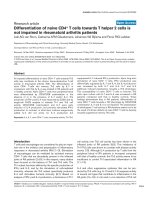
Figure 3
Clustering analyses using gene expression in PBMCs and the laboratory indices of disease progressionClustering analyses using gene expression in PBMCs and the laboratory indices of disease progression. (a) Hierarchical clustering analysis using
998 nonredundant significant probe sets. The 998 nonredundant significant genes were normalized using Z-score calculation. Genes were clus-
tered in Spotfire DecisionSite (Spotfire, Somerville, MA, USA). The correlation coefficient was used as distance metric and complete linkage was
used as the clustering algorithm. (b) Hierarchical clustering of laboratory indices of disease progression. The laboratory indices for disease progres-
sion were used to cluster the samples. The measurements were normalized using the Z score across different animals and clustered in Spotfire
DecisionSite, using the same algorithm as that for gene expression clustering, with correlation coefficient being used as distance metric and com-
plete linkage as the clustering algorithm. The measurements are as follows: animal gross weight (weight), paw size (paw size), total white cell count
(WBC), total lymphocyte count (LY), percentage lymphocyte of total WBCs (LY%), total monocyte count (MO), percentage monocyte count
(MO%), total neutrophil count (NE), percentage neutrophil count (NE%), total eosinophil count (EO), percentage eosinophil count (EO%), total
basophil count (BA), and percentage basophil count (BA%). Statistical tests were performed and the P value was attached for each measurement.
Note that the phenotypic measurements separated the sample in a similar manner to the gene expression profiles. CIA, collagen-induced arthritis
Available online />Page 7 of 14
(page number not for citation purposes)
medium (Dulbecco's modified Eagle's medium + 0.5% penicil-
lin/streptomycin and antimycotics; Gibco-BRL/Invitrogen).
The tissue was washed two times with the collecting medium
and one time with the culture medium (Dulbecco's modified
Eagle's medium + 10% heat inactivated fetal calf serum and
1% penicillin/streptomycin; Gibco-BRL/Invitrogen). The syno-
vial tissue was then placed immediately into a 24-well tissue
culture plate (two pieces of synovium in 1 ml medium per well)
with culture medium, and cultured in 5% carbon dioxide at
37°C for 48 hours. The culture plate was centrifuged at 1500
rpm for 10 minutes at 4°C. The supernatant was collected and
stored under -80°C until the assay.
Plasma or supernatant from cultured tissue synoviocytes of
the CIA rats was subjected to Western blotting using NuPage
4–12% Bis-Tris gels, MOPS running buffer, transfer buffer,
and 0.2 µm PVDF membrane (Invitrogen), in accordance with
the manufacturer's protocol. Monoclonal antibody to Galectin-
3 antibody (A3A12; cat. no. 804-284-C100) was purchased
from Alexis Biochemicals (San Diego, CA, USA). Recom-
binant mouse Galectin-3 protein (cat. no. 1197-GA; R&D Sys-
tems, Minneapolis, MN, USA) was used as positive control.
The blots were developed using SuperSignal West Femto
Maximum Sensitivity Substrate from Pierce (Rockford, IL,
USA).
Results
Gene expression profiling in peripheral blood
mononuclear cells in the collagen-induced arthritis
model
To identify putative biomarkers for arthritis, we surveyed global
gene expression profiles of PBMCs in a rat CIA model using
DNA microarray technology. We assayed PBMCs from ani-
mals sacrificed at days 10, 21, and 28 after the first CII immu-
nization and day 0 naïve rats. These time points were chosen
based on the pathological development of disease in this
model. Changes in ankle diameter (a measure of inflammation)
in the different groups are presented in Figure 1.
We applied statistical analyses to examine the difference in
gene expression between the control and arthritic rat blood
samples. We considered FDR 0.05 to be significant (for exam-
ple, of the selected 'significant' probe set list, 95% are
expected to be real positives). We further trimmed down the
probe set list by applying empirical criteria of fold change at
least 1.4 (increase or decrease) and mean signal difference at
least 250, in order to reduce errors pertained to low-level
expression at close to noise level. In addition, in this experi-
ment we had time-matched naïve control samples at each time
point, so we could assess the gene expression changes over
time in the control animals, or basal expression variation.
Figure 4
Correlation between gene expression profiles and laboratory indices of disease progressionCorrelation between gene expression profiles and laboratory indices of disease progression. (a) Clustered correlation analysis. Gene expression
data were correlated with phenotypic measurements using clustered correlation analysis 33. The correlation coefficient values of each probe set to
laboratory measurements were presented in a heat map visualization generated in Spotfire DecisionSite. The measurements are as follows: animal
gross weight (weight), paw size (paw size), total white cell count (WBC), total lymphocyte count (LY), percentage lymphocyte of total WBCs (LY%),
total monocyte count (MO), percentage monocyte count (MO%), total neutrophil count (NE), percentage neutrophil count (NE%), total eosinophil
count (EO), percentage eosinophil count (EO%), total basophil count (BA), and percentage basophil count (BA%). (b) Correlation of Versican
expression with neutrophil count. The expression level (signal intensity) of Versican from the Affymetrix microarray experiment were plotted, together
the neutrophil count (K/µl) for each animal that was used in our microarray study. CIA, collagen-induced arthritis.
Arthritis Research & Therapy Vol 8 No 1 Shou et al.
Page 8 of 14
(page number not for citation purposes)
The control animals at each time point were compared with
day 0 control animals. We observed a considerable amount of
basal gene expression change, which could be attributable to
biologic fluctuation or technical variation. Because we were
interested in biomarkers, we focused our analysis on genes
with large expression changes after CIA induction but that
were relatively stable in the control animals. Thus, we excluded
genes that had a large basal expression fluctuation. After
excluding the 'fluctuating' probe sets from our significant gene
lists, we identified a total of 998 nonredundant probe sets,
including 714 known genes that changed significantly at least
at one time point. The number of significantly changed probe
sets was plotted as a function of time after CII immunization in
Fig. 2a. The probe sets and associated annotations are sum-
marized in Additional file 1 for each of the three time points.
Venn logic analysis of the 998 probe sets showing the distri-
bution of these genes with respect to time is shown in Figure
2b. We observed a notable amount of overlapping probe sets
between day 10 and day 21, but substantially fewer genes
were identified for day 28 samples. Nevertheless, almost half
(28 out of 58 probe sets) of the day 28 probe sets overlapped
with day 10 and day 21. As an initial effort, we focused on
genes whose expression changed significantly at all three time
points – a list of 28 probe sets that might have a wider time
window for assay development. Because of probe set redun-
dancy for Versican/Cspg2, the 28 probe sets actually repre-
sented 20 unique known genes and six expressed sequence
tags. These 28 probe sets are summarized in Table 1.
Correlation of gene expression pattern with laboratory
indices for disease progression
We next explored the hypothesis that differences in gene
expression between the arthritic and the control rat peripheral
blood reflect pathological progression in the CIA model.
Shown in Figure 3a is a hierarchical clustering analysis using
the nonredundant 998 differentially expressed genes (DEGs)
identified from the ANOVA analysis. Expression of these 998
probe sets in the arthritic rats was clearly distinct from that in
control rats. We next clustered the samples using the normal-
ized laboratory indices including blood cell counts and paw
size measurements. The animals were grouped in a manner
similar to gene expression clustering (Figure 3b). The total
white blood cells, percentage of lymphocytes, and percentage
of and total neutrophil counts in arthritic animals were different
from those in controls over time. We then performed statistical
analysis by fitting the laboratory indices to a similar ANOVA
model used for gene expression analysis over the three time
points (days 10, 21, and 28). The test showed that the differ-
ence between CIA and control animals over the three time
points were significant for most of these laboratory measure-
ments. The P value for each measurement is shown in Figure
3b.
In an attempt to explore the possible correlation between gene
expression pattern and laboratory indices of disease progres-
sion, we integrated the gene expression data with the labora-
tory indices using clustered correlation analysis [33]. The
results are shown in Figure 4a. Details regarding the correla-
tion between each of the 998 DEGs and laboratory indices are
summarized in Additional file 2. Remarkably, the 28 probe sets
we identified using ANOVA test and Venn logic analysis were
among the genes that best correlated with laboratory indices.
The gene that exhibited the strongest correlation with total
white cell, and total and percentage neutrophil counts was
Versican, whereas the gene that negatively correlated with
percentage lymphocyte count the best was GIIg15b. Both
genes are among the 28 probe sets identified (Table 1). Con-
cordant change between Versican and neutrophil count is
shown in Figure 4b as a representative example of the agree-
ment between gene expression and laboratory measurements.
Taken together, these data suggest that the gene expression
pattern overall correlates with laboratory indices of disease
progression.
Comparison of the present study with published microarray
studies in murine rheumatoid arthritis models
We compared our results with the findings of four previous
studies conducted in murine autoimmune arthritis models
[11,13-15] in order to appreciate better the gene expression
in PBMCs in the rat CIA model. We retrieved the reported
DEGs from these published studies. Comparisons were made
at two levels. First, we compared differentially expressed rat
Figure 5
Biologic processes revealed by the present study and previously pub-lished murine studiesBiologic processes revealed by the present study and previously pub-
lished murine studies. Genes identified by previous published studies
were retrieved from the papers or from online supporting materials [11,
13-15]. Their rat orthologs were obtained by querying NCBI Homolo-
Gene database. The retrieved gene symbols were mapped onto the
Gene Ontology (GO) tree, in particular Biological Process, using GoM-
iner. Percentages of differentially expressed genes were calculated for
the selected 10 biological processes at the third or the fourth GO lev-
els and plotted. Note the overall similarity in Biological Process repre-
sented by the five independent studies.
Available online />Page 9 of 14
(page number not for citation purposes)
and mouse ortholog genes, which originated from a common
ancestor gene and are assumed to play similar biological func-
tions in two distinct species [34]. Of 714 DEGs identified from
our study, 70 genes were also identified by at least one other
study. Nine of them were identified by at least three studies,
including Scos3/Cish3, S100a8, Ptpns1, Lst1, Ctsk, Cd14,
Csrp3, App, and Bzrp. Although ortholog gene comparison is
relatively easy to interpret, it may not be desirable because of
the fact that the different studies were conducted in different
conditions, for example using different chip platforms. Thus,
we compared our study with the other four studies in terms of
the Biological Processes (GO ontology) in which the identified
DEGs were involved. Each list of DEGs identified by the differ-
ent studies was mapped onto the Biological Process GO tree
using GoMiner [35]. Percentages of DEGs at each GO cate-
gory at the third and fourth levels were calculated. Figure 5
shows the percentages of the top 10 Biological Processes in
the five studies. Although gene–gene comparison shows rela-
tively little overlap, comparison at higher Biological Processes
revealed much greater consistency. For example, the most
important Biological Processes include metabolism, cell com-
munication, localization, and transport. Heterogeneous
response was only observed in the category of response to
stimulus.
Functional relevance and validation of putative biomarker
candidates
Regulated cytokine expression was reported to be associated
with local joints during the development of RA [5]. We sur-
veyed our data for cytokine expression. The expression of
cytokine-related probe sets defined by GO are summarized in
Additional file 3. Our data indicated that a few cytokines were
differentially regulated between arthritic rats and the controls.
For example, expression of IL-1β and its type II receptor were
significantly upregulated at days 10 and 21, but not at day 28.
Our data revealed the involvement of interferon-γ, TNF-α, and
transforming growth factor-β signaling pathways during arthri-
tis development in the CIA model, which is consistent with pre-
vious studies.
We focused our initial experimental characterization and vali-
dation on three genes: Galectin-3, Versican, and Socs3. They
were previously implicated in RA and other immune and inflam-
matory disorders [24,36-38]. As shown in Figure 6, all three
genes were expressed to significantly greater extents in the
arthritic animals than in the controls at all three time points,
correlating with inflammation and immune responses. To vali-
date our microarray findings, we performed real-time RT-PCR
on the three identified candidate biomarker genes using a sep-
arate animal cohort with more defined time points to increase
validity. The results are shown in Figure 7. The numbers of
samples assayed for a given gene at each time point are
marked on the histogram. The expression of Galectin-3,
Socs3, and Versican over time in the CIA model, as revealed
by RT-PCR, agreed well with the microarray data. In contrast
Figure 6
Expression of three selected biomarker candidates of interestExpression of three selected biomarker candidates of interest. (a)
Galectin-3, (b) Veriscan/Cspg2, and (c) Socs3 were selected as puta-
tive biomarker candidates of interest. The signal intensity data for these
three genes were plotted over time. There are three probe sets for Ver-
sican that are significantly different between the arthritic and control
samples. Data are expressed as Mean ± standard deviation. Note that
expression of these probe sets are low in the control samples, and are
upregulated in the arthritic samples at all time points examined. CIA,
collagen-induced arthritis.
Arthritis Research & Therapy Vol 8 No 1 Shou et al.
Page 10 of 14
(page number not for citation purposes)
IL-6, which is an acute response cytokine [5] and was not
identified as a significantly changed gene in our microarray
study, did not exhibit significant difference in expression over
time by the RT-PCR analysis.
Immunoblot analysis of Galectin-3 expression in
collagen-induced arthritis rat cultured synoviocytes and
plasma
We examined whether the difference in gene expression
observed at the mRNA level in PBMCs could be extended to
the protein level. We performed Western blot analysis on
Galectin-3 using cultured tissue synoviocytes or plasma from
the CIA animal cohort that was used for PCR validation.
Because Galectin-3 is a secreted protein [36], we first
attempted to detect it in the supernatant of cultured tissue syn-
oviocytes. A recombinant mouse Galectin-3 was used as a
positive control for the anti-Galectin-3 antibody used in our
study. Although the predicted molecular weight of mouse
Galectin-3 is 27.3 kDa, the recombinant protein appeared to
have a greater molecular mass on the Western blot (Figure
8a). Importantly, a corresponding band was detected in the
cell supernatant samples collected at days 17, 22 and 25, but
not at the earlier time points. A similar protein expression pro-
file for Galectin-3 was detected in plasma (Figure 8b), further
supporting our RNA expression results and the feasibility of
developing Galectin-3 as a blood biomarker-based standard
protein assay for preclinical and clinical studies.
Discussion
Biomarkers for RA are much needed if we are to understand
and measure disease progression, and to facilitate the devel-
opment of novel treatments for RA. In the present study we
described a noninvasive strategy to discover RA biomarkers
by transcript profiling of peripheral circulating lymphocytes. As
an initial proof-of-concept, we demonstrated the feasibility of
such technology by successful profiling PBMCs in a rat CIA
model. We characterized differential gene expression
between the normal and arthritic animals, and demonstrated
that the gene expression in PBMCs could serve as surrogates
that are indicative of disease progression.
We used the combination of statistical ANOVA analysis with
clustered correlation and biologic relevance analysis to select
a workable number of genes as potential biomarker candi-
Figure 7
TaqMan validation of the expression of the selected biomarker candidatesTaqMan validation of the expression of the selected biomarker candidates. TaqMan RT-PCR was performed using primer and probe sets specific to
(a) Galectin-3, (b) Veriscan/Cspg2, and (c) Socs3. (d) IL-6, an acute responding gene that has not been selected from the microarray analysis, was
also assayed as a control. The RNA samples are independent from the ones used for microarray analysis, and more time points were used in the
PCR analysis. Data are expressed as mean ± standard error. The number of the samples assayed for each group is marked in the parenthesis above
the histogram. * P < 0.05, by Dunnet's test. CII, collagen type II.
Available online />Page 11 of 14
(page number not for citation purposes)
dates and to assess the specificity of these marker candi-
dates. We were able to confirm elevated Galectin-3 protein
expression in the CIA plasma and cultured synovial tissue [36].
Interestingly, Galectin-3 and its binding protein, but not Galec-
tin-1, were reported to be elevated in RA but not in osteoarthri-
tis [36]. In our study, Galectin-1 was not shown to be elevated
in arthritic rat blood either. Thus, blood expression of Galectin-
3 is likely to be specific to RA. Socs3 might also be specific to
RA [38]. In contrast, Versican/CSPG2 is implicated in oste-
oarthritic cartilage [37]. Although it was also reported to be
over-expressed in PBMCs from RA patients [7,24,39], we
speculate that Versican might be involved more in the inflam-
mation responses linked to bone erosion.
The genes we identified also exhibited strong correlation with
phenotypic measurements, as demonstrated by the clustered
correlation analysis. Versican is the gene exhibiting the strong-
est correlation with the characteristic measurements, particu-
larly neutrophil count, in the CIA model. Moreover, members of
the Galectin family and its binding proteins, Socs3, and Versi-
can are all found to present in human blood (Shou and cow-
orkers, unpublished data). In the future, it will be of great
interest to extend these findings to clinical human blood and
explore the possibility that these markers could be used to aid
preclinical and clinical studies.
The differences between arthritic and control rat blood could
result from induction or suppression of gene expression, or
could be due to cell type specific gene expression in cell pop-
ulations recruited to the blood during the development of dis-
ease [40] – two alternatives that are very challenging to
distinguish. Our cell counting data indicate that total white cell
and neutrophil counts, among other parameters, are signifi-
cantly different between arthritic and control rat blood. Hence,
differences in composition or activation state between differ-
ent types of lymphocytes should contribute to and reflect the
differential gene expression that we observed. Our analysis of
the correlation between gene expression and laboratory indi-
ces might potentially reveal some insights regarding cell type
specific gene expression. In the future, it will be of interest to
explore further differential cell recruitment and its contribution
to gene expression and RA pathogenesis. Additional cell frac-
tionation and small quantity RNA labeling technologies
[41,42] will need to be developed to address this issue.
Another future direction in evaluating our candidate markers is
to monitor the expression of these genes when effective exper-
imental drugs are administrated to CIA rats. It will be important
to establish the association between drug effects on inflamma-
tion or bone erosion and the expression of the marker genes;
this may improve our understanding of drug pharmacokinetics/
pharmacodynamics, and facilitate assessment of new com-
pounds for RA treatment, ultimately in a clinical setting.
Major advantages in using the peripheral blood cells instead of
local joint tissue to seek biomarkers include the noninvasive
nature for the former approach and associated ease preclini-
cal and clinical development [10,20]. Moreover, blood is a
highly dynamic system, in which blood cells have a rapid natu-
ral turnover (blood cell turnover is estimated at 1 trillion cells/
day) [21]. Because the leukocytes interact and communicate
with practically every tissue, they bear rich information regard-
ing inflammation and immune responses [23]. Thus, blood –
increasingly being recognized as a sentinel tissue – is uniquely
suited to study of systematic responses during disease pro-
gression. For example, expression in blood of tissue-specific
cardiac genes was reported to permit distinction between
patients with coronary artery disease and normal control indi-
viduals [23]. This strategy has also been successfully applied
to the study of cancer biology [17,19], autoimmune disease
[7,13,24], cardiovascular disease [43], kidney disease [18],
post-traumatic stress disorder [44], and psychiatric disorders
[22]. Gene expression profiling in peripheral blood therefore
holds great promise for clinical development [10].
In the present study, we demonstrated that gene expression in
PBMCs from rats with CIA could distinguish arthritic samples
from normal control samples, and that gene expression in
PBMCs can indeed serve as a potential candidate biomarker
Figure 8
Immunoblot analysis of Galectin-3 in supernatant from cultured synovi-ocytes or plasma from arthritic ratsImmunoblot analysis of Galectin-3 in supernatant from cultured synovi-
ocytes or plasma from arthritic rats. Western blot analysis was per-
formed using an anti-Galectin-3 antibody on (a) supernatant from
cultured tissue synoviocytes or (b) plasma samples collected at the
indicated time points from arthritic rats. Two nanograms of recombinant
mouse Galectin-3 (R&D; cat. no. 1197-GA) was loaded as the positive
control (lane c). Arrow denotes rat Galectin-3; asterisk denotes non-
specific protein band.
Arthritis Research & Therapy Vol 8 No 1 Shou et al.
Page 12 of 14
(page number not for citation purposes)
of disease progression. Interestingly, some genes that we
identified in PBMCs have also been reported to exhibit altered
expression in local joints, suggesting conservation between
PBMCs and the local joint tissue in terms of their responsive-
ness to collagen-induced immunity. The contribution of the
genes expressed in PBMCs per se to disease progression in
CIA and the relevance of these genes to RA is not clear and
warrants future investigation. Nevertheless, the present study
provides additional evidence supporting the 'sentinel' hypoth-
esis.
A number of genomics studies were previously performed to
study RA pathogenesis in murine models [11,13-15,45] or
human patients [3,46], with a major focus on local joint tis-
sues. We compared our PBMC profiling findings with those of
four published local joint profiling studies using murine models
of RA. However, we only identified a limited number of individ-
ual genes exhibiting consensus. The observed discrepancy
may have multiple causes. First, gene expression in arthritic
animal blood is expected to differ substantially from local
arthritic joint responses. Second, the difference in technical
platforms (for example, spotted array versus the Affymetrix
GeneChip, different array versions, and differences in sample
preparation and analysis methods) used in these studies may
contribute significantly to the difference in DEGs identified.
Third, there is only a small portion of the annotated probe sets
for which rat orthologs have been identified. Finally, the inher-
ent difference between the murine and rat models of RA may
also contribute to the difference in gene expression.
We were able to confirm some known RA related genes in the
present study, such as Stat3, Bst1 (bone marrow stromal cell
antigen 1), Ptgs2 (prostaglandin G/H synthase 2), S100a9
(S100 calcium binding protein A9) and Ets1 (Ets avian eryth-
roblastosis virus E2 oncogene homolog 1), in addition to chon-
droitin sulfate proteoglycan 2, Galectin3 and Socs3
(suppressor of cytokine signaling 3). However, we failed to
identify some other previously reported RA related genes such
as CD36, CD44, STAT5b (signal transducer activator tran-
scription 5b), IL-1Ra follistatin-like genes, IL-13 receptor α,
and CCL27 (CC chemokine ligand 27), among others. Inter-
estingly, we identified a IL-1 decoy receptor that antagonizes
IL-1 signaling similarly to IL-1Ra, which is known to be involved
in RA, suggesting that the consensus could be reached at the
gene function level as opposed to the individual gene level.
We thus compared our data at a higher level by examining the
GO-defined Biological Process represented by the DEGs.
We observed a significant degree of agreement between our
study and the four previously published ones (Figure 5). The
consensus suggested conservation of Biological Processes
involved in arthritis development between the local joints and
PBMCs, as well as between murine and rat RA models.
The CIA model is a highly dynamic model, with time dependent
disease progression. Survey of DEGs identified at various time
points can help to improve our understanding of disease
development and facilitate biomarker identification. Genes
identified at early time points would presumably be informative
with respect to early signaling cascades during disease onset.
For example, Tnfrsf1b was found to be up regulated in day 10
arthritic rat PBMCs, but not at later time points. Tnfrsf1b
encodes a protein with strong similarity to TNF receptor 1b,
which induces T cell proliferation and apoptosis. Our data sup-
port the involvement of TNF signaling events in the early
autoimmune response. Swollen joints are among the important
characteristics of arthritis [47-49]. However, paw size meas-
urement only revealed moderate correlation with gene expres-
sion in PBMCs (Figure 4). The findings regarding gene
expression and correlation with laboratory indices indicate that
differences in gene expression in PBMCs between the arthritic
rats and control rats, even before the joint swelling, are evi-
dent, and thus might be indicative of the early onset of disease.
The details of differentially expressed probe sets at different
time points are described in Additional file 1. Further charac-
terization of the genes novel to arthritis will advance our under-
standing of and facilitate identification of novel biomarkers for
RA.
Conclusion
We established a noninvasive strategy to identify biomarkers
by gene expression profiling in PBMCs in an experimental
model of RA. We characterized the differential gene expres-
sion between the normal and arthritic animals, and demon-
strated that the gene expression in peripheral blood correlated
with laboratory indices of disease progression. Potential
biomarker candidates were further validated in independent
samples using real-time RT-PCR analysis. Finally, Galectin-3
protein was detected by immunoblot analysis in plasma from
CIA rats as well as in supernatants from cultured arthritic rat
synovial tissue. Further characterization of the genes novel to
arthritis will advance our understanding of and facilitate the
identification of novel biomarkers for RA.
Competing interests
The authors declare that they have no competing interests.
Authors' contributions
JS, HRQ, SLT, NWR, JAW and JEO participated in study
design. CMB and LL carried out the life phase animal experi-
ments and blood collection. JS performed the microarray study
and drafted the manuscript. HRQ performed the statistical
analysis. TW performed the bioinformatics analysis. SL, DP,
PJS, and LL were involved in PCR validation and analysis.
XYCC and SLT contributed to the Western blot analysis. JS,
HRQ, TW, SLT, JAW, and JEO contributed to data interpreta-
tion and participated in writing the manuscript. All authors read
and approved the final text before submission of the manu-
script.
Available online />Page 13 of 14
(page number not for citation purposes)
Additional files
Acknowledgements
We wish to thank Lawrence Gelbert, Kevin Duffin, Peter Mitchell, Mark
Rekhter, and members of the functional genomics group for helpful dis-
cussion, and the members of the Shou laboratory for critical reading of
the manuscript. We also acknowledge the support from the bioinformat-
ics/IT group. We should also like to thank the referees for their construc-
tive comments.
References
1. Smolen JS, Steiner G: Therapeutic strategies for rheumatoid
arthritis. Nat Rev Drug Discov 2003, 2:473-488.
2. Gay S, Gay RE, Koopman WJ: Molecular and cellular mecha-
nisms of joint destruction in rheumatoid arthritis: two cellular
mechanisms explain joint destruction? Ann Rheum Dis
1993:S39-S47.
3. Neumann E, Kullmann F, Judex M, Justen HP, Wessinghage D,
Gay S, Scholmerich J, Muller-Ladner U: Identification of differen-
tially expressed genes in rheumatoid arthritis by a combina-
tion of complementary DNA array and RNA arbitrarily primed-
polymerase chain reaction. Arthritis Rheum 2002, 46:52-63.
4. Feldmann M: Pathogenesis of arthritis: recent research
progress. Nat Immunol 2001, 2:771-773.
5. Choy EH, Panayi GS: Cytokine pathways and joint inflamma-
tion in rheumatoid arthritis. N Engl J Med 2001, 344:907-916.
6. Lorenz HM, Herrmann M, Kalden JR: The pathogenesis of
autoimmune diseases. Scand J Clin Lab Invest Suppl 2001,
235:16-26.
7. Olsen NJ, Moore JH, Aune TM: Gene expression signatures for
autoimmune disease in peripheral blood mononuclear cells.
Arthritis Res Ther 2004, 6:120-128.
8. Ideker T, Galitski T, Hood L: A new approach to decoding life:
systems biology. Annu Rev Genomics Hum Genet 2001,
2:343-372.
9. Hood L, Heath JR, Phelps ME, Lin B: Systems biology and new
technologies enable predictive and preventative medicine.
Science 2004, 306:640-643.
10. Frank R, Hargreaves R: Clinical biomarkers in drug discovery
and development. Nat Rev Drug Discov 2003, 2:566-580.
11. Gierer P, Ibrahim S, Mittlmeier T, Koczan D, Moeller S, Landes J,
Gradl G, Vollmar B: Gene expression profile and synovial
microcirculation at early stages of collagen-induced arthritis.
Arthritis Res Ther 2005, 7:R868-R876.
12. Heller RA, Schena M, Chai A, Shalon D, Bedilion T, Gilmore J,
Woolley DE, Davis RW: Discovery and analysis of inflammatory
disease-related genes using cDNA microarrays. Proc Natl
Acad Sci USA 1997, 94:2150-2155.
13. Adarichev VA, Vermes C, Hanyecz A, Mikecz K, Bremer EG, Glant
TT: Gene expression profiling in murine autoimmune arthritis
during the initiation and progression of joint inflammation.
Arthritis Res Ther 2005, 7:R196-R207.
14. Ibrahim SM, Koczan D, Thiesen HJ: Gene-expression profile of
collagen-induced arthritis. J Autoimmun 2002, 18:159-167.
15. Thornton S, Sowders D, Aronow B, Witte DP, Brunner HI, Giannini
EH, Hirsch R: DNA microarray analysis reveals novel gene
expression profiles in collagen-induced arthritis. Clin Immunol
2002, 105:155-168.
16. Amundson SA, Grace MB, McLeland CB, Epperly MW, Yeager A,
Zhan Q, Greenberger JS, Fornace AJ Jr: Human in vivo radiation-
induced biomarkers: gene expression changes in radiother-
apy patients. Cancer Res 2004, 64:6368-6371.
17. Xu T, Shu CT, Purdom E, Dang D, Ilsley D, Guo Y, Weber J, Hol-
mes SP, Lee PP: Microarray analysis reveals differences in
gene expression of circulating CD8
+
T cells in melanoma
patients and healthy donors. Cancer Res 2004, 64:3661-3667.
18. Alcorta D, Preston G, Munger W, Sullivan P, Yang JJ, Waga I, Jen-
nette JC, Falk R: Microarray studies of gene expression in cir-
culating leukocytes in kidney diseases. Exp Nephrol 2002,
10:139-149.
19. Twine NC, Stover JA, Marshall B, Dukart G, Hidalgo M, Stadler W,
Logan T, Dutcher J, Hudes G, Dorner AJ, et al.: Disease-associ-
ated expression profiles in peripheral blood mononuclear
cells from patients with advanced renal cell carcinoma. Can-
cer Res 2003, 63:6069-6075.
20. Fan H, Hegde PS: The transcriptome in blood: challenges and
solutions for robust expression profiling. Curr Mol Med 2005,
5:3-10.
21. Ogawa M: Differentiation and proliferation of hematopoietic
stem cells. Blood 1993, 81:2844-2853.
22. Tsuang MT, Nossova N, Yager T, Tsuang MM, Guo SC, Shyu KG,
Glatt SJ, Liew CC: Assessing the validity of blood-based gene
expression profiles for the classification of schizophrenia and
bipolar disorder: a preliminary report. Am J Med Genet B Neu-
ropsychiatr Genet 2005, 133:1-5.
23. Ma J, Liew CC: Gene profiling identifies secreted protein tran-
scripts from peripheral blood cells in coronary artery disease.
J Mol Cell Cardiol 2003, 35:993-998.
24. Olsen N, Sokka T, Seehorn CL, Kraft B, Maas K, Moore J, Aune
TM: A gene expression signature for recent onset rheumatoid
arthritis in peripheral blood mononuclear cells. Ann Rheum
Dis 2004, 63:1387-1392.
25. Trentham DE, Townes AS, Kang AH: Autoimmunity to type II col-
lagen an experimental model of arthritis. J Exp Med 1977,
146:857-868.
26. Williams RO: Collagen-induced arthritis as a model for rheu-
matoid arthritis. Methods Mol Med 2004, 98:207-216.
27. Chen H, Centola M, Altschul SF, Metzger H: Characterization of
gene expression in resting and activated mast cells. J Exp Med
1998, 188:1657-1668.
28. Shou J, Soriano R, Hayward SW, Cunha GR, Williams PM, Gao
WQ: Expression profiling of a human cell line model of pros-
tatic cancer reveals a direct involvement of interferon signal-
ing in prostate tumor progression. Proc Natl Acad Sci USA
2002, 99:2830-2835.
29. Onyia JE, Helvering LM, Gelbert L, Wei T, Huang S, Chen P, Dow
ER, Maran A, Zhang M, Lotinun S, et al.: Molecular profile of cat-
abolic versus anabolic treatment regimens of parathyroid hor-
mone (PTH) in rat bone: an analysis by DNA microarray. J Cell
Biochem 2005, 95:403-418.
30. Jin W, Riley RM, Wolfinger RD, White KP, Passador-Gurgel G,
Gibson G: The contributions of sex, genotype and age to tran-
scriptional variance in Drosophila melanogaster. Nat Genet
2001, 29:389-395.
31. Chen JJ, Delongchamp RR, Tsai CA, Hsueh HM, Sistare F, Thomp-
son KL, Desai VG, Fuscoe JC: Analysis of variance components
in gene expression data. Bioinformatics 2004, 20:1436-1446.
The following Additional files are available online:
Additional File 1
An Excel file containing a list of probe sets that are
differentially expressed by CIA and control rat PBMCs.
See />supplementary/ar1883-S1.xls
Additional File 2
An Excel file showing correlations between the 998
differentially expressed probe sets and laboratory indices
for disease progression.
See />supplementary/ar1883-S2.xls
Additional File 3
An Excel file showing differentially expressed cytokine
related probe sets between CIA and control rats.
See />supplementary/ar1883-S3.xls
Arthritis Research & Therapy Vol 8 No 1 Shou et al.
Page 14 of 14
(page number not for citation purposes)
32. Benjamini Y, Hochberg Y: Controlling the false discovery rate: a
practical and powerful approach to multiple testing. J Roy Stat
Soc 1995, 57:289-300.
33. Weinstein JN, Myers TG, O'Connor PM, Friend SH, Fornace AJ Jr,
Kohn KW, Fojo T, Bates SE, Rubinstein LV, Anderson NL, et al.:
An information-intensive approach to the molecular pharma-
cology of cancer. Science 1997, 275:343-349.
34. Wheeler DL, Church DM, Lash AE, Leipe DD, Madden TL, Pontius
JU, Schuler GD, Schriml LM, Tatusova TA, Wagner L, et al.: Data-
base resources of the National Center for Biotechnology Infor-
mation. Nucleic Acids Res 2001, 29:11-16.
35. Zeeberg BR, Feng W, Wang G, Wang MD, Fojo AT, Sunshine M,
Narasimhan S, Kane DW, Reinhold WC, Lababidi S, et al.: GoM-
iner: a resource for biological interpretation of genomic and
proteomic data. Genome Biol 2003, 4:R28.
36. Ohshima S, Kuchen S, Seemayer CA, Kyburz D, Hirt A, Klinzing S,
Michel BA, Gay RE, Liu FT, Gay S, et al.: Galectin 3 and its bind-
ing protein in rheumatoid arthritis. Arthritis Rheum 2003,
48:2788-2795.
37. Nishida Y, Shinomura T, Iwata H, Miura T, Kimata K: Abnormal
occurrence of a large chondroitin sulfate proteoglycan, PG-M/
versican in osteoarthritic cartilage. Osteoarthritis Cartilage
1994, 2:43-49.
38. Shouda T, Yoshida T, Hanada T, Wakioka T, Oishi M, Miyoshi K,
Komiya S, Kosai K, Hanakawa Y, Hashimoto K, et al.: Induction of
the cytokine signal regulator SOCS3/CIS3 as a therapeutic
strategy for treating inflammatory arthritis. J Clin Invest 2001,
108:1781-1788.
39. Moore JH, Parker JS, Olsen NJ, Aune TM: Symbolic discriminant
analysis of microarray data in autoimmune disease. Genet
Epidemiol 2002, 23:57-69.
40. Gregersen PK, Brehrens TW: Fine mapping the phenotype in
autoimmune disease: the promise and pitfalls of DNA micro-
array technologies. Genes Immun 2003, 4:175-176.
41. Glanzer JG, Eberwine JH: Expression profiling of small cellular
samples in cancer: less is more. Br J Cancer 2004,
90:1111-1114.
42. Shou J, Qian HR, Lin X, Stewart T, Onyia JE, Gelbert LM: Optimi-
zation and validation of small quantity RNA profiling for identi-
fying TNF responses in cultured human vascular endothelial
cells. J Pharmacol Toxicol Methods 2005 in press.
43. Bull TM, Coldren CD, Moore M, Sotto-Santiago SM, Pham DV,
Nana-Sinkam SP, Voelkel NF, Geraci MW: Gene microarray
analysis of peripheral blood cells in pulmonary arterial hyper-
tension. Am J Respir Crit Care Med 2004, 170:911-919.
44. Segman RH, Shefi N, Goltser-Dubner T, Friedman N, Kaminski N,
Shalev AY: Peripheral blood mononuclear cell gene expres-
sion profiles identify emergent post-traumatic stress disorder
among trauma survivors. Mol Psychiatry 2005, 10:500-513.
425
45. Rioja I, Clayton CL, Graham SJ, Life PF, Dickson MC: Gene
expression profiles in the rat streptococcal cell wall-induced
arthritis model identified using microarray analysis. Arthritis
Res Ther 2005, 7:R101-R117.
46. Devauchelle V, Marion S, Cagnard N, Mistou S, Falgarone G,
Breban M, Letourneur F, Pitaval A, Alibert O, Lucchesi C, et al.:
DNA microarray allows molecular profiling of rheumatoid
arthritis and identification of pathophysiological targets.
Genes Immun 2004, 5:597-608.
47. Paulus HE, Oh M, Sharp JT, Gold RH, Wong WK, Park GS, Bulpitt
KJ: Classifying structural joint damage in rheumatoid arthritis
as progressive or nonprogressive using a composite defini-
tion of joint radiographic change: a preliminary proposal.
Arthritis Rheum 2004, 50:1083-1096.
48. Pincus T, Amara I, Koch GG: Continuous indices of core data
set measures in rheumatoid arthritis clinical trials: lower
responses to placebo than seen with categorical responses
with the American College of Rheumatology 20% criteria.
Arthritis Rheum 2005, 52:1031-1036.
49. Pincus T, Sokka T: Uniform databases in early arthritis: specific
measures to complement classification criteria and indices of
clinical change. Clin Exp Rheumatol 2003:S79-S88.